Untargeted Lipidomics in Fabry Disease of Urine Samples by Low-Resolution Flow Injection Mass Spectrometry (ESI(±)-LTQ MS)
- PMID: 40657107
- PMCID: PMC12242645
- DOI: 10.1021/acsomega.5c00894
Untargeted Lipidomics in Fabry Disease of Urine Samples by Low-Resolution Flow Injection Mass Spectrometry (ESI(±)-LTQ MS)
Abstract
Background: Fabry disease (FD) is a lysosomal storage disease caused by genetic mutations related to the coding of the enzyme α-galactosidase A, which is responsible for the metabolism of glycosphingolipids such as globotriaosylceramide and globotriaosylsphingosine. The accumulation of these and other metabolites can occur in various types of cells and impair the functioning of multiple organs and systems, such as the heart, brain, and kidneys. However, with early diagnosis and appropriate therapeutic intervention, the clinical outcome can be significantly improved. This study aimed to analyze the performance of new diagnostic methods for FD using the broad field of lipidomics combined with multivariate analyses, proposing the use of urine as a specimen.
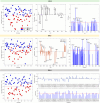
Materials and methods: urine samples were collected from patients with both confirmed (Case) and negative (Control) diagnoses of FD, which were later processed for specific lipid extraction. After extraction, 81 samples (44 cases and 37 controls) were subjected to mass spectrometry analysis, with direct infusion and electrospray ionization in both positive and negative modes (ESI(±)). After spectral acquisition, the data were processed and analyzed using multivariate analysis methods such as Principal Component Analysis (PCA) and Partial Least Squares Discriminant Analysis (PLS-DA).
Results: the combination of both ionization modes for PLS-DA was able to differentiate between the Case and Control groups with 92% accuracy.
Conclusion: this paper suggests that the proposed method of application of lipidomics combined with multivariate analyses as a tool for early diagnosis of FD is promising, enabling and contributing to the improvement of healthcare for these patients.
© 2025 The Authors. Published by American Chemical Society.
Figures


Similar articles
-
Prescription of Controlled Substances: Benefits and Risks.2025 Jul 6. In: StatPearls [Internet]. Treasure Island (FL): StatPearls Publishing; 2025 Jan–. 2025 Jul 6. In: StatPearls [Internet]. Treasure Island (FL): StatPearls Publishing; 2025 Jan–. PMID: 30726003 Free Books & Documents.
-
Systemic treatments for metastatic cutaneous melanoma.Cochrane Database Syst Rev. 2018 Feb 6;2(2):CD011123. doi: 10.1002/14651858.CD011123.pub2. Cochrane Database Syst Rev. 2018. PMID: 29405038 Free PMC article.
-
Diagnostic screening of COVID-19 based on multiomics data by high-resolution mass spectrometry (MALDI (+)-TOF MS and ESI(±)-Orbitrap MS).Metabolomics. 2025 Jun 29;21(4):94. doi: 10.1007/s11306-025-02299-z. Metabolomics. 2025. PMID: 40581904
-
Management of urinary stones by experts in stone disease (ESD 2025).Arch Ital Urol Androl. 2025 Jun 30;97(2):14085. doi: 10.4081/aiua.2025.14085. Epub 2025 Jun 30. Arch Ital Urol Androl. 2025. PMID: 40583613 Review.
-
Intravenous magnesium sulphate and sotalol for prevention of atrial fibrillation after coronary artery bypass surgery: a systematic review and economic evaluation.Health Technol Assess. 2008 Jun;12(28):iii-iv, ix-95. doi: 10.3310/hta12280. Health Technol Assess. 2008. PMID: 18547499
References
-
- Jeyakumar J. M., Kia A., Tam L. C. S., McIntosh J., Spiewak J., Mills K., Heywood W., Chisari E., Castaldo N., Verhoef D., Hosseini P., Kalcheva P., Cocita C., Miranda C. J., Canavese M., Khinder J., Rosales C., Hughes D., Sheridan R., Corbau R., Nathwani A.. Preclinical evaluation of FLT190, a liver-directed AAV gene therapy for Fabry disease. Gene Ther. 2023;30:487–502. doi: 10.1038/s41434-022-00381-y. - DOI - PMC - PubMed
LinkOut - more resources
Full Text Sources
