

Intravitreal Administration of Adalimumab-Loaded Poly(Lactic-co-Glycolic Acid) Nanoparticles: Effects on Biodistribution and Pharmacokinetics
- PMID: 40657186
- PMCID: PMC12245000
- DOI: 10.1002/smsc.202400494
Intravitreal Administration of Adalimumab-Loaded Poly(Lactic-co-Glycolic Acid) Nanoparticles: Effects on Biodistribution and Pharmacokinetics
Abstract
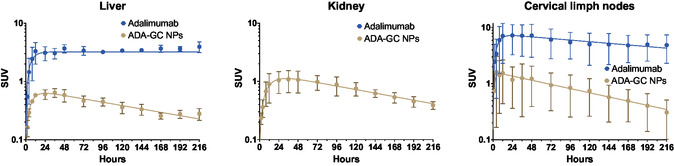
Adalimumab, a monoclonal antibody used for treating inflammatory diseases, including eye diseases, faces challenges in biodistribution and targeted delivery. Nanoparticle (NP)-based drug delivery systems have shown promise in enhancing the pharmacokinetic profiles of biologic drugs. This study aims to develop, and characterize intravitreal adalimumab-loaded poly(lactic-co-glycolic acid) (PLGA) NPs to improve antibody distribution and therapeutic efficacy. Characterization studies, morphological examination, and quantitative, stability, and physical properties are conducted. In vitro release kinetics are assessed using a dialysis membrane method. In vivo biodistribution is studied in rats after intravitreal administration by Positron Emission Tomography/Computed Tomography imaging. The optimized NPs were spherical (around 300 nm) with a surface charge of about -20 mV. Encapsulation efficiency and drug loading reach values close to 100%. Stability studies showed minimal changes in particle size and drug content. In vitro release showed a biphasic pattern with an initial burst release followed by sustained release. Safety studies indicated no significant cytotoxicity or adverse effects. The adalimumab-loaded PLGA NPs demonstrate favorable physicochemical characteristics, stability, and release profiles. In vivo distribution revealed a change in the antibody's distribution pattern after intravitreal administration via NPs encapsulation. These findings suggest the potential for enhanced therapeutic outcomes and warrant further investigation in disease-specific models to explore the clinical potential of this NP-based delivery system.
Keywords: adalimumab; controlled releases; in vivo distribution and pharmacokinetics; nanoparticles; poly(lactic‐co‐glycolic acid).
© 2024 The Author(s). Small Science published by Wiley‐VCH GmbH.
Conflict of interest statement
The authors declare no conflict of interest.
Figures


Similar articles
-
Design and characterization of intravitreal bevacizumab-loaded PLGA nanoparticles: pharmacokinetic and biodistribution impact.Drug Deliv Transl Res. 2025 Jun 5. doi: 10.1007/s13346-025-01891-z. Online ahead of print. Drug Deliv Transl Res. 2025. PMID: 40471504
-
Optimization of Lurasidone HCl-Loaded PLGA Nanoparticles for Intramuscular Delivery: Enhanced Bioavailability, Reduced Dosing Frequency, Pharmacokinetics, and Therapeutic Outcomes.Assay Drug Dev Technol. 2024 Feb-Mar;22(2):53-62. doi: 10.1089/adt.2023.089. Epub 2023 Dec 27. Assay Drug Dev Technol. 2024. PMID: 38150562
-
Poly(Lactic-Co-Glycolic Acid) Microparticles for the Delivery of Model Drug Compounds for Applications in Vascular Tissue Engineering.Cells Tissues Organs. 2024;213(6):475-485. doi: 10.1159/000539971. Epub 2024 Jun 22. Cells Tissues Organs. 2024. PMID: 38934132 Free PMC article.
-
Systemic pharmacological treatments for chronic plaque psoriasis: a network meta-analysis.Cochrane Database Syst Rev. 2017 Dec 22;12(12):CD011535. doi: 10.1002/14651858.CD011535.pub2. Cochrane Database Syst Rev. 2017. Update in: Cochrane Database Syst Rev. 2020 Jan 9;1:CD011535. doi: 10.1002/14651858.CD011535.pub3. PMID: 29271481 Free PMC article. Updated.
-
Systemic pharmacological treatments for chronic plaque psoriasis: a network meta-analysis.Cochrane Database Syst Rev. 2021 Apr 19;4(4):CD011535. doi: 10.1002/14651858.CD011535.pub4. Cochrane Database Syst Rev. 2021. Update in: Cochrane Database Syst Rev. 2022 May 23;5:CD011535. doi: 10.1002/14651858.CD011535.pub5. PMID: 33871055 Free PMC article. Updated.
References
-
- Varela‐Fernández R., Bendicho‐Lavilla C., Martin‐Pastor M., Herrero Vanrell R., Lema‐Gesto M. I., González‐Barcia M., Otero‐Espinar F. J., Int. J. Pharm. 2022, 616, 121504. - PubMed
-
- Kishimoto T. K., Ferrari J. D., Lamothe R. A., Kolte P. N., Griset A. P., O'neil C., Chan V., Browning E., Chalishazar A., Kuhlman W., Fu F., Viseux N., Altreuter D. H., Johnston L., Maldonado R. A., Nat. Nanotechnol. 2016, 11 890. - PubMed
LinkOut - more resources
Full Text Sources
Miscellaneous