. 2025 Jul 8:17:81-94.
doi: 10.2147/EB.S524274. eCollection 2025.

Retinal Vessel Oxygen Saturation in Patients with Unilateral Edema of the Optic Nerve Head: A Pilot Study

Affiliations

Retinal Vessel Oxygen Saturation in Patients with Unilateral Edema of the Optic Nerve Head: A Pilot Study

Michal Březík et al. Eye Brain. .

Abstract

Purpose: Evaluate whether optic disc edema results in changes in retinal microcirculation.

Patients and methods: The study group consisted of 11 patients with unilateral optic disc edema (papilledema). The control group consisted of the healthy eyes of the same 11 patients. Patients underwent non-invasive photo-spectrometric retinal oximetry using Oxymap T1 retinal oximeter (Oxymap, Reykjavik, Iceland). In the eyes of these 11 patients, we examined the diameter of the retinal arteries and veins, arterial and venous blood oxygen saturation, and the difference in oxygen saturation between arterioles and venules (A-V difference).

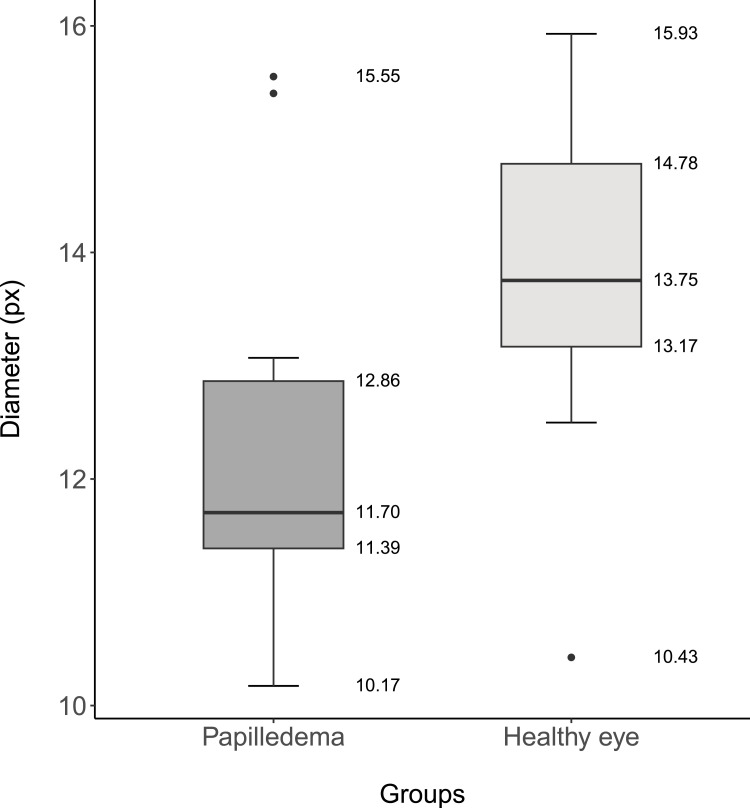
Results: In the papilledema group, the decrease in the retinal arterial diameter was statistically significant (p=0.001). The median diameter of the retinal artery was 11.70 px (IQR 1.47) or after conversion 109.00 µm (IQR 14.00) in the papilledema group and 13.75 px (IQR 1.61) or 128.00 µm (IQR 15.00) in the control group. The increase in the diameter of the retinal veins in the papilledema group was statistically significant (p=0.012), where the median diameter in the papilledema group was 20.88 px (IQR 3.72) or 194.00 µm (IQR 35.00), and in the control group was 18.18 px (IQR 3.60) or 169 µm (IQR 33.00). There was a statistically significant decrease (p<0.001) in the venous saturation in the papilledema group with a median value of 53.16% (IQR 17.38) and 60.02% (IQR 11.98) in the control group. The median of the A-V difference was 51.92 (IQR 15.96) in the papilledema group, resp. 38.49 (IQR 9.75) in the control group and a significant increase in the papilledema group (p<0.001) was reported.

Conclusion: Automatic retinal oximetry demonstrated changes in the retinal microcirculation in patients with optic disc edema.

Keywords: microcirculation; oximetry; papilledema; retina.


Conflict of interest statement

The authors report no conflicts of interest in this work.

Figures

Figure 1
Figure 1
The oxygen saturation and vessel diameters were measured in the range between the two circles (1.5 times the diameter of the optic disc and 3.0 times diameter of the optic disc centered on the optic disc).
Figure 2
Figure 2
We used the diameters of the circles on the healthy eye as the diameters of the circles on the eye with edema of the optic disc.
Figure 3
Figure 3
The resulting values of arterial diameter are shown in pixels. The dark grey boxplot represents the papilledema group, while the light grey boxplot represents the control group.
Figure 4
Figure 4
The resulting values of arterial diameter are shown in micrometers. The dark grey boxplot represents the papilledema group, while the light grey boxplot represents the control group.
Figure 5
Figure 5
The resulting values of venous diameter in pixels. The dark grey boxplot represents the papilledema group, while the light grey boxplot represents the control group.
Figure 6
Figure 6
The resulting values of venous diameter in micrometers. The dark grey boxplot represents the papilledema group, while the light grey boxplot represents the control group.
Figure 7
Figure 7
The resulting values of arterial saturation measured by the device. The dark grey boxplot represents the papilledema group, while the light grey boxplot represents the control group.
Figure 8
Figure 8
The resulting values of arterial saturation after recalibration. The dark grey boxplot represents the papilledema group, while the light grey boxplot represents the control group.
Figure 9
Figure 9
The resulting values of venous saturation. The dark grey boxplot represents the papilledema group, while the light grey boxplot represents the control group.
Figure 10
Figure 10
The resulting values of the ratio of retinal artery diameter to retinal vein diameter in the papilledema group (dark grey boxplot) and the control group (light grey boxplot).
Figure 11
Figure 11
The resulting values of the A-V difference in the papilledema group (dark grey boxplot) and the control group (light grey boxplot).

Similar articles

References

    1. Diblík P. Neurooftalmologie. In: Heissigerová J, editor. Oftalmologie. Prague: Maxdorf sro. 2021:303–306.
    1. Rambousek J, Preiningerová Lízrová J, Česká M B, Hložánek M. Otoky terčů zrakového nervu - společné téma oftalmologů a neurologů. Neurol praxi. 2023;24(2):88–93. doi: 10.36290/neu.2022.074 - DOI
    1. Hübnerová P, Mlčák P, Šínová I, Karhanová M, Šín M. Current use of automatic retinal oximetry – a review. Cesk Slov Oftalmol. 2020;76(1):3–11. doi: 10.31348/2020/1 - DOI - PubMed
    1. Stefansson E, Olafsdottir OB, Einarsdottir AB, et al. Retinal oximetry discovers novel biomarkers in retinal and brain diseases. Invest Ophthalmol Vis Sci. 2017;58(6):BIO0227–BIO0233. doi: 10.1167/iovs.17-21776 - DOI - PubMed
    1. Geirsdottir A, Palsson O, Hardarson SH, Olafsdottir OB, Kristjansdottir JV, Stefánsson E. Retinal vessel oxygen saturation in healthy individuals. Invest Ophthalmol Vis Sci. 2012;53(9):5433–5442. doi: 10.1167/iovs.12-9912 - DOI - PubMed

LinkOut - more resources