. 2025 Jun 20;16(9):2857-2876.
doi: 10.7150/jca.114505. eCollection 2025.

Multi-Omics Analysis Reveals the transforming growth factor-β Signaling-Driven Multicellular Interactions with Prognostic Relevance in Cervical Cancer Progression

Affiliations

Multi-Omics Analysis Reveals the transforming growth factor-β Signaling-Driven Multicellular Interactions with Prognostic Relevance in Cervical Cancer Progression

Yuhan Wang et al. J Cancer. .

Abstract

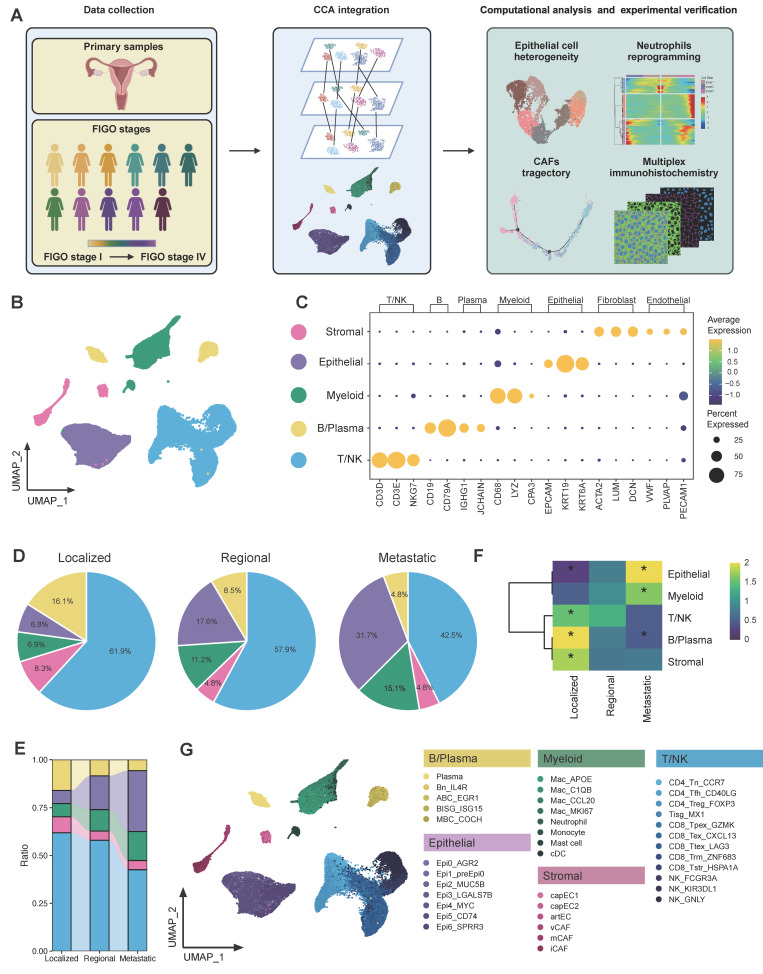
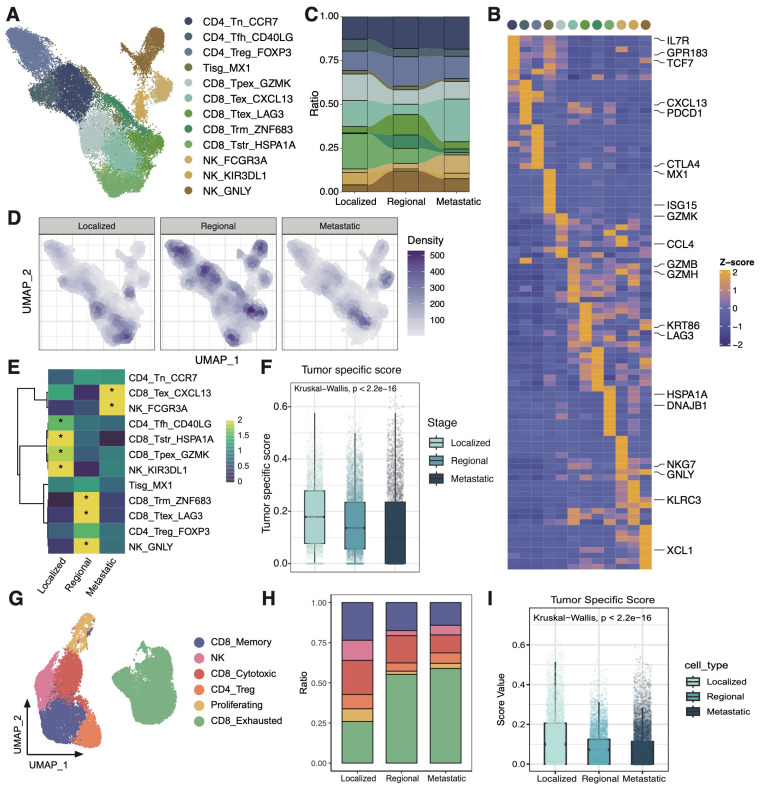
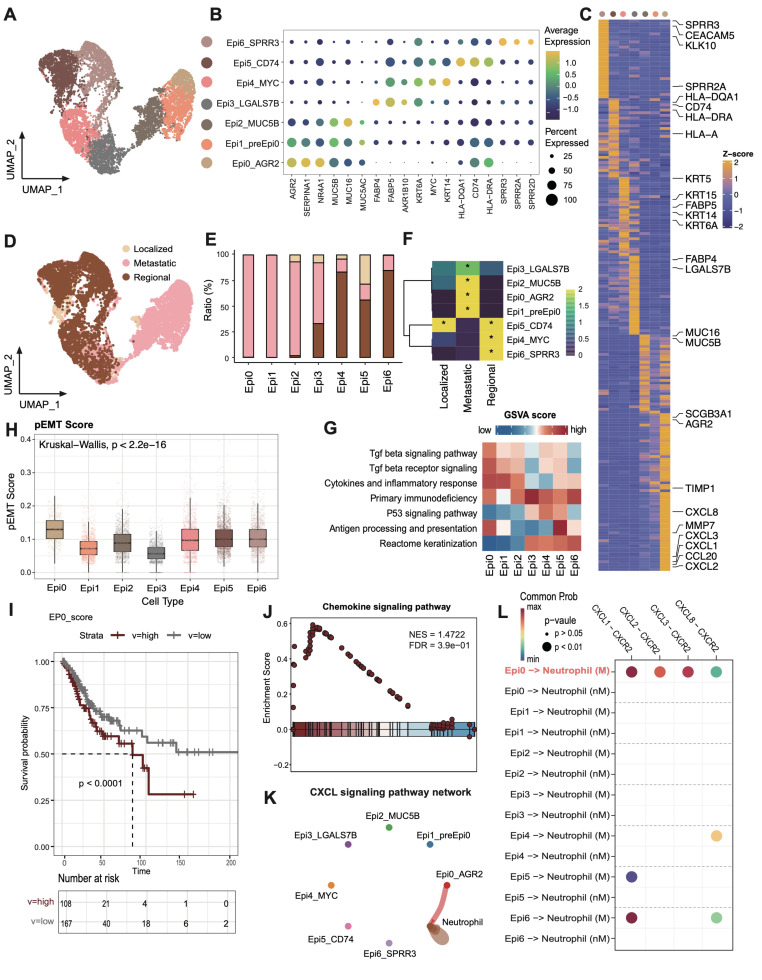
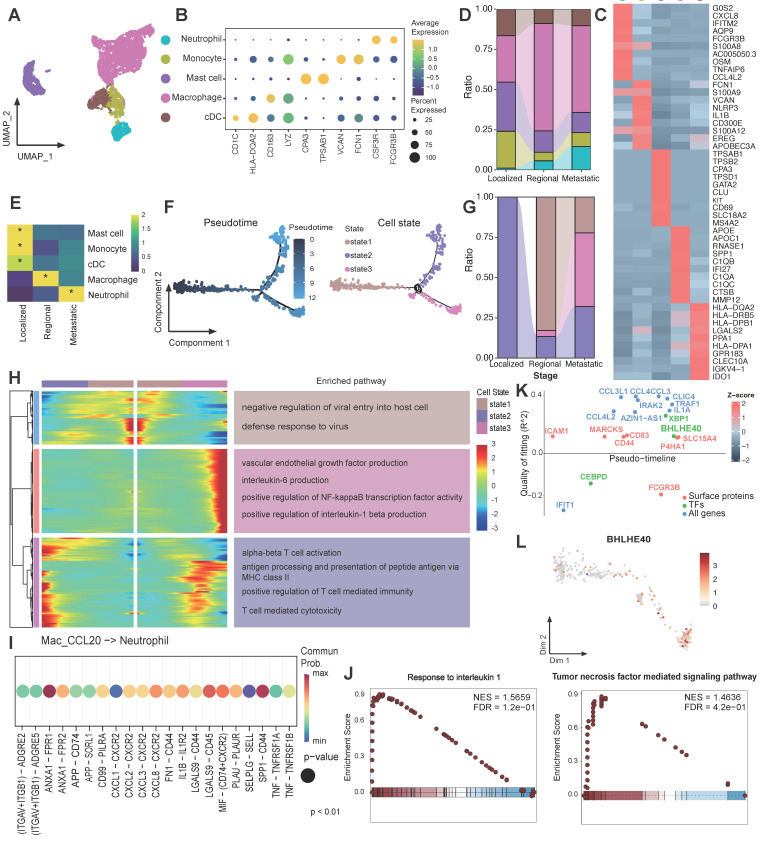
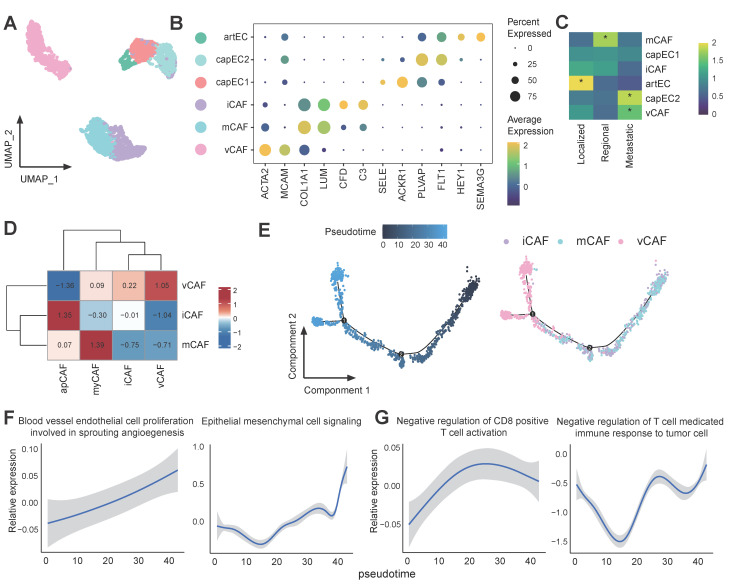
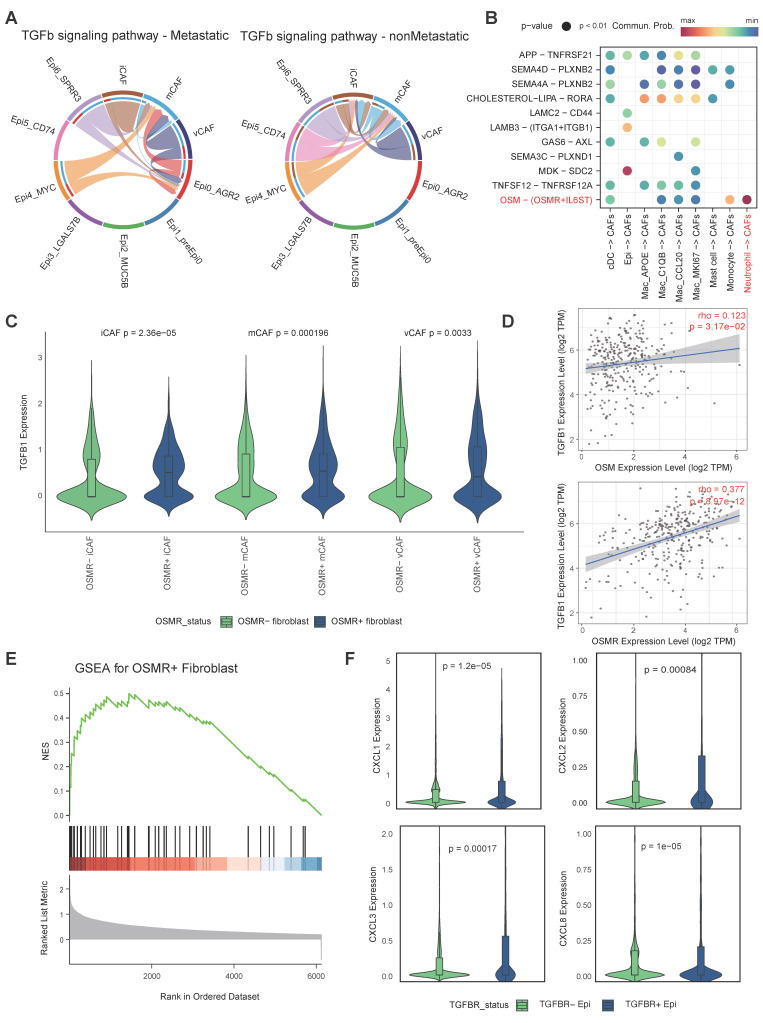
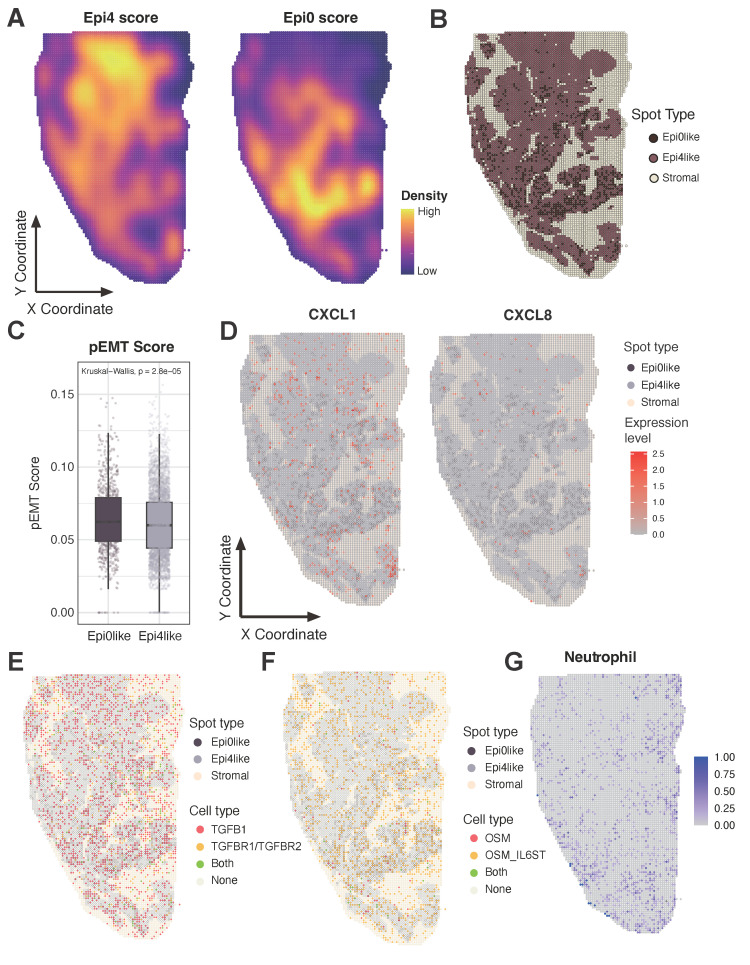
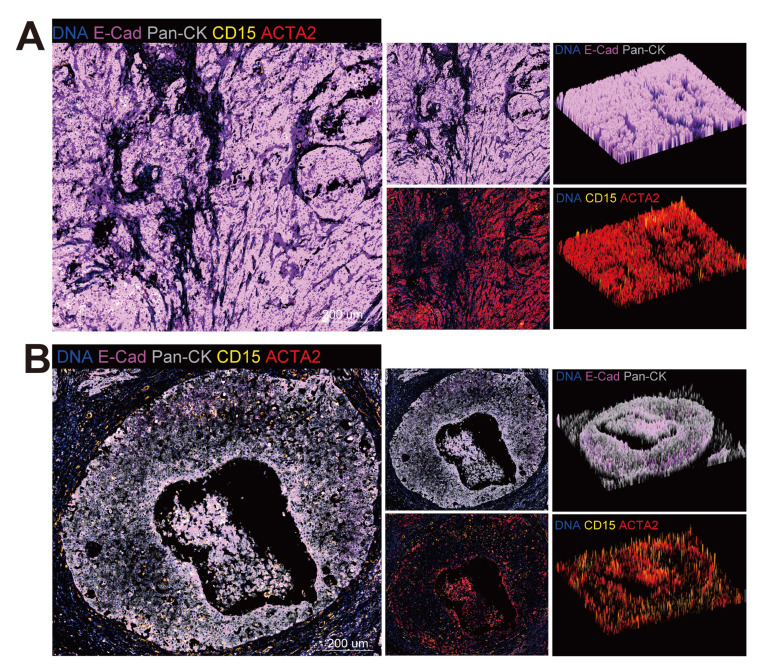
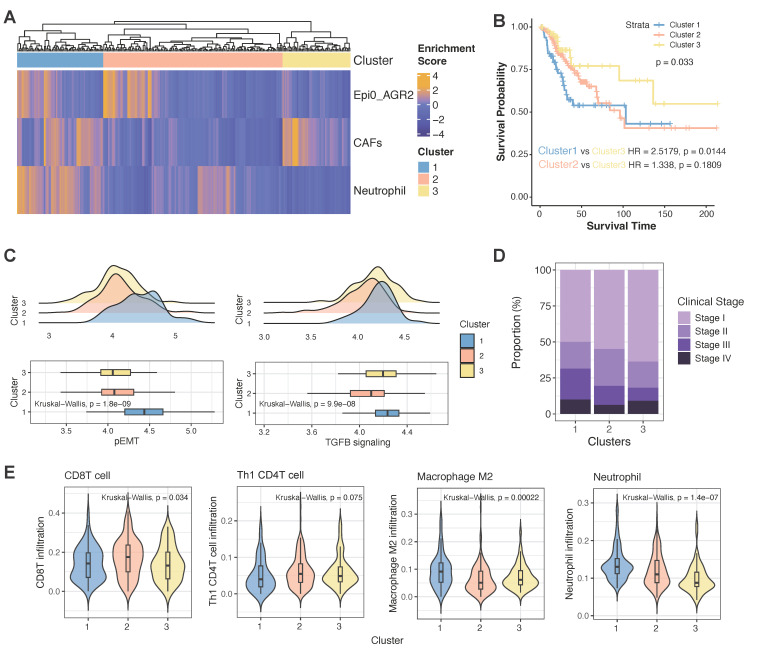
While cervical cancer (CC) prognosis depends on tumor staging, the spatiotemporal evolution of tumor microenvironment (TME) heterogeneity during metastatic progression remains poorly characterized at single-cell resolution. We employed an integrative multi-omics approach, combining single-cell RNA sequencing (scRNA-seq; n = 11), spatial transcriptomics (ST), and bulk RNA-seq data from the TCGA-CESC cohort (n = 304), to systematically map TME remodeling across CC progression stages. scRNA-seq was performed on primary lesions from patients with localized (n = 3), regional (n = 4), and metastatic (n = 4) diseases, with in-depth analyses focusing on cellular characteristics, cell type composition alterations, functional changes, differentiation trajectories, and cell-cell interaction networks. These findings were further validated using spatial transcriptomics, bulk RNA-seq data, and multiple immunohistochemistry (mIHC) experiments. ScRNA-seq data revealed that the TME of the metastatic group displayed a distinct immunosuppressive phenotype. Three key subclusters closely linked to TME remodeling in this group were identified. Notably, a novel metastasis-associated epithelial subpopulation (Epi0_AGR2), characterized by both epithelial-mesenchymal transition (EMT) and chemokine secretory phenotypes, was discovered. Gene Set Variation Analysis (GSVA) revealed that transforming growth factor β (TGF-β) signaling activation served as its primary transcriptional driver. Additionally, a neutrophil subset with pro-tumor and immunosuppressive properties, as well as a cancer-associated fibroblasts (CAFs) subset that promoted angiogenesis, were enriched in the metastatic group. Cell-cell interaction analysis and spatial mapping further revealed the formation of coordinated Epi0-neutrophil-CAFs niches, which established TGF-β-CXCL1/2/8-OSM/OSMR feedforward loops. Importantly, a computational model derived from the TME metastatic niche signature demonstrated significant prognostic stratification in the TCGA cohort (HR = 2.5179, p = 0.0144). In all, this study provides the first comprehensive delineation of stage-specific TME dynamics in CC, revealing TGF-β-driven cellular cooperativity as a metastatic switch. The joint framework establishes a potential clinically translatable tool for precision prognosis and therapeutic targeting.

Keywords: TME; cervical cancer; multi-omics analysis; niche; tumor progression.


Conflict of interest statement

Competing Interests: The authors have declared that no competing interest exists.

Figures

Figure 1
Figure 1
Global analysis of tumor microenvironment in CC patients across different metastatic statuses. (A) Scheme of the overall experimental design for the scRNA-seq analysis of 11 CC patients with different stages. (B) Uniform Manifold Approximation and Projection (UMAP) plot of the major cell types (denoted by colors). (C) Dot plots showing the expression of marker genes of major cell lineages. Dot size represents the fraction of cells expressing the given gene, with colors indicating the normalized expression levels. (D) A Pie chart presenting the proportion of each cell type in the 3 tissue origins. The cell cluster colors are identified in Fig. 1B. (E) Sankey plot illustrating the proportion of 5 major cell types among 3 groups. The cell cluster colors are identified in Fig. 1B. (F) Heatmap showing the ORs of major cell lineages occurring in each group. *OR > 1.5 indicates significant enrichment of the subset in the corresponding tissue; *OR < 0.5 indicated that it was preferable not to distribute in in the corresponding tissue. (G) UMAP plot of 38 subtypes (denoted by colors).
Figure 2
Figure 2
scRNAseq analysis of T cells among 3 groups. (A) UMAP plot of the T cell subsets (denoted by colors). (B) Heatmap showing marker genes of each T cell cluster. (C) Sankey plot illustrating the alteration in cellular composition of T cells among 3 groups. The cell cluster colors are identified in Fig. 2A. (D) UMAP density plots characterizing the distribution of T cells across 3 groups. (E) Heatmap showing the ORs of T cell subsets occurring in each group. *OR > 1.5 indicates significant enrichment of the subset in the corresponding tissue. (F) Boxplots showing the tumor specific score of T cells in 3 groups. Statistical significance was analyzed using Kruskal-Wallis test. The boxplots display the median, upper quartile, and lower quartile. (G) UMAP plot of the T cell subsets in external validation dataset (denoted by colors). (H) Stacked bar graph of the proportion of T cell cluster in each group in external validation dataset. The cell cluster colors are identified in Fig. 2G. (I) Boxplots showing the tumor specific score of T cells in 3 groups in external validation dataset. Statistical significance was analyzed using Kruskal-Wallis test. The boxplots display the median, upper quartile, and lower quartile.
Figure 3
Figure 3
scRNAseq analysis of malignant epithelial cells and identification of premetastatic sub-population. (A) UMAP plot of the epithelial cell subsets (denoted by colors). (B) Dot plot showing the expression of marker genes of each epithelial cell subsets. Dot size represents the fraction of cells expressing the given gene, with colors indicating the normalized expression levels. (C) Heatmap showing marker genes of each epithelial cell cluster. (D) UMAP plot of different stages of the epithelial cell by color. (E) Stacked bar graph of the proportion of epithelial cell cluster in each stage. The stage colors are identified in Fig. 3D. (F) Heatmap showing the ORs of epithelial cell subsets occurring in each group. *OR > 1.5 indicates significant enrichment of the subset in the corresponding tissue. (G) Heatmap showing the GSVA score of phenotypic correlated pathways among epithelial subsets. (H) Boxplots showing the pEMT score of 7 epithelial cell clusters. Statistical significance was analyzed using KruskalWallis test. The boxplots display the median, upper quartile, and lower quartile. (I) Kaplan-Meier survival analysis of the EP0 signature in TCGA CESC cohort (n = 304). The survival curves were compared using the log-rank test. (J) GSEA analysis of Epi0_AGR2 subset. (K) Circle plots showing the CXCL signaling inferred by CellChat among epithelial cell and neutrophils. (L) Dot plot depicting the selected ligand-receptor interactions between epithelial cells and neutrophils. Communication probability and P values were calculated by CellChat, and were indicated by circle colour and size, respectively.
Figure 4
Figure 4
Molecular profile of neutrophils during CC progression. (A) UMAP plot of the myeloid-derived cells (denoted by colors). (B) Dot plot showing the expression of marker genes of each myeloid-derived cell subsets. Dot size represents the fraction of cells expressing the given gene, with colors indicating the normalized expression levels. (C) Heatmap showing marker genes of each myeloid-derived cell cluster. (D) Sankey plot illustrating the alteration in cellular composition of myeloid-derived cells among 3 groups. The cell cluster colors are identified in Fig. 4A. (E) Heatmap showing the ORs of myeloid-derived cell subsets occurring in each group. *OR > 1.5 indicates significant enrichment of the subset in the corresponding tissue. (F) Monocle 2 trajectory analysis of neutrophils. The trajectory was divided into three states indicated as state1, state2, and state3. (G) Sankey plot showing the distribution of neutrophils from different stages in different states. The state colors are identified in Fig. 4F. (H) Heatmap showing the dynamic DEGs and their enriched pathways along the trajectory. These DEGs were divided into three main clusters with different pathways enriched. (I) Dot plot depicting ligand-receptor interactions between neutrophils and Mac_CCL20 in CC tumour microenvironment. Communication probability and P values were calculated by CellChat, and were indicated by circle colour and size, respectively. (J) GSEA analysis of neutrophils in metastasis group. (K) Geneswitches output showing ordering of the top switching genes along the bottom neutrophil axis (State 1 to State 3). Key genes are highlighted with enlarged font size. (L) Expression plots of BHLHE40 of neutrophils on the bottom trajectory (state 1 to state 3).
Figure 5
Figure 5
Characterization of CAFs in metastatic CC. (A) UMAP plot of the stromal subsets (denoted by colors). (B) Dot plot showing the expression of marker genes of each stromal subsets. Dot size represents the fraction of cells expressing the given gene, with colors indicating the normalized expression levels. (C) Heatmap showing the ORs of stromal subsets occurring in each group. *OR > 1.5 indicates significant enrichment of the subset in the corresponding tissue. (D) Heatmap showing expression of reported CAF gene signatures across CAFs clusters. (E) Monocle 2 trajectory analysis of CAFs. (F-G) GSEA analysis of of selected pathways along the pseudo-time.
Figure 6
Figure 6
Cell-cell interations among epithelial cells, neutrophils and CAFs. (A) Circle plots showing the TGF-β signaling inferred by CellChat among epithelial cell and CAFs. (B) Dot plot depicting the ligand-receptor interactions between epithelial cells myeloid cells and CAFs. Communication probability and P values were calculated by CellChat, and were indicated by circle colour and size, respectively. (C) Violin plots showing expression level of TGF-β in CAFs subtypes according to positive or negitive OSMR expression. P values were determined using wilcox.test. (D) Correlation of OSM and OSMR levels with TGFB1 expression in CC samples. Spearman's correlation coefficients and P values are shown. TPM, transcript count per million reads. (E) GSEA showing enrichment of the indicated signatures in OSMRpos CAFs. NES, normalized enrichment score. (F) Truncated violin plots showing expression level of indicated chemotaxis in epithelial cells according to positive or negitive TGFBR expression. P values were determined using wilcox.test.
Figure 7
Figure 7
Unique spatial distribution of Epi0 subset in ST sample, co-localizing with neutrophils and showing enhanced CXCL and OSM signaling pathways. (A) Epithelial subset signatures in ST data. (B) The spot distribution of Epi0, Epi4 and stromal cells in ST data. Epi0, Epi4 and stromal subsets were identified by utilizing corresponding highest-scoring subset signatures from scRNA-seq data. (C) Boxplots showing the pEMT score of Epi0like and Epi4like spots identified in ST data. Statistical significance was analyzed using KruskalWallis test. The boxplots display the median, upper quartile, and lower quartile. (D) Expression levels of CXCL1 and CXCL8 in ST data. (E) The distribution of cells with different TGFB and TGFBR expression in ST data. (F) The distribution of cells with different OSM expression in ST data. (G) Neutrophils signatures in ST data.
Figure 8
Figure 8
Cell colocalization in different stages of CC. (A) Epithelial cells, CAFs and neutrophils in center zone of the tumor area are exhibited by mIHC via differential markers as follow: epithelial cells: Pan-CK+, neutrophils: CD15+, CAFs: ACTA2+; Pan-CK+E-Cad- cells represent epithelial cells that are undergoing EMT. scale = 200μm. (B) Epithelial cells, CAFs and neutrophils in edge zone of the tumor area are exhibited by mIHC via differential markers as follow: epithelial cells: Pan-CK+, neutrophils: CD15+, CAFs: ACTA2+; Pan-CK+E-Cad- cells represent epithelial cells that are undergoing EMT. scale = 200μm.
Figure 9
Figure 9
Co-occurrence of epithelial cells, CAFs and neutrophils predicts poor outcomes for TCGA CC patients. (A) Unsupervised hierarchical clustering for patients from the TCGA dataset based on the correlation to Epi0_AGR2, CAFs and neutrophils. (B) Comparison of overall survival (OS) rates for three clusters identified in Fig. 9A. P values are calculated using the log-rank test. (C) Histogram showing the proportion of different clinical stages in three clusters identified in Fig. 9A. (D) Boxplots showing the pEMT and TGFB_signaling scores of three clusters identified in Fig. 9A. Statistical significance was analyzed using Kruskal-Wallis test. The boxplots display the median, upper quartile, and lower quartile. (E) Violin plots showing the score of different cell signatures in three clusters identified in Fig. 9A. Statistical significance was analyzed using Kruskal-Wallis test.

Similar articles

References

    1. Li H, Wu X, Cheng X. Advances in diagnosis and treatment of metastatic cervical cancer. J Gynecol Oncol. 2016;27:e43. - PMC - PubMed
    1. Sung H, Ferlay J, Siegel RL, Laversanne M, Soerjomataram I, Jemal A. et al. Global Cancer Statistics 2020: GLOBOCAN Estimates of Incidence and Mortality Worldwide for 36 Cancers in 185 Countries. CA Cancer J Clin. 2021;71:209–49. - PubMed
    1. Oaknin A, Gladieff L, Martinez-Garcia J, Villacampa G, Takekuma M, De Giorgi U. et al. Atezolizumab plus bevacizumab and chemotherapy for metastatic, persistent, or recurrent cervical cancer (BEATcc): a randomised, open-label, phase 3 trial. Lancet. 2024;403:31–43. - PubMed
    1. Wu X, Sun Y, Yang H, Wang J, Lou H, Li D. et al. Cadonilimab plus platinum-based chemotherapy with or without bevacizumab as first-line treatment for persistent, recurrent, or metastatic cervical cancer (COMPASSION-16): a randomised, double-blind, placebo-controlled phase 3 trial in China. Lancet. 2024;404:1668–76. - PubMed
    1. Lorusso D, Xiang Y, Hasegawa K, Scambia G, Leiva M, Ramos-Elias P. et al. Pembrolizumab or placebo with chemoradiotherapy followed by pembrolizumab or placebo for newly diagnosed, high-risk, locally advanced cervical cancer (ENGOT-cx11/GOG-3047/KEYNOTE-A18): a randomised, double-blind, phase 3 clinical trial. Lancet. 2024;403:1341–50. - PubMed

LinkOut - more resources