

The correlation between intraocular pressure and choroidal microcirculation in patients with high myopia
- PMID: 40657382
- PMCID: PMC12244010
- DOI: 10.7150/ijms.113035
The correlation between intraocular pressure and choroidal microcirculation in patients with high myopia
Abstract
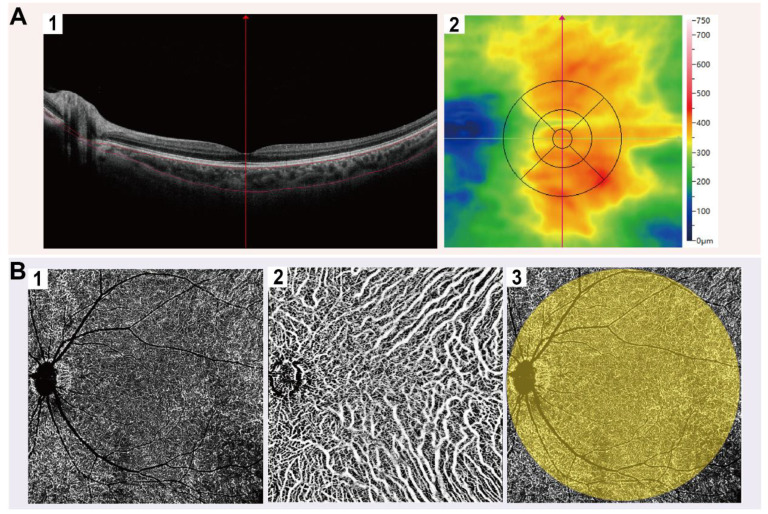
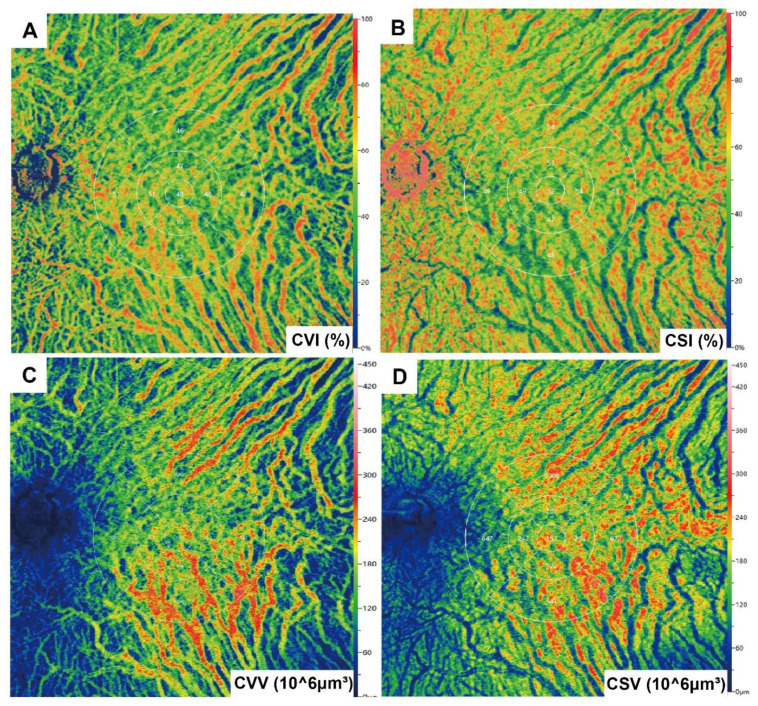
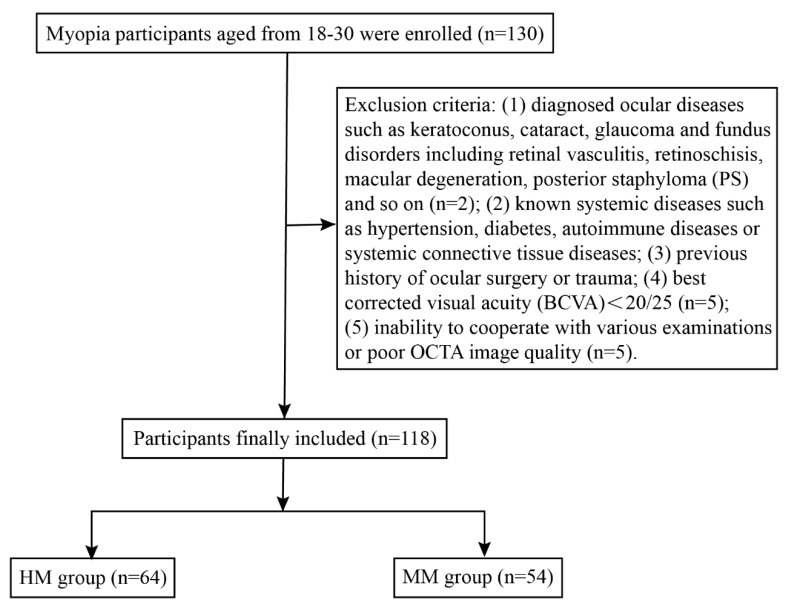
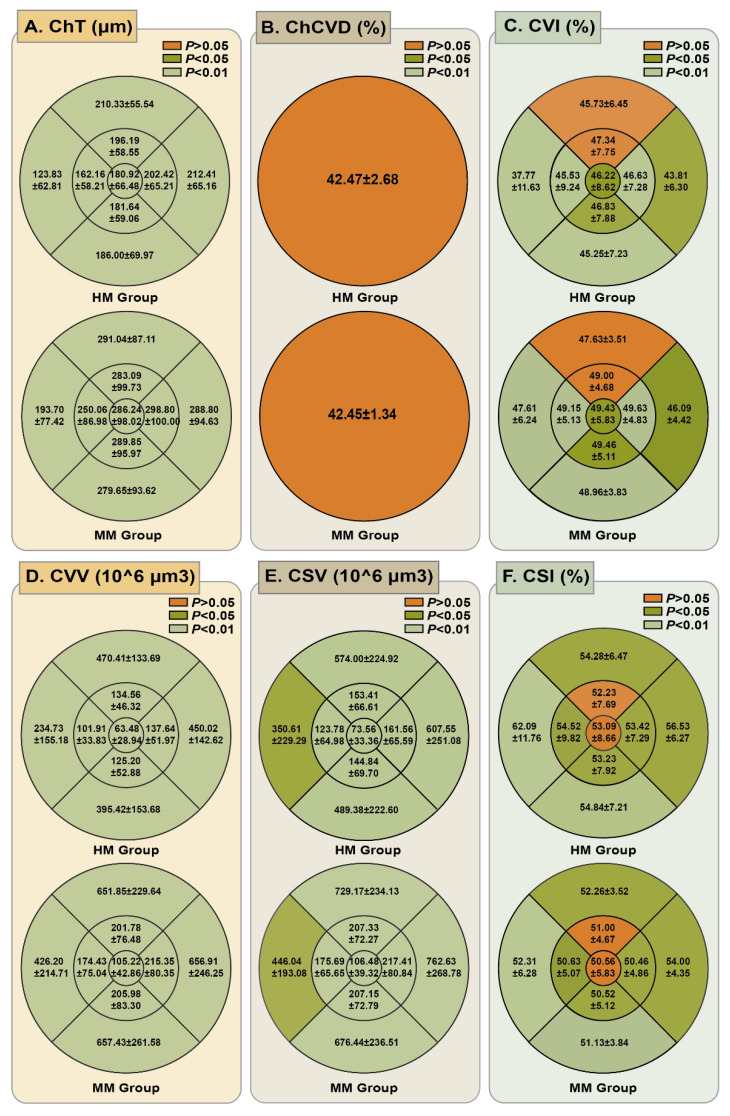
Background: High myopia (HM) is a leading cause of visual impairment worldwide and the choroid plays a key role in HM progression. Intraocular pressure (IOP) may also be involved in HM development, while the relationship between IOP and choroidal microcirculation in HM patients remains poorly characterized. Purpose: To investigate the correlation between IOP and choroidal microcirculation in HM individuals using swept-source optical coherence tomography angiography (SS-OCTA). Methods: This cross-sectional observational study enrolled 118 eyes of 118 participants aged 18-30, comprising 64 HM eyes (axial lengths (AL) ≥ 26mm) and 54 mild-to-moderate myopic (MM) eyes (AL < 26 mm). Data on spherical equivalent (SE), AL and central corneal thickness (CCT) were collected. IOP was measured using a non-contact tonometer (NCT) and corrected with a formula to minimize the effect of CCT. Based on ETDRS classification, choroidal thickness (ChT) and vascular parameters including choriocapillaris layer vessel density (ChCVD), choroidal vascular index (CVI), choroidal vascular volume (CVV), choroidal stromal volume (CSV) and choroidal stromal density (CSI) were calculated from SS-OCTA. Results: In this cohort, HM eyes exhibited higher corrected IOP (P < 0.05) and lower ChT, CVV and CSV across all grids compared to MM eyes (P < 0.001). Increased CSI and decreased CVI were also observed in most sectors of the HM eyes (P < 0.05). After adjusting for age, gender and AL, corrected IOP was correlated with SE, ChT, CVI and CSI in the subfoveal central and inner nasal grids among HM patients (P < 0.05). No significant correlation was found between AL and corrected IOP (P > 0.05). Conclusion: In our population, compared to MM eyes, HM eyes showed higher IOP levels, which were negatively correlated with SE but not AL. Additionally, elevated IOP was observed to be associated with reduced choroidal thickness and vascularity in specific macular regions. The potential link between IOP and choroidal microcirculation may be involved in HM progression.
Keywords: choroidal thickness; choroidal vascularity; high myopia; intraocular pressure; swept-source optical coherence tomography angiography.
© The author(s).
Conflict of interest statement
Competing Interests: The authors have declared that no competing interest exists.
Figures
Similar articles
-
Choroidal Characteristics in 3- to 16-Year-Old Chinese Patients, Measured by Swept-Source OCT/OCT Angiography.Ophthalmol Sci. 2025 Jul 1;5(6):100869. doi: 10.1016/j.xops.2025.100869. eCollection 2025 Nov-Dec. Ophthalmol Sci. 2025. PMID: 40823503 Free PMC article.
-
Interocular differences in choroidal thickness and circulation in anisomyopic adults and their association with myopia severity.Front Med (Lausanne). 2025 Jul 21;12:1641704. doi: 10.3389/fmed.2025.1641704. eCollection 2025. Front Med (Lausanne). 2025. PMID: 40761861 Free PMC article.
-
Comparison of intraocular pressure measurements obtained by Goldmann applanation tonometer, corvis ST and a conventional non-contact airpuff tonometer in eyes with previous myopic refractive surgery and correlation with corneal biomechanical parameters.Int Ophthalmol. 2025 Jun 6;45(1):232. doi: 10.1007/s10792-025-03598-z. Int Ophthalmol. 2025. PMID: 40478442
-
Comprehensive assessment of glaucoma in patients with high myopia: a systematic review and meta-analysis with a discussion of structural and functional imaging modalities.Int Ophthalmol. 2024 Oct 11;44(1):405. doi: 10.1007/s10792-024-03321-4. Int Ophthalmol. 2024. PMID: 39392516 Free PMC article.
-
Device-modified trabeculectomy for glaucoma.Cochrane Database Syst Rev. 2015 Dec 1;2015(12):CD010472. doi: 10.1002/14651858.CD010472.pub2. Cochrane Database Syst Rev. 2015. Update in: Cochrane Database Syst Rev. 2023 Mar 13;3:CD010472. doi: 10.1002/14651858.CD010472.pub3. PMID: 26625212 Free PMC article. Updated.
References
-
- Baird PN, Saw SM, Lanca C, Guggenheim JA, Smith Iii EL, Zhou X. et al. Myopia. Nature reviews Disease primers. 2020;6:99. - PubMed
-
- Liang J, Pu Y, Chen J, Liu M, Ouyang B, Jin Z. et al. Global prevalence, trend and projection of myopia in children and adolescents from 1990 to 2050: a comprehensive systematic review and meta-analysis. The British journal of ophthalmology. 2025;109:362–71. - PubMed
-
- Holden BA, Fricke TR, Wilson DA, Jong M, Naidoo KS, Sankaridurg P. et al. Global Prevalence of Myopia and High Myopia and Temporal Trends from 2000 through 2050. Ophthalmology. 2016;123:1036–42. - PubMed
-
- Fang Y, Yokoi T, Nagaoka N, Shinohara K, Onishi Y, Ishida T. et al. Progression of Myopic Maculopathy during 18-Year Follow-up. Ophthalmology. 2018;125:863–77. - PubMed
Publication types
MeSH terms
LinkOut - more resources
Full Text Sources
