. 2025 Jul 7:20:8811-8831.
doi: 10.2147/IJN.S515771. eCollection 2025.

Glioma-Associated Mesenchymal Stromal/Stem Cells Derived Exosomal miR-191 Promotes the Proneural-to-Mesenchymal Transition in Glioblastoma Cells via PTEN/PI3K/AKT Signaling

Affiliations

Glioma-Associated Mesenchymal Stromal/Stem Cells Derived Exosomal miR-191 Promotes the Proneural-to-Mesenchymal Transition in Glioblastoma Cells via PTEN/PI3K/AKT Signaling

Peng Lv et al. Int J Nanomedicine. .

Abstract

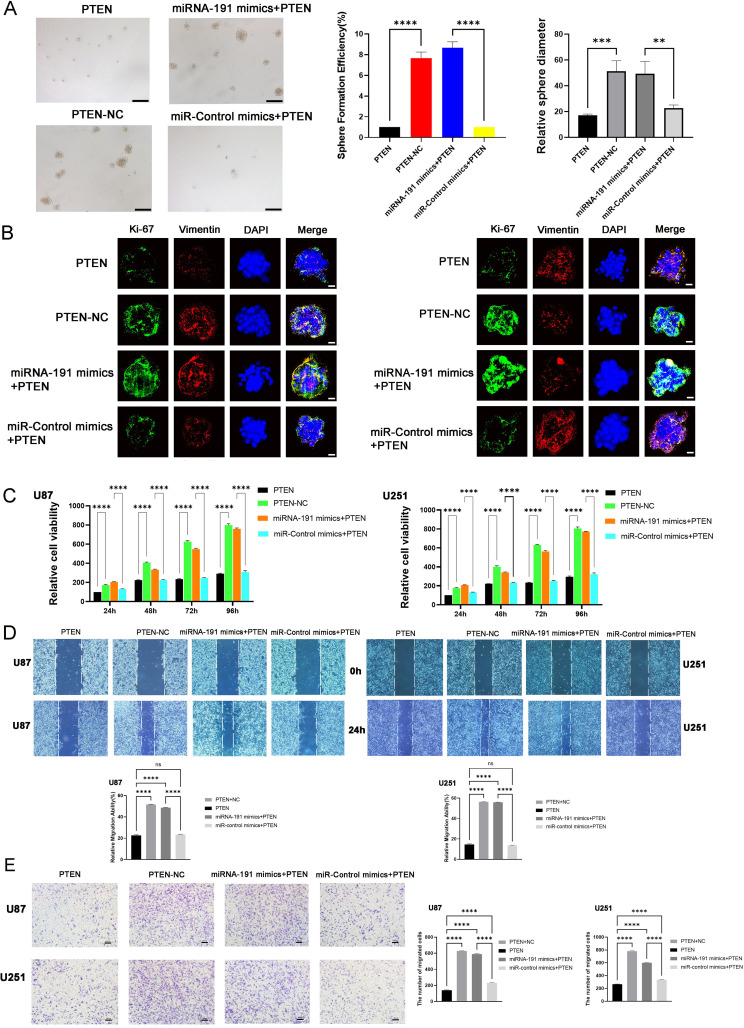
Background: The proneural-to-mesenchymal transition (PMT) represents a crucial phenotypic transformation in glioblastoma. Glioma-associated mesenchymal stromal/stem cells (GaMSCs) play a significant role in diverse biological processes of gliomas. However, the impact of exosomes released from GaMSCs (GaMSCs-Exos) on the PMT of glioblastoma remains inadequately understood. This study aimed to explore the effects and mechanisms of GaMSCs-derived exosomal miRNA-191-5p on the PMT of glioblastoma.

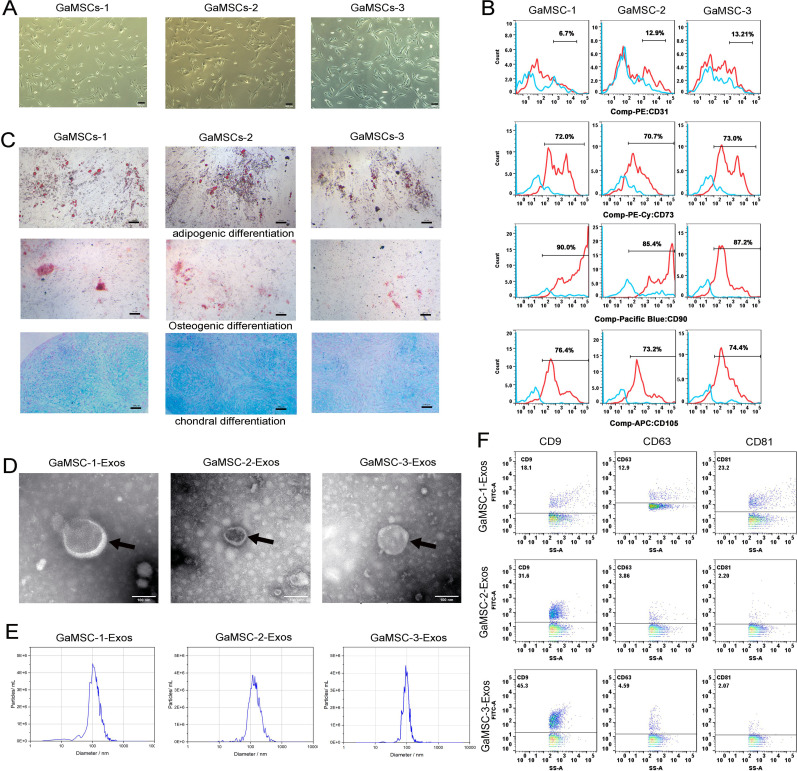
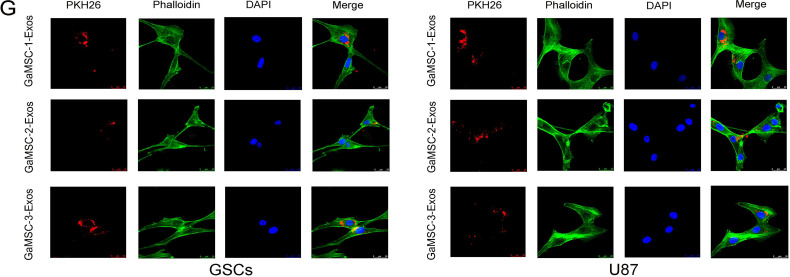
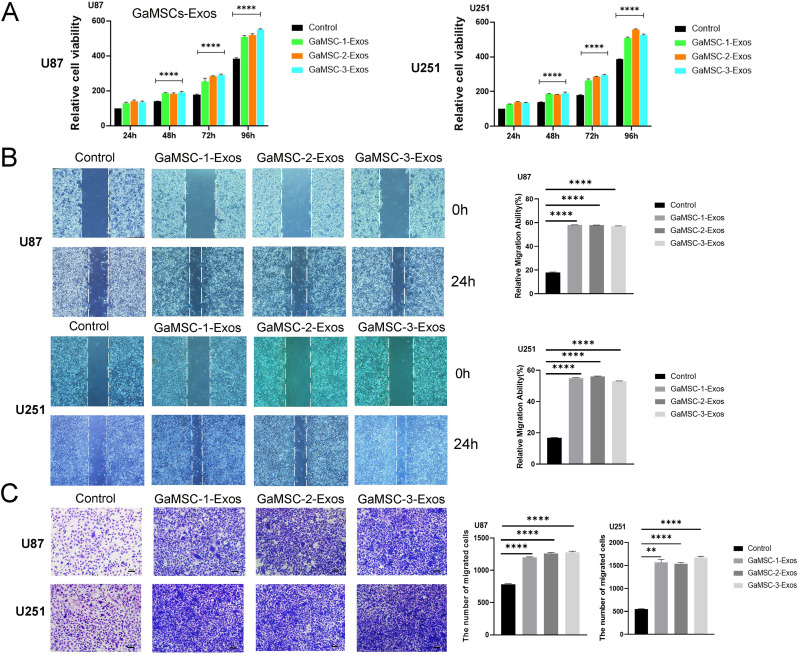
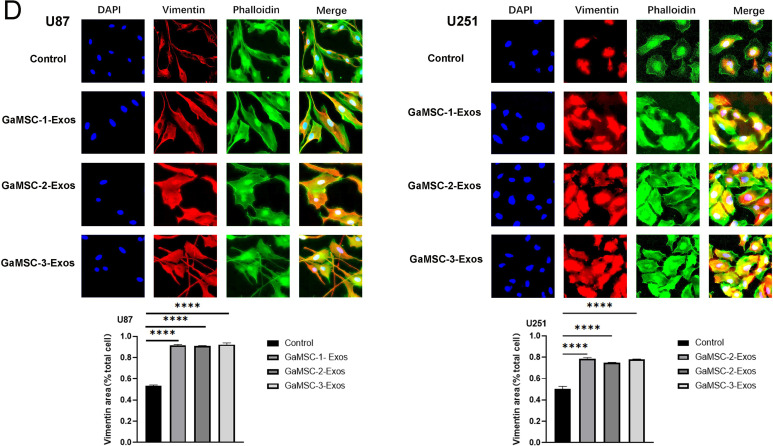
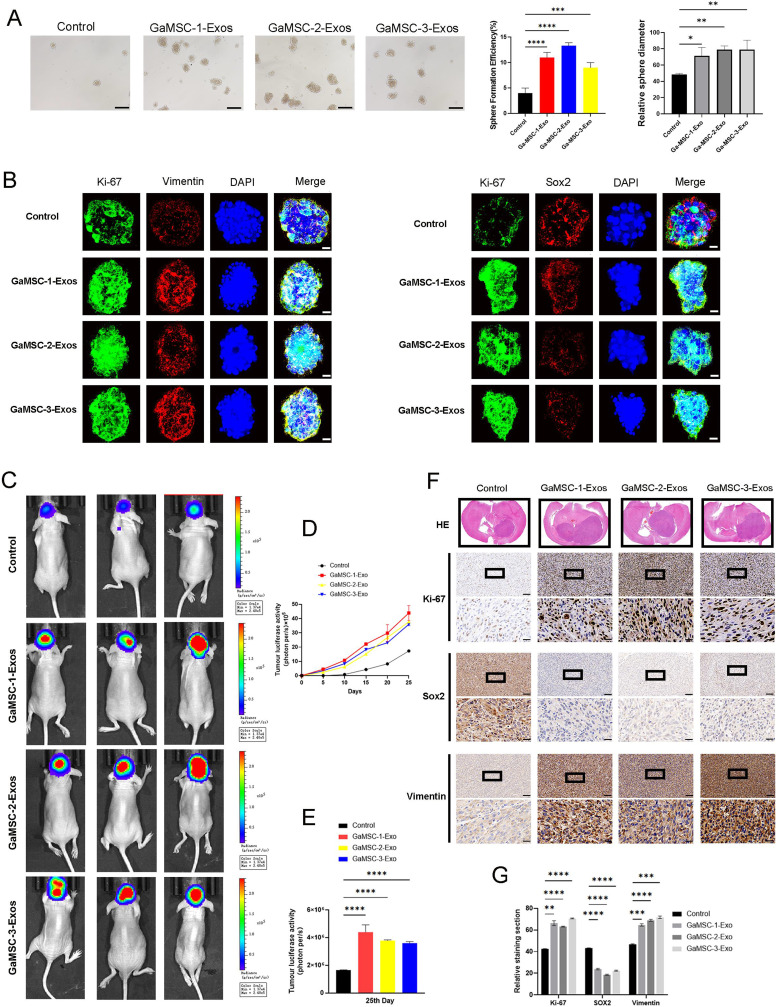
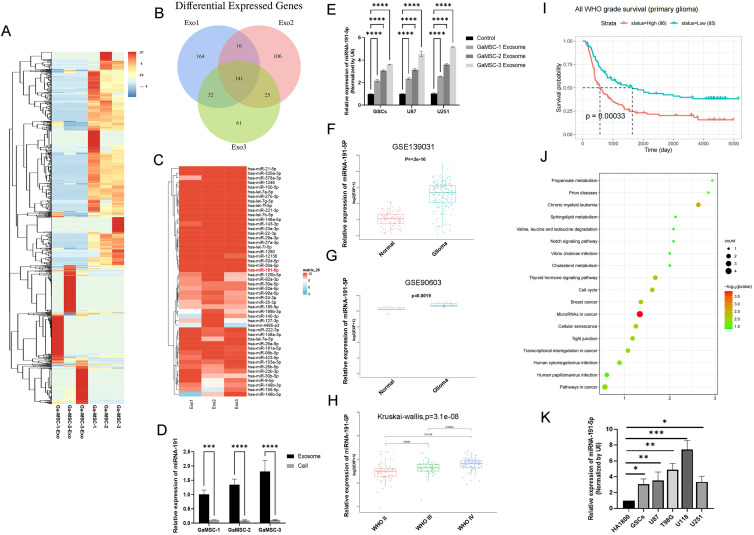
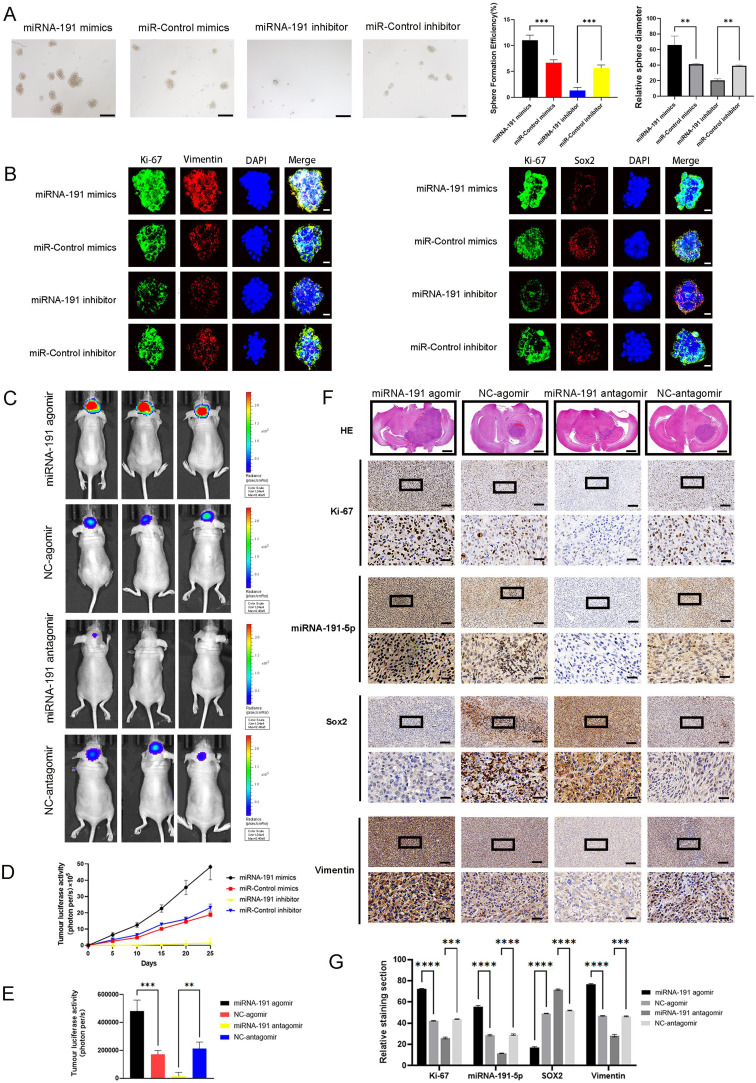
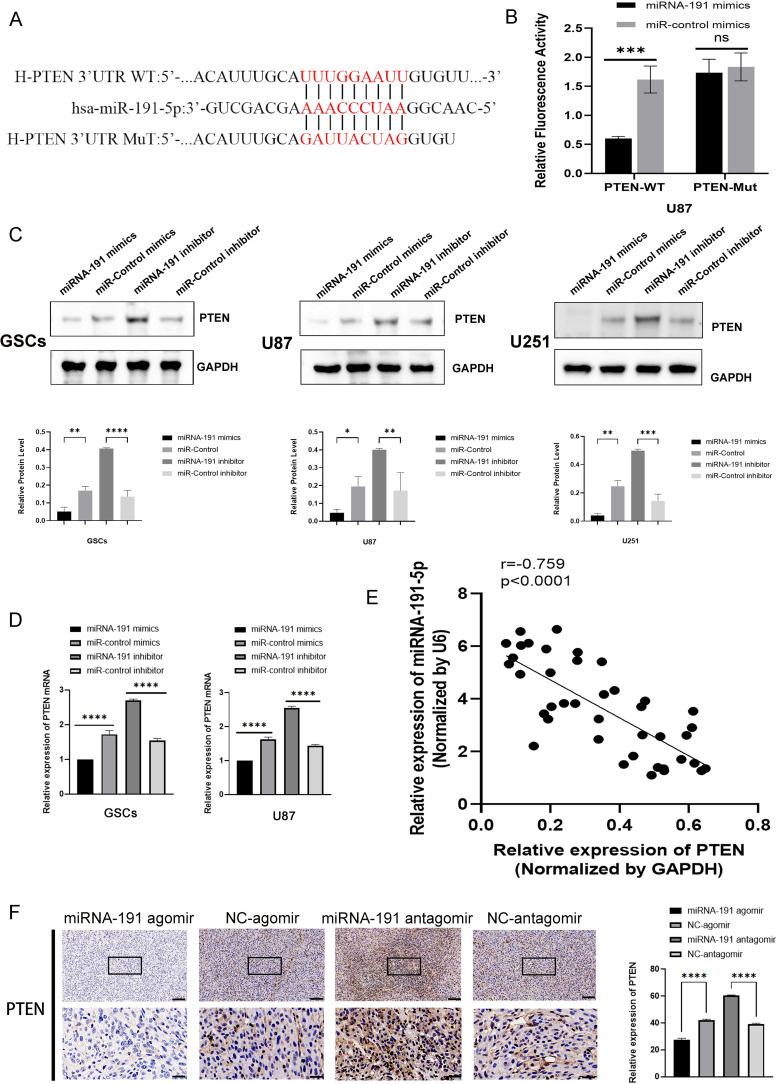
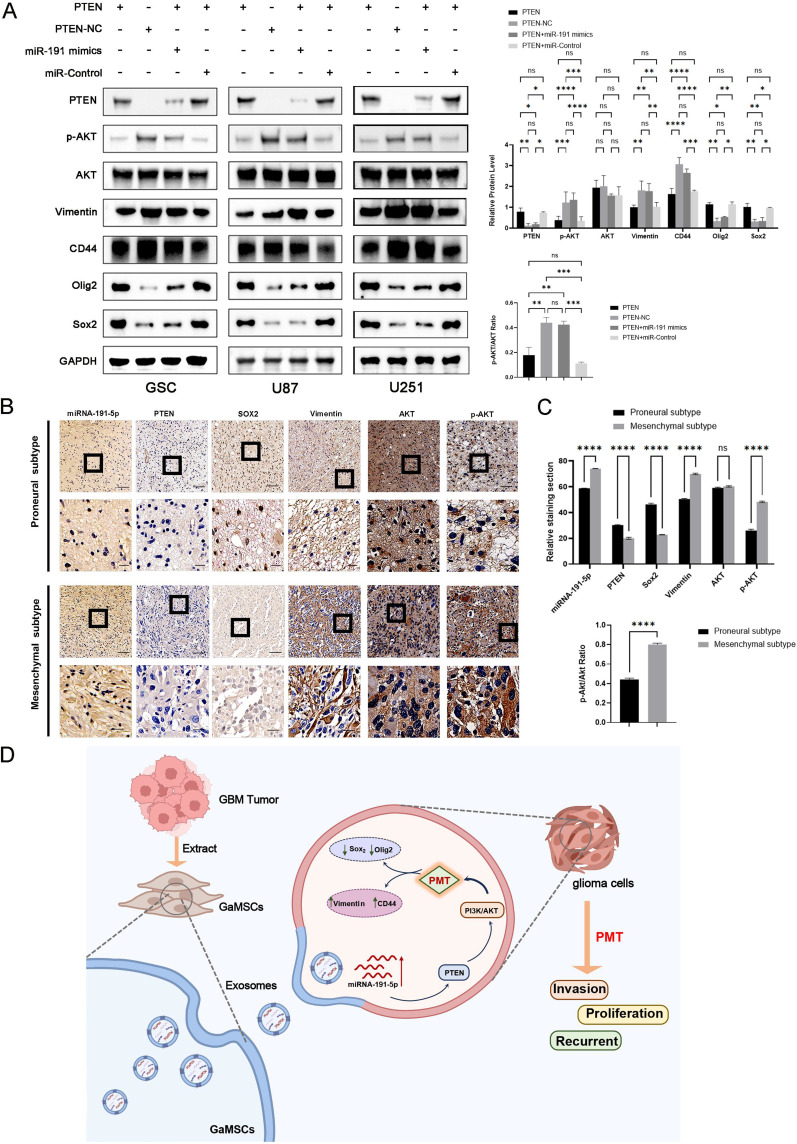
Methods and results: Conditioned medium from three independently established GaMSCs lines (GaMSCs-CM) significantly enhanced the tumorigenicity of glioma cells. Further analysis demonstrated that GaMSC-Exos, isolated from GaMSCs-CM, promoted both the tumorigenicity and PMT of glioma cells, both in vitro and in vivo. Exosomal miR-191-5p derived from GaMSCs was identified as the principal mediator. Overexpression and inhibition of miR-191-5p affected the tumorigenicity and PMT of glioma cells, in both laboratory and animal models. Bioinformatics analyses and luciferase reporter assays confirmed that miR-191-5p targets PTEN. Additionally, rescue experiments indicated that increased PTEN expression could reverse the effects of miR-191-5p overexpression on tumorigenicity and PMT through modulation of the PI3K/AKT signaling pathway.

Conclusion: Our findings highlight the role of GaMSC-Exos in mediating the intercellular transfer of miRNA-191-5p, which facilitates the PMT of glioma. The process underlying the enhanced aggressiveness and PMT is driven by miR-191-5p, promoting glioma progression by targeting PTEN and activating the PI3K/AKT signaling pathway.

Keywords: exosomes; glioma-associated mesenchymal stromal/stem cells; miR-191-5p; proneural to mesenchymal transition.


Conflict of interest statement

The authors declare no competing interests in this work.

Figures

Figure 1
Figure 1
Continued.
Figure 1
Figure 1
Characterization of GaMSCs and Identification of GaMSCs-Exos. (A) GaMSCs exhibit a flat fusiform shape in MSC medium (scale bars = 100 μm). (B) Flow cytometric analysis confirmed the presence of MSC markers (CD31, CD105, CD73, and CD90) in GaMSCs lines cultured in vitro. (C) Three groups of GaMSCs lines successfully differentiated into osteoblasts, adipocytes and chondrocytes (scale bars = 100 μm). (D) Transmission electron microscopy (TEM) was employed to image three groups of GaMSCs-Exos (scale bar = 100 nm).The black arrows indicate the exosomes. (E) Nanoparticle Tracking Analysis (NTA) measured the size and concentration of three groups of GaMSC-Exos. (F) Flow NanoAnalyzer analysis the surface markers of GaMSC-Exos (CD9,CD63 and CD81). (G) Absorption of GaMSC-Exos by GSCs and U87 was visualized; PKH26-labeled exosomes appeared red, glioma cells stained with 488-Phalloidin were green, and nuclei stained with DAPI were blue (scale bar = 25 μm).
Figure 2
Figure 2
Continued.
Figure 2
Figure 2
GaMSCs-Exos Enhanced Proliferation, Invasion, and Mesenchymal Subtype Formation in U87 and U251 Cells (A) CCK-8 assays show enhanced proliferation in U251 and U87 cells cultured with GaMSCs-Exos; significant increase compared to control (****P < 0.0001). (B) Wound healing assays indicate increased migration in U251 and U87 cells treated with GaMSCs-Exos; significant improvement compared to control (****P < 0.0001). (C) Transwell assays reveal a marked increase in the invasiveness of U251 and U87 cells cultured with GaMSCs-Exos (**P < 0.01; ****P < 0.0001; scale bar = 100 μm); (D) Immunocytochemistry confirmed increased vimentin expression and its subcellular localization in U87 and U251 cells treated with GaMSCs-Exos. Quantification of the vimentin area proportions (%) of the cells cultured with GaMSCs-Exos using ImageJ; substantial elevation compared to control (****P < 0.0001, scale bar = 200 μm). Data represent mean ± SEM from three independent experiments; statistical significance assessed using two-tailed Student’s t-tests or one-way ANOVA followed by Dunnett’s test for multiple comparisons: **P < 0.01; ****P < 0.0001.
Figure 3
Figure 3
GaMSCs-Exos Promote Tumorigenicity and Formation of Mesenchymal Glioblastoma Subtypes in GSCs. (A) Bright field microscopy revealed enhanced sphere formation in GSCs treated with GaMSCs-Exos compared to control. Left: statistics of sphere counts; right: quantification of sphere diameters (scale bar = 200 µm). (B) Immunofluorescence images depict Vimentin/Sox2 in red and Ki-67 in green expression in GSCs treated with GaMSCs-Exos. Nuclei were counterstained with DAPI (blue) (scale bar = 25 µm). (C) Bioluminescent imaging tracked intracranial tumor growth in xenograft nude mice bearing luciferase-expressing GSCs treated with GaMSCs-Exos and control on day 25. Intensity of bioluminescence is represented on a color scale (photons/s/cm²/steradian); n = 3. (D) Bioluminescent images were recorded every 5 days to monitor tumor growth dynamics. (E) Histogram analysis quantified the luminescence indicating tumor size on day 25. (F) Representative images of H&E staining show histological features (scale bar = 1 mm, n=3), and IHC staining demonstrates Ki67, Sox2, and Vimentin expression (upper panels, scale bar = 100 µm; lower panels, scale bar = 25 µm, n=3) in intracranial xenografts. (G) Histogram analysis presents relative expression levels of Ki67, Vimentin, and Sox2 in xenograft tissues. Data represent mean ± SEM from three independent experiments; statistical significance determined by two-tailed Student’s t-tests or one-way ANOVA followed by Dunnett’s tests for multiple comparisons: *P < 0.05; **P < 0.01; ***P < 0.001; ****P < 0.0001.
Figure 4
Figure 4
Elevated Expression of miRNA-191-5p in GaMSCs-Exos. (A) A heatmap displays differentially expressed miRNAs in exosomes from three groups of Ga-MSCs lines and GaMSCs-Exos, analyzed using deep sequencing on the ACGT101-miR(v4.2) platform. (B) Venn diagram showing the intersection of the top 141 miRNAs common to three groups of GaMSCs-Exos. (C) A heatmap illustrates the intersection of the top 50 miRNAs across three groups of GaMSCs-Exos.Red text indicates significantly upregulated miRNAs. (D) Expression levels of miRNA-191-5p in three groups of GaMSCs-Exos and GaMSCs, quantified by RT-qPCR. (E) Increased levels of miRNA-191-5p in GSCs, U87, and U251 cells treated with GaMSCs-Exos compared to control, as determined by RT-qPCR. (F) (G) Analysis of miRNA-191-5P expression in normal and glioma samples from datasets GSE139031 and GSE90603; blue represents normal samples, red represents glioma samples. (H) The expression of miRNA-191-5p across different glioma grades in the CGGA database; red indicates WHO grade II, green WHO grade III, and blue WHO grade IV glioma samples. (I) Kaplan-Meier survival curves compare overall survival in primary glioma patients with high versus low expression of miRNA-191-5p in the CGGA database; low expression correlates with longer survival (P = 0.00033). Survival analysis utilized the Log rank test. (J) KEGG pathway enrichment analysis of miRNA-191-5p conducted using Kobas 3.0.(K) Expression of miRNA-191-5p in glioma cell lines detected by RT-qPCR. GSCs, U251 and U87 was selected for follow-up tests. Data are presented as mean ± SEM from three independent experiments; statistical significance assessed by two-tailed Student’s t-tests or one-way ANOVA followed by Dunnett’s tests for multiple comparisons: *P < 0.05; **P < 0.01; ***P < 0.001; ****P < 0.0001.
Figure 5
Figure 5
miRNA-191-5p Promoted The Tumorigenicity and PMT of Glioma Stem Cells. (A) Representative bright field microscopy images show neurosphere formation in GSCs treated with miRNA-191-5p mimics or miR-control mimics, and miRNA-191-5p inhibitor or miR-control inhibitor. Scale bar = 200 µm. Left: sphere formation statistics; right: sphere diameter quantification. (B) Immunofluorescence images illustrate Vimentin/Sox2 in red and Ki-67 in green in GSCs treated with miRNA-191-5p mimics or miR-control mimics, and miRNA-191-5p inhibitor or miR-control inhibitor. Nuclei were counterstained with DAPI (blue). Scale bar = 25 µm. (C) Bioluminescence imaging tracked tumor growth in xenograft nude mice injected with luciferase-labeled GSCs transfected with miR-191-5p agomir/antagomir or NC control on day 25; n = 3. (D) Bioluminescent images were measured every 5 days. (E) Histogram analysis quantified the luminescence indicating tumor size on day 25. (F) (G) Representative H&E staining images (scale bar = 1 mm, n = 3) and IHC staining for Ki67, miRNA-191-5p, Sox2, and Vimentin (upper panels, scale bar = 100 µm; lower panels, scale bar = 25 µm, n = 3) in GSC-bearing xenografts treated with miR-191-5p agomir/antagomir or NC control. Data represent mean ± SEM from three independent experiments; **P < 0.01;***P < 0.001; ****P < 0.0001 according to two-tailed Student t tests used for two-group comparisons.
Figure 6
Figure 6
PTEN as a Direct Target of miRNA-191-5p in Glioma. (A) Sequence alignment illustrating potential binding sites between PTEN mRNA and miR-191-5p. The red text indicates the binding site between miR-191-5p and the PTEN 3’ UTR. (B) Luciferase reporter activity of WT- or MUT-PTEN in U87 cells co-transfected with miRNA-191-5p mimics or miR-Control mimics. (C) Representative Western blot images showing the expression levels of PTEN in different treatment groups: miRNA-191-5p mimics or miR-control mimics, and miRNA-191-5p inhibitor or miR-control inhibitor. Densitometric analysis of band intensities was performed using ImageJ software. Protein levels were normalized to GAPDH and expressed as fold change relative to the control group. (D) Relative mRNA levels of PTEN in glioma cells transfected with miRNA-191-5p mimics or miR-control mimics, and miRNA-191-5p inhibitor or miR-control inhibitor. (E) Pearson correlation analysis between miR-191-5p and PTEN levels measured by qPCR in 40 primary glioma cases (r = 0.759, P < 0.0001). (F) Immunohistochemical (IHC) staining of PTEN in GSC-bearing xenografts treated with miR-191-5p agomir/antagomir or NC. Upper panels: scale bar = 100 µm; lower panels: scale bar = 25 µm, n = 3. Data were expressed as the mean ± SEM(repetition = 3); NS not statistically significant; *P < 0.05; **P < 0.01;***P < 0.001; ****P < 0.0001 according to two-tailed Student t tests used for two-group comparisons.
Figure 7
Figure 7
Restoration of PTEN Attenuates miRNA-191-5p Induced Tumorigenicity and PMT in Glioma Cells. (A) Representative bright field microscopy images display sphere formation in GSCs treated with miR-191 mimics and PTEN plasmids. Scale bar = 200 µm. Left: statistics of sphere formation; right: quantification of sphere diameter. (B) Immunofluorescence (IF) imaging shows Ki-67 and Vimentin/Sox2 expression in GSC tumorspheres co-transfected with miR-191-5p mimics and PTEN plasmids. (C) Cell proliferation in glioma cells was assessed by CCK-8 assays after co-transfection with PTEN plasmids and miRNA-191-5p mimics or miR-control mimics. (D) Migration of glioma cells measured by Wound healing assays following co-transfection with PTEN plasmids and miRNA-191-5p mimics or miR-control mimics. (E) Invasion of glioma cells was evaluated by Transwell assays after co-transfection with PTEN plasmids and miRNA-191-5p mimics or miR-control mimics. Data were expressed as the mean ± SEM(repetition = 3); NS not statistically. Significant; **P < 0.01; ***P < 0.001; ****P < 0.0001 according to two-tailed Student t tests or one-way ANOVA followed by Dunnett tests for multiple comparisons.
Figure 8
Figure 8
miRNA-191-5p Promotes PMT by Targeting PTEN Through the PI3K/Akt Signaling Pathway. (A) Western blot analysis of PTEN, Akt protein levels, phosphorylation, and PMT-related markers (Olig2, Sox2, Vimentin, and CD44) in glioma cells transfected with PTEN plasmids, miR-191-5p mimics, or miR-control mimics.Densitometric analysis of band intensities was performed using ImageJ software. Protein levels were normalized to GAPDH and expressed as fold change relative to the control group. (B and C) Relative expression levels of miRNA-191-5p, PTEN, Sox2, Vimentin, Akt, phosphorylated-Akt and p-Akt/Akt ratio in proneural and mesenchymal GBM as revealed by IHC and DAB-ISH staining. Representative images are shown (upper panels: scale bar = 100 µm; lower panels: scale bar = 25 µm). (D) Exosomes secreted from GaMSCs carrying miR-191-5p promotes glioma PMT by targeting PTEN and activating the PI3K/Akt signaling pathway, evidenced by elevation of Vimentin and CD44, and abaissement of Olig2 and Sox2. Data are presented as mean ± SEM; NS denotes not statistically significant; *P < 0.05; **P < 0.01; ***P < 0.001; ****P < 0.0001, as determined by two-tailed Student’s t-tests or one-way ANOVA followed by Dunnett’s tests for multiple comparisons.

Similar articles

References

    1. Bao Z, Zhang N, Niu W, et al. Exosomal miR-155-5p derived from glioma stem-like cells promotes mesenchymal transition via targeting ACOT12. Cell Death Dis. 2022;13(8):725. doi: 10.1038/s41419-022-05097-w - DOI - PMC - PubMed
    1. Zhou Y, Wu W, Bi H, Yang D, Zhang C. Glioblastoma precision therapy: from the bench to the clinic. Cancer Lett. 2020;475:79–91. doi: 10.1016/j.canlet.2020.01.027 - DOI - PubMed
    1. Phillips HS, Kharbanda S, Chen R, et al. Molecular subclasses of high-grade glioma predict prognosis, delineate a pattern of disease progression, and resemble stages in neurogenesis. Cancer Cell. 2006;9(3):157–173. doi: 10.1016/j.ccr.2006.02.019 - DOI - PubMed
    1. Lin Z, Zhang Z, Zheng H, et al. Molecular mechanism by which CDCP1 promotes proneural-mesenchymal transformation in primary glioblastoma. Cancer Cell Int. 2022;22(1):151. doi: 10.1186/s12935-021-02373-1 - DOI - PMC - PubMed
    1. Mancini A, Colapietro A, Cristiano L, et al. Anticancer effects of ABTL0812, a clinical stage drug inducer of autophagy-mediated cancer cell death, in glioblastoma models. Front Oncol. 2022;12:943064. doi: 10.3389/fonc.2022.943064 - DOI - PMC - PubMed

MeSH terms