Eutrophication influences diversity and community-level change points of mycoplankton in subtropical estuaries
- PMID: 40657498
- PMCID: PMC12245875
- DOI: 10.3389/fmicb.2025.1620942
Eutrophication influences diversity and community-level change points of mycoplankton in subtropical estuaries
Abstract
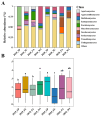
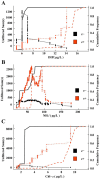
Mycoplankton are essential for biogeochemical cycles in natural water bodies. However, the distribution of the mycoplanktonic community and its community-level change points in subtropical estuaries remain unclear. In this study, we employed 18S rRNA high-throughput sequencing to explore the mycoplanktonic community structure and environmental thresholds in the Dafengjiang River Estuary. Agaricostilbomycetes and Saccharomycetes are the dominant classes in the Dafengjiang River Estuary. The alpha and beta diversities of the mycoplanktonic communities showed significant differences (p < 0.05) across the seasons. Distance-based redundancy analysis (db-RDA) suggested that the main driver of the total community was eutrophication level, and the key factors for oligotrophication, medium eutrophication, and high eutrophication were dissolved inorganic phosphorus (DIP), ammonium (NH4 +), and chlorophyll-a (Chl-a), respectively. Threshold Indicator Taxa Analysis (TITAN) exhibited the community-level change points of mycoplankton along the eutrophication gradients were DIP (6-15.5 μg/L), NH4 + (61.5-62.5 μg/L) and Chl-a (2.55-9.3 μg/L), respectively. Random forest analysis revealed that Rhizophydium, Aspergillus and Vanrija were sensitive to eutrophication status and could serve as bioindicator genera for environmental changes. Overall, our study enhances our understanding of the diversity and community-level change points of mycoplankton in subtropical estuaries and lays the theoretical foundation for the environmental monitoring of subtropical estuaries.
Keywords: 18S rRNA gene; TITAN; community-level change points; mycoplankton; subtropical estuary.
Copyright © 2025 Zhong, Chen, Deng, Guan, He, Nethmini, Tang, Hou, Li, Jiang, Huang, Dong and Li.
Conflict of interest statement
The authors declare that the research was conducted in the absence of any commercial or financial relationships that could be construed as a potential conflict of interest.
Figures


Similar articles
-
Spatial distribution of the summer chlorophyll a and nutrients in the Pearl River Estuary.Mar Pollut Bull. 2025 Nov;220:118479. doi: 10.1016/j.marpolbul.2025.118479. Epub 2025 Jul 22. Mar Pollut Bull. 2025. PMID: 40700850
-
Dissolved organic phosphorus utilization and composition under different water regimes of a river-dominated estuary.Mar Pollut Bull. 2025 Nov;220:118481. doi: 10.1016/j.marpolbul.2025.118481. Epub 2025 Jul 23. Mar Pollut Bull. 2025. PMID: 40706431
-
Bacterioplankton community structure and molecular ecological network characteristics in the overlying water of Sancha Lake.PLoS One. 2025 Jul 15;20(7):e0327903. doi: 10.1371/journal.pone.0327903. eCollection 2025. PLoS One. 2025. PMID: 40663539
-
Pulmonary rehabilitation for chronic obstructive pulmonary disease.Cochrane Database Syst Rev. 2015 Feb 23;2015(2):CD003793. doi: 10.1002/14651858.CD003793.pub3. Cochrane Database Syst Rev. 2015. PMID: 25705944 Free PMC article.
-
Perceptions and experiences of the prevention, detection, and management of postpartum haemorrhage: a qualitative evidence synthesis.Cochrane Database Syst Rev. 2023 Nov 27;11(11):CD013795. doi: 10.1002/14651858.CD013795.pub2. Cochrane Database Syst Rev. 2023. PMID: 38009552 Free PMC article.
References
-
- American Public Health Association (1926). Standard methods for the examination of water and wastewater. Washington, DC: American Public Health Association.
-
- Baker M. E., King R. S. (2010). A new method for detecting and interpreting biodiversity and ecological community thresholds. Methods Ecol. Evol. 1, 25–37. doi: 10.1111/j.2041-210X.2009.00007.x - DOI
-
- Baker M. E., King R. S. (2013). Of TITAN and straw men: an appeal for greater understanding of community data. Freshw. Sci. 32, 489–506. doi: 10.1899/12-142.1 - DOI
-
- Cao X., Wang J., Liao J., Sun J., Huang Y. (2016). The threshold responses of phytoplankton community to nutrient gradient in a shallow eutrophic Chinese lake. Ecol. Indic. 61, 258–267. doi: 10.1016/j.ecolind.2015.09.025 - DOI
LinkOut - more resources
Full Text Sources
Miscellaneous

