. 2025 Jan-Dec:21:17448069251361712.
doi: 10.1177/17448069251361712. Epub 2025 Jul 14.

Gabapentin's effect on human dorsal root ganglia: Donor-specific electrophysiological and transcriptomic profiles

Affiliations

Gabapentin's effect on human dorsal root ganglia: Donor-specific electrophysiological and transcriptomic profiles

Jenna B Demeter et al. Mol Pain. 2025 Jan-Dec.

Abstract

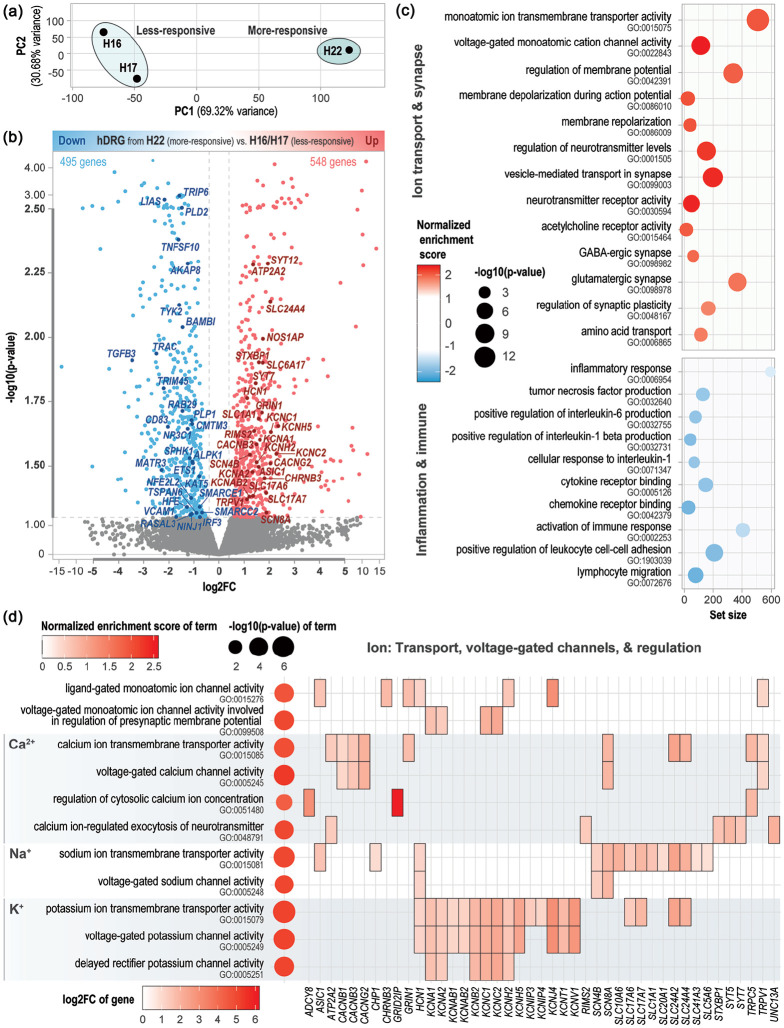
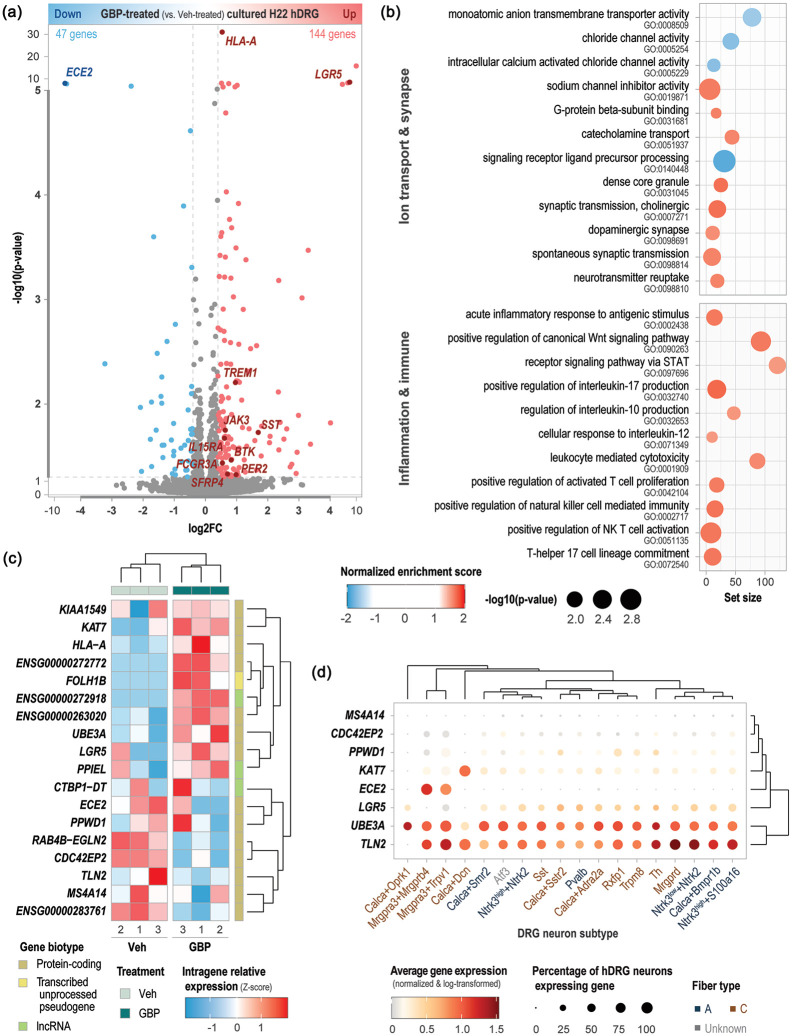
Neuropathic pain affects approximately 10% of the adult population and is commonly treated with gabapentin (GBP), a repurposed anticonvulsant drug. Despite its widespread use, GBP's effectiveness varies significantly among patients, highlighting the need to better understand its functional and molecular impacts on human nociceptors. Here we characterized the electrophysiological and transcriptomic effects of GBP on primary neurons derived from the dorsal root ganglia (DRGs) of ethically consented human donors. Using patch-clamp electrophysiology, we demonstrated that GBP treatment reduced neuronal excitability, with more pronounced effects in multi-firing vs. single-firing neurons. Notably, significant donor-specific variability was observed in electrophysiological responsiveness to GBP treatment in vitro. RNA sequencing of DRG tissue from the donor that was more responsive to GBP revealed differences in transcriptome-wide expression of genes associated with ion transport, synaptic transmission, inflammation, and immune response. Cross-transcriptomic analyses further showed that GBP treatment counteracted these alterations, rescuing aberrant gene expression at the pathway level and for several key genes. This study provides a comprehensive electrophysiological and transcriptomic profile of the effects of GBP on human DRG neurons. These findings enhance our understanding of GBP's mechanistic actions on peripheral sensory neurons and could help optimize its use for managing neuropathic pain.

Keywords: Gabapentin; hDRG; ion channel; sensory neurons; α2δ1.


Conflict of interest statement

Declaration of conflicting interestsThe author(s) declared no potential conflicts of interest with respect to the research, authorship, and/or publication of this article.

Figures

Based on the provided image, the alt text would be: “Figure illustrates hDRG neuron subtypes and expression of α2δ1 (encoded by CACNA2D1) in DRG neurons across species, with immunohistochemical staining showing robust α2δ1 expression in peripherin-positive neurons.”
Figure 1.
Target of GBP, α2δ1, is highly expressed in hDRG neurons. (a) Uniform manifold approximation and projection (UMAP) plot depicting clustering of cross-species DRG neurons labeled by marker gene expression, identifying diverse neuronal subtypes., Represented species include humans, cynomolgus macaque, rhesus macaque, mouse, rat, and guinea pig. (b) UMAP overlay showing the cross-species expression (normalized and log-transformed counts) of CACNA2D1 (encoding α2δ1) across neuronal subtypes., (c) Percentage of hDRG-N expressing CACNA2D1 across neuron subtypes.,,– (d) Immunohistochemical staining of hDRG tissue from donor H22 for α2δ1 (green), peripherin (red, peripheral neuron and nociceptor marker), and DAPI (blue, nuclear stain). Merged images confirm robust expression of α2δ1 in peripherin-positive neurons.
GBP treatments result in decreased neuronal activity, increased cell resting potential, fewer dendritic spikes, and reduced DSF frequency and amplitude, indicating lower neuronal excitability in hDRG neurons.
Figure 2.
GBP reduces neuronal excitability in hDRG neurons. (a) Percentage of multi- vs. single-firing hDRG-N treated with vehicle (n = 38) or GBP (n = 21). (b) Representative traces of a multi-firing vehicle- or GBP-treated cell. (c) Percentage of cells with rebound firing. (d) Percentage of cells with delayed firing: first-spike latency (FSL) > 100 ms. (e) Frequency-current (f–I) relationship in multi-firing cells. (f) Percentage of cells with ongoing activity (spontaneous activity (SA) when held at −45 mV). (g) Percentage of cells with SA at resting membrane potential (RMP). (h) Representative traces of a vehicle-treated control cell with SA (examples indicated by red arrows) and depolarizing spontaneous fluctuations (DSFs; purple arrows) and a GBP-treated cell with no SA or DSFs. (i) Percentage of cells with DSFs. (j) DSF frequency/30 s in cells with DSFs. (k) DSF amplitudes in cells with DSFs. *p < 0.05, **p < 0.01, ***p < 0.001, ****p < 0.0001 by Fisher’s exact test for (c), (d), (g), and (i) and by Kolmogorov-Smirnov test for (j).
The image presents a comparison of the excitability and electrical properties of human DRG neurons under the treatment with vehicle or GBP. For single-firing neurons, GBP reduces excitability but not single-firing, with changes in rheobase, normalized rheobase, action potential (AP) peak, AP rise time, and AP max rise slope. For multi-firing neurons, GBP does not affect excitability. Repeated measures ANOVA and Tukey's test were used for analysis.
Figure 3.
GBP reduces the excitability of multi-firing hDRG neurons but not single-firing hDRG neurons. Top half: single-firing hDRG-N treated with vehicle (n = 15) or GBP (n = 8). (a) Representative rheobase trace; black trace is vehicle-treated control while teal trace is GBP-treated. (b) Input resistance. (c) Resting membrane potential (RMP). (d) Rheobase. (e) Normalized rheobase. (f) Action potential (AP) peak. (g) AP rise time. (h) AP max rise slope. Bottom half: multi-firing hDRG-N treated with vehicle (n = 23) or GBP (n = 13). (i) Representative rheobase trace; black trace is vehicle-treated control while teal trace is GBP-treated. (j) Input resistance. (k) RMP. (l) Rheobase. (m) Normalized rheobase. (n) AP peak. (o) AP rise time. (p) AP max rise slope. *p < 0.05, **p < 0.01 by Mann–Whitney U test.
This image illustrates the donor-specific electrophysiological effects of GBP on various cellular parameters, including multi-firing percentage, rebound firing, resting membrane potential, spontaneous activity, ongoing activity at -45 mV, rheobase, normalized rheobase, and input resistance, across different donor groups and treatment conditions.
Figure 4.
Donor-specific electrophysiological effects of GBP. (a) Percentage of multi-firing cells in vehicle-treated H16/H17 (n = 26), GBP treated H16/H17 (n = 10), vehicle-treated H22 (n = 12), and GBP-treated H22 (n = 11) hDRG-N. (b) Percentage of cells with rebound firing. (c) Resting membrane potential (RMP). (d) Percentage of cells with spontaneous activity (SA) at rest. (e) Percentage of cells with ongoing activity (SA at −45 mV). (f) Rheobase. (g) Normalized rheobase. (h) Input resistance. *p < 0.05, **p < 0.01, ****p < 0.0001 by Fisher’s exact test for (a), (b), (d), and (e) and by two-way ANOVA test for (c), (f), (g), and (h).
The image depicts a comprehensive analysis involving principal component analysis (PCA), gene expression, and gene set enrichment analysis (GSEA) of gene expression data related to human donor-derived dendritic cells (hDRG). The dataset includes data from hDRG tissue of a donor highly responsive (H22) and contrasting less responsive donors (H16/H17) to a particular treatment, in this case, granulysin (GBP). In (a), PCA is applied to reduce dimensionality and visualize the variance in the data, with H22 falling out in the more responsive group and H16/H17 in the less responsive group, as represented by the coordinates on the PCA axes. In (b), a volcano plot displays the differential gene expression between the responsive and less responsive donors, with red indicating up-regulated and blue indicating down-regulated genes. Significant DEGs are marked by their labels, suggesting their role in the observed transcriptomic profile differences. In (c), GSEA is conducted to identify enriched Gene Ontology (GO) terms related to different biological processes, such as ion transport, inflammation, and immune response, highlighting terms significantly perturbed due to the treatment with H22 and the less responsive donors. The x-axis quantifies the number of expressed genes in each GO term, while dot color and size correspond to the normalized enrichment score and -log10(p-value) of each term, respectively. Lastly, (d) focuses on GSEA for genes involved in ion transport and regulation, displaying the statistics of core enrichment for calcium, sodium, and potassium. The left side of the figure shows the statistics, with the color blue indicating the Log2 fold change (log2FC) of the DEGs, while the right side presents a heatmap of the DEGs with their respective log2FC values, providing insight into the expression changes of ion-related genes.
Figure 5.
Donor-specific transcriptomic profile of hDRG tissue associated with in vitro GBP responsiveness. (a) Principal component analysis (PCA) of gene expression in hDRG tissue from the donor that had a strong electrophysiological response to in vitro GBP treatment (H22, the “more-responsive donor”) and the donors that did not respond very strongly (H16/H17, the “less-responsive donors”). (b) Volcano plot representing the differential gene expression analysis of hDRG tissue from H22 vs. H16/H17. Significant differentially expressed genes (DEGs) (|log2FC| ≥ 0.4, p ≤ 0.05) in H22 vs. H16/H17 are colored red (upregulated) or blue (downregulated). DEGs that are core genes contributing to the enrichment of the gene set enrichment analysis (GSEA) terms shown in (c) are labeled. Labeled upregulated genes contribute to at least three of the positively enriched GSEA terms in (c) while downregulated genes contribute to at least one negatively enriched term in (c). The thicker central portions of the axes are expanded relative to the peripheral thinner portions. (c) GSEA of Gene Ontology (GO) terms comparing gene expression in hDRG tissue from H22 vs. H16/H17. Significant GO terms (p ≤ 0.05) related to ion transport, synaptic transmission, inflammation, and immune response are shown. The x-axis represents the set size (number of expressed genes in the term). The dot color represents the normalized enrichment score while the dot size represents -log10(p-value). (d) GSEA of GO terms related to ions (their transport, voltage-gated channels, and regulation), specifically focusing on calcium, sodium, and potassium. The dot plot on the left represents the statistics associated with the terms; the dot color represents the normalized enrichment score while the dot size represents -log10(p-value). The heatmap on the right represents the DEGs that constitute part of the core enrichment of the terms, with tile color indicative of log2FC of the DEGs.
This image represents a comprehensive study on the differential gene expression analysis of hDRG tissue from GBP-treated vs. vehicle-treated hDRG, showcasing significant gene regulation. The color-coded volcano plot in (a) highlights the degree of gene expression changes, with red indicating upregulation and blue indicating downregulation. (b) demonstrates a Gene Ontology analysis, relating to various cellular processes like ion transport, synaptic transmission, and immune response. The heatmap in (c) displays the expression levels of significant genes, aiding in understanding the transcriptional impact of GBP treatment. (d) shows the expression of these genes in different neuron subtypes, offering insights into the functional consequences of gene regulation.
Figure 6.
Transcriptomic response of cultured hDRG to GBP treatment. (a) Volcano plot representing the differential gene expression analysis of hDRG from the more-responsive donor cultured and treated with GBP vs. vehicle. Significant differentially expressed genes (DEGs) (|log2FC| ≥ 0.4, p ≤ 0.05) in GBP-treated vs. vehicle-treated control hDRG are colored red (upregulated) or blue (downregulated). DEGs that are core genes contributing to the enrichment of at least one gene set enrichment analysis (GSEA) term shown in (b) are labeled. The thicker central portions of the axes are expanded relative to the peripheral thinner portions. (b) GSEA of Gene Ontology (GO) terms comparing GBP-treated vs. control hDRG culture. Significant GO terms (p ≤ 0.05) related to ion transport, synaptic transmission, inflammation, and immune response are shown. The x-axis represents the set size (number of expressed genes in the term). The dot color represents the normalized enrichment score while the dot size represents -log10(p-value). (c) Heatmap depicting the relative expression of strong DEGs (|log2FC| ≥ 0.4, FDR ≤ 0.1) among the three control and three GBP-treated hDRG samples. The color represents relative expression within each gene (Z-score). Gene biotype and treatment are annotated by color, and hierarchical clustering of samples and genes is shown in their respective dendrograms. (d) Expression of strong DEGs (|log2FC| ≥ 0.4, FDR ≤ 0.1) in hDRG neuron subtypes as quantified and characterized by previous studies.,– The dot color represents average gene expression (normalized and log-transformed counts) while the dot size represents the percentage of cells expressing the gene. The text color of hDRG neuron subtype labels indicates their fiber type.
This image presents a cross-transcriptomic analysis comparing GBP-responsive and GBP-treatment signatures in hDRG tissue and culture, alongside the exploration of common DEGs and their expression in different neuron subtypes. The analysis reveals GO term enrichment related to ion transport, synaptic transmission, and immune responses, with a focus on gene expression in hDRG tissues. It delves into the expression patterns of common DEGs across neuron subtypes, highlighting variations in gene expression across different fiber types of hDRG neurons. This comprehensive analysis helps in understanding the molecular underpinnings of hDRG function and differentiation, potentially informing therapeutic strategies for spinal cord injuries and related conditions.
Figure 7.
Cross-transcriptomic analysis comparing GBP-responsive and GBP-treatment signatures in hDRG. (a) Gene Ontology (GO) terms enriched by gene set enrichment analysis (GSEA) in opposite directions in the dataset of hDRG tissue from the more-responsive donor vs. less-responsive donors and the dataset of cultured hDRG from the more-responsive donor treated with GBP vs. vehicle. Significant GO terms (p ≤ 0.05) related to ion transport, synaptic transmission, inflammation, and immune response are shown. The x-axis represents −log10(p-value) bidirectionally, and the bar color represents the normalized enrichment score. (b) Common DEGs (|log2FC| ≥ 0.4, p ≤ 0.05) among the two datasets (hDRG tissue and hDRG treated in vitro). The dot color represents log2FC while the dot size represents -log10(p-value). (c) Expression of these common DEGs (|log2FC| ≥ 0.4, p ≤ 0.05) in hDRG neuron subtypes as quantified and characterized by previous studies.,– The dot color represents average gene expression (normalized and log-transformed counts) while the dot size represents the percentage of cells expressing the gene. The text color of hDRG neuron subtype labels indicates their fiber type.

References

    1. St John Smith E. Advances in understanding nociception and neuropathic pain. J Neurol 2018; 265: 231–238. - PMC - PubMed
    1. Magrinelli F, Zanette G, Tamburin S. Neuropathic pain: diagnosis and treatment. Pract Neurol 2013; 13: 292–307. - PubMed
    1. Alles SRA, Smith PA. Etiology and pharmacology of neuropathic pain. Pharmacol Rev 2018; 70: 315–347. - PubMed
    1. Alles SRA, Smith PA. Peripheral voltage-gated cation channels in neuropathic pain and their potential as therapeutic targets. Front Pain Res 2021; 2: 750583. - PMC - PubMed
    1. Jay GW, Barkin RL. Neuropathic pain: etiology, pathophysiology, mechanisms, and evaluations. Dis Mon 2014; 60: 6–47. - PubMed

LinkOut - more resources