. 2025 Jul;533(7):e70064.
doi: 10.1002/cne.70064.

Connectivity of a Conspicuous Layered Structure in the Dorsal Telencephalon of the Peacock Gudgeon, Tateurndina ocellicauda

Affiliations

Connectivity of a Conspicuous Layered Structure in the Dorsal Telencephalon of the Peacock Gudgeon, Tateurndina ocellicauda

Ruth Gutjahr et al. J Comp Neurol. 2025 Jul.

Abstract

Within the mammalian pallium, layered structures, such as the six-layered isocortex and the three-layered hippocampal formation, are crucial for integrating sensory cues from the environment and for forming and recalling memories. Similar layered pallial systems have also been shown in avian and non-avian reptiles. Despite sharing similar needs for processing external information and remembering important sites, teleosts have generally not evolved such defined layered organizations in their dorsal telencephalon. One exception is gobiiform fishes in which a subregion of the dorsal telencephalon is organized into several fiber-rich and soma-dense layered subregions. We investigated the connectivity of these layered subregions (referred to as the dorsal telencephalic area X, Dx), as well as the connectivity of the medial (Dm) and dorsolateral (dDl) parts of the dorsal telencephalon through tracer injections. We found that extratelencephalic projections reach Dm, Dx, and dDl from different regions within the preglomerular complex (PG): Dm receives input from different PG regions: PG region 1 (PG1), PG region 2 (PG2), and the commissural PG (PGc), but not from the nucleus prethalamicus (PTh). In contrast, both Dx and dDl receive projections from the lateral PTh (PTh-l) and the medial PTh (PTh-m). We find that projections to dDl come from more ventral regions of PTh-m than those that project to Dx. The majority of ascending connections could be found within the telencephalon itself, with each of the telencephalic zones receiving its own distinct pattern of intratelencephalic afferent connectivity. From our results, we conclude that Dm and Dx constitute two distinct zones of the dorsal telencephalon.

Keywords: RRID:SCR_002285; RRID:SCR_013674; RRID:SCR_017641; ascending projections; neuronal layers; pallium; teleost; tract tracing.


Conflict of interest statement

The authors declare no conflicts of interest.

Figures
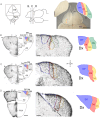
FIGURE 1
FIGURE 1
Anatomy of Dx in Tateurndina ocellicauda. (A) Left: schematic dorsal overview of the peacock gudgeon brain. The box indicates the location of the panel on the right. Middle: schematic lateral overview, dotted lines indicate rostro‐caudal level of the slices depicted in (B–D). Right: transmission image of the goby telencephalon and the rostral TeO. Colored regions show fiber‐rich layers of Dx: blue = Dl7, red = Dl6, yellow = Dl5, green = Dl4. Left inset shows a higher magnification of Dx. Right inset depicts Dl4‐7 surrounded by soma‐dense layers (dotted lines). (B–D) Left panels: Transverse sections through the telencephalon at rostral (B), middle (C), and caudal (D) levels of Dx stained with cresyl violet. Full arrowhead marks dDl, empty arrowhead marks Ddi, open arrowhead marks Dm, and the asterisk marks Dc. Middle panels show higher magnification images of Dx shown in overview on the left. Semitransparent outlines indicate the presence of three fiber‐rich layers (Dl5‐7). Right panels feature schematic representations of Dl4‐7 as indicated in middle panels. Shaded areas show fiber‐rich Dl4‐7, and spotted outlines represent soma‐dense layers surrounding these. Scale bars: A = 250, inset = 50 µm; B (left)–D (left) = 200 µm, B (middle)–D (middle) = 50 µm. Colors: blue = Dl7 and Dl7‐associated soma‐rich layers, red = Dl6 and Dl6‐associated soma‐rich layers, yellow = Dl5 and Dl5‐associated soma‐rich layers, green = Dl4 and Dl4‐associated soma‐rich layers. For abbreviations, see list.
FIGURE 2
FIGURE 2
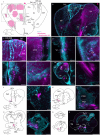
Labeled somata and fibers after iontophoretic tracer injections into Dm. (A) Overview sketch of a transverse slice of the telencephalon. Note that the sketched slice covers about 250 µm on the rostro‐caudal axis. Gray boxes within the sketch indicate the location of the figure panels with the corresponding labels (B–F,J). The magenta arrowhead indicates the injection site. (B) Overview image of labeled structures within the dorsal telencephalon following Dm injections. The magenta arrowhead indicates the injection site. The asterisk refers to putative terminals within Dl and empty arrowhead points towards labeled somata within Dc. (C) Sparse somata labeled within Dx. Arrowheads point to somata within Dl7, and the asterisk marks a putative terminal field within Ddi. (D) Labeled somata within dVd. (E) Labeled somata within Vl. (F) Labeled somata within vDl. (G) Labeled somata within Vv. (H) Labeled somata within vVd. (I) Overview image of labeled structures within the caudal telencephalon: Labeled putative terminal fields within Dc (asterisk). (J) Labeled fiber tracts next to Vl. (K) Overview sketch of a transverse section through the rostral diencephalon. (L) Lateral forebrain bundle was found labeled. (M) Overview sketch of a transverse section through the more caudal diencephalon. (N) Labeling of many neurons within PG1 and some neurons within PG2. (O) Overview sketch of a transverse section at mesencephalic levels. (P) Labeled somata within PGc. (Q) Overview sketch of a semi‐sagittal (slicing plane indicated in whole‐brain sketch at top) section through the brain. (R) Semi‐sagittal section of Dm tracing experiment labeled neurons within PG1, PG2 (arrowhead) and PGc (asterisk), respectively. A fiber tract was labeled between the two nuclei (open arrowhead). Colors: cyan = DAPI, magenta = neurobiotin + streptavidin 647. Scale bars: B, I = 100 µm; C, G, N, P = 50 µm, D, E, F, J, L = 25 µm, H = 10 µm, R = 500 µm. For abbreviations, see list.
FIGURE 3
FIGURE 3
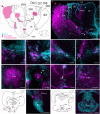
Labeled somata and fibers after iontophoretic tracer injections into Dx. (A) Overview sketch of a transverse slice of the telencephalon. Note that the sketched slice covers about 250 µm on the rostro‐caudal axis. Gray boxes within the sketch indicate the location of the figure panels with the corresponding labels (C–K). The magenta arrowhead indicates the injection site. (B) Some labeled structures after a neurobiotin injection into Dx: In this section, labeled somata were found within Dx, Vc1 and a distinct subarea within Dc, labeled fibers were found within dDl, and both were found within Dx. The asterisk indicates a fiber tract connecting the Dx to Dc, the arrowhead indicated a second tract connecting Dx and Dc, the empty arrowhead indicates neurons located in the ventromedial Dc, and the plus‐sign indicates putative terminal fields within dDl. (B1) Magnified view of the fiber tract marked by an asterisk in B that connects Dx and Dc in (B). The asterisks’ locations in (B) and (B1) are identical. The filled arrowhead indicates the location of putative terminals in Dc. (C) Detail image of a Dx transverse section adjacent to the injection site. The arrowhead indicates labeled fibers crossing large parts of Dl7 in medio‐lateral direction. The asterisk indicates the tract connecting Dx to Dc. (D) Magnified view of Dl5 showing fibers oriented medio‐laterally (arrowheads). (E) Magnified view of Dl7 showing fibers oriented dorso‐ventrally (arrowheads). (F) Labeled somata found in Vl (arrowheads) and labeled tract connected to Vl (asterisk). (G) Image of labeled fibers within the lfb (arrowhead). (H) Detail image of labeled somata within vVd. (I) Detail image of labeled somata found in Vc1. (J) Overview drawing of a slice at the level of PTh. The gray box within the sketch indicates the location of (K). (K) Detail image of labeled neurons found within PTh‐m and few neurons within PTh‐l. (L) Overview drawing of a section containing PGc at mesencephalic levels. The gray box indicates the position of (M). (M) Absence of labeling within PGc. (N) Heatmap of all regions with labeled somata found after neurobiotin tracer injections into Dx with darker shadings indicating results that occurred more often. Colors: cyan = DAPI, magenta = neurobiotin + streptavidin 647. Scale bars: B = 100 µm, C, B1, F, K, M = 50 µm, D, E, H, I = 25 µm, G = 10 µm. For abbreviations, see list.
FIGURE 4
FIGURE 4
Labeled somata and fibers following iontophoretic neurobiotin tracer injections into dDl. (A) Overview drawing of a transverse slice through the telencephalon. Note that the sketched slice covers about 250 µm on the rostro‐caudal axis. Gray boxes within the sketch indicate the location of the figure panels with the corresponding labels (B–J). Magenta arrowhead indicates the injection site. (B) Labeled structures after a neurobiotin injection into dDl (magenta arrowhead indicates injection site). Labeled somata and fibers were found in dDl, Dl4, Dl5, and Dc. Exclusively somata were labeled in Vc1 and Vvd and putative terminal fields were found in Dd(s?) and Dc. The asterisk marks a fiber tract running ventrally from dDl and the blue arrowhead indicates the lateral boundary of the putative projection field in Dd(s?). (C) Detail image of some of the labeled somata within vVd. (D) Detail image of labeled somata within Vc1. (E) Labeled somata within Dc and Vc1. Note that Dc and Vc1 are immediately adjacent at this rostro‐caudal level. (F) Labeled somata found within vVd and Vl, asterisk: labeled fiber tract connected to Vl. (G) Labeled putative terminal field found in the rostral ipsilateral Dc. (H) Labeled fibers found within the lateral forebrain bundle (lfb, arrowhead). (I) Labeled fibers within the anterior commissure (Ca), crossing the midline (ml). (J) Labeled somata located within the contralateral Dc. (K) Overview drawing of a diencephalic brain slice at the level of PTh. The gray box within the sketched image indicates the location of the detail image in (L). (L) Detail image of labeled neurons found mostly in the ventral subregion of PTh‐m. (M) Overview drawing of a midbrain section at the level of PGc. Gray box indicates location of the detail image in (N). (N) No labeled somata could be found in the PGc. Colors: cyan = DAPI, magenta = neurobiotin + streptavidin 647. Scale bars: 100 µm in B, 50 µm in E, F, I, J, L, N and 25 µm in C, D, G, H. For abbreviations, see list.
FIGURE 5
FIGURE 5
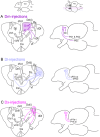
Summary of afferent connections of PG nuclei with Dm (A), dDl (B), and Dx (C). (A) No labeled somata were seen in either PTh‐l and PTh‐m after Dm injections. PG1 was filled with labeled somata, and PG2 showed labeled somata in its lateral subregion. (B) After dDl injections, labeled somata were found in the ventral subregion of PTh‐m and in a small dorsal region of PG2. (C) After Dx injections, labeled somata were seen in the ventral PTh‐l and the dorsal and medial PTh‐m. (D) Merged image of PG projections to Dm, dDl, and Dx. Dm‐afferent neurons can be clearly differentiated from Dx and dDl afferent neurons. There is a slight overlap of Dx‐ and dDl‐afferent neurons, with dDl‐afferent neurons occupying a more ventral position within Pth‐m. Among our experiments, only Dx‐afferent neurons can be found in Pth‐m, and only dDl afferent neurons could be found in the dorsomedial PG2. For abbreviations, see list.
FIGURE 6
FIGURE 6
Iontophoretic bulk injections into the ventral diencephalon at the level of PG. (A) Overview sketch of a transversal slice at the level of the medial Dx, where ascending fibers from PG could be observed in Dl6 and Dl7 (labeled in magenta). (B) Overview sketch of a transversal section through the diencephalon at the level of PG, where the bulk injections were performed (magenta arrowhead = injection site). (C) Image of ascending putative projection fields in Dl6 and Dl7 after a bulk injection into the ventral diencephalon. Few somata in the most medial cell‐sense layer of Dl7 are indicated by the arrowheads. (D) Image of PG at the injection site, with labeled somata in PTh‐m and PG1. Injection site is indicated with an asterisk. (E) Image of Dx at more caudal levels, where we could observe labeled somata in in the most medial cell‐sense layer of Dl7 and dense labeled fibers within Ddi. (F) Labeled putative terminal fields within PG2 after injections into the ventral diencephalon (exact injection site not shown). Colors: magenta = neurobiotin + streptavidin, cyan = DAPI. Scale bars: C, F = 50 µm; D = 100 µm; E = 25 µm. For abbreviations, see list.
FIGURE 7
FIGURE 7
Schematic summary of ascending connections to Dx, dDl, and Dm. (A) Summary of ascending connections from within the telencephalon (left) and Dp and extratelencephalic input (right) to Dm. (B) Summary of intratelencephalic (left) and extratelencephalic (right) ascending connections to dDl. (C) Summary of ascending projections from the telencephalon (left) and from other brain areas (right) to Dx. For abbreviations, see list.

Similar articles

References

    1. Alstermark, B. , and Isa T.. 2012. “Circuits for Skilled Reaching and Grasping.” Annual Review of Neuroscience 35, no. 1: 559–578. 10.1146/annurev-neuro-062111-150527. - DOI - PubMed
    1. Broadbent, N. J. , Squire L. R., and Clark R. E.. 2004. “Spatial Memory, Recognition Memory, and the Hippocampus.” Proceedings of the National Academy of Sciences 101, no. 40: 14515–14520. 10.1073/pnas.0406344101. - DOI - PMC - PubMed
    1. Broglio, C. , Rodríguez F., and Salas C.. 2003. “Spatial Cognition and Its Neural Basis in Teleost Fishes.” Fish and Fisheries 4, no. 3: 247–255. 10.1046/j.1467-2979.2003.00128.x. - DOI
    1. Campbell, C. B. G. , and Ebbesson S. O. E.. 1969. “The Optic System of a Teleost: Holocentrus Re‐Examined.” Brain Behavior and Evolution 2, no. 5–6: 415–430. 10.1159/000125898. - DOI
    1. Corrêa, S. A. L. , Grant K., and Hoffmann A.. 1998. “Afferent and Efferent Connections of the Dorsocentral Telencephalon in an Electrosensory Teleost, Gymnotus carapo .” Brain Behavior and Evolution 52, no. 2: 81–98. 10.1159/000006554. - DOI - PubMed

LinkOut - more resources