. 2025 Aug 13;16(8):e0030225.
doi: 10.1128/mbio.00302-25. Epub 2025 Jul 14.

Histone variant H2A.Z cooperates with EBNA1 to maintain Epstein-Barr virus latent epigenome

Affiliations

Histone variant H2A.Z cooperates with EBNA1 to maintain Epstein-Barr virus latent epigenome

Leonardo Josué Castro-Muñoz et al. mBio. .

Abstract

Chromatin structure plays a central role in the regulation of Epstein-Barr virus (EBV) latency. The histone variant H2A.Z.1 has been implicated in chromatin structures associated with the initiation of transcription and DNA replication. Here, we investigate the functional role of H2AZ.1 in the regulation of EBV chromatin, gene expression, and copy number during latent infection. We found that H2A.Z.1 is highly enriched near EBNA1-binding sites at the origin of plasmid replication (oriP) and the transcriptional start site for the EBNA1 gene (Qp), and to a lesser extent with transcriptionally active CTCF binding sites on the EBV genomes in both Mutu I Burkitt lymphoma (BL) and SNU719 EBV-associated gastric carcinoma (EBVaGC) cell lines. RNA-interference depletion of H2A.Z.1 resulted in the reactivation of viral lytic genes (ZTA and EAD) and increased viral DNA copy numbers in both MutuI and SNU719 cells. H2A.Z depletion also led to a decrease in EBNA1 binding to oriP and Qp, on the viral episome as well as on oriP plasmids independently of other viral genes and genomes. H2A.Z.1 depletion also reduced peaks of H3K27ac and H4K20me3 at regulatory elements in the EBV genome. In the cellular genome, H2A.Z.1 colocalized with only a subset of EBNA1 binding sites, and H2A.Z.1 depletion reduced EBNA1 binding to these sites and altered the transcription of genes associated with myc targets and mTORC1 signaling. Taken together, these findings indicate that H2A.Z.1 cooperates with EBNA1 to regulate chromatin structures important for epigenetic programming of the latent episome.IMPORTANCECellular factors that maintain viral latency are of fundamental importance. We have found that the cellular histone variant H2A.Z functions in cooperation with the Epstein-Barr virus (EBV) latency maintenance protein EBNA1 to establish a stable epigenome and prevent lytic cycle reactivation during latency. We show that H2A.Z localizes near EBNA1-binding sites on the viral and host genomes, facilitates EBNA1 binding at these sites, and is required for epigenetic programming of viral episomes. H2A.Z depletion perturbed cMyc and mTORC1 pathways that have been implicated in the control of EBV latency. These findings suggest that H2A.Z is an essential constituent of EBV chromatin required for EBNA1 binding and stable maintenance of EBV latency.

Keywords: Epstein-Barr virus; epigenetic; herpesviruses; histones; latency.


Conflict of interest statement

Paul Lieberman is a founder and advisor of Vironika, LLC, and holds patents on a small molecule inhibitor of EBNA1. All other authors have no conflicts to disclose.

Figures

Fig 1
Fig 1
H2A.Z is enriched near EBNA1- and CTCF-binding sites in the EBV genome. (A) EBV genome visualized using IGV showing ChIP-seq tracks for H2A.Z (pink), EBNA1 (blue), and input controls (gray) for SNU719 (top) or Mutu I (lower). CTCF ChIP-seq for Mutu I is shown in green. EBV genome annotation is provided below. (B) Magnified ChIP-seq tracks of panel A at EBV oriP region. (C) Magnified ChIP-seq tracks of panel A at Qp. (D) ChIP-qPCR of H2A.Z or IgG control at FR, DS, Qp, and oriLyt regions of EBV in SNU719, (E) Mutu I (F), LCL352, and (G) C666-1 cells. ****P < 0.0001, n = 3 independent experimental (ChIP) replicates, Student t-test.
Fig 2
Fig 2
H2A.Z knockdown activates EBV lytic gene expression. (A) Mutu I cells transduced with lentivirus expressing shControl, shH2A.Z-A, or shH2A.Z-B were selected for puromycin resistance for 7 days and then assayed by western blot for EBNA1, ZTA, H2A.Z, or β-actin. (B) H2A.Z knockdown in Mutu I cells was assayed by RT-qPCR for ZTA and EA-D mRNA expression. (C) EBV DNA copy number measured by qPCR comparing EBV oriLyt DNA relative to cellular GAPDH DNA for samples as described in panel A. (D) SNU-719 cells were transfected with siControl or siH2A.Z and assayed by western blot for EBNA1, EA-D, H2A.Z, and β-actin. (E). SNU719 cells treated as described for panel D were assayed by RT-qPCR for ZTA and EA-D mRNA expression. (F) EBV DNA copy number measured by qPCR comparing EBV oriLyt DNA relative to cellular GAPDH DNA for samples as described in panel D. **P < 0.01, ***P < 0.001, ****P < 0.0001, Student t-test, n = 3 biological replicates.
Fig 3
Fig 3
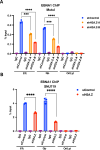
H2A.Z knockdown reduces EBNA1 binding to EBV genome. (A) ChIP-qPCR for EBNA1 or IgG control at FR, Qp, and oriLyt regions of EBV in Mutu I cells transduced with shControl, shH2A.Z-A, or shH2A.Z-B. (B) ChIP-qPCR for EBNA1 or IgG control at FR, Qp, and oriLyt regions of EBV in SNU719 cells treated with siControl or siH2A.Z. ***P < 0.001, ****P < 0.0001, Student t-test, n = 3 biological replicates.
Fig 4
Fig 4
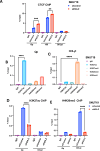
H2A.Z depletion reduces EBNA1 binding to OriP in EBV- 293T cells. (A) Diagram of the time course for two-round siRNA transfection in 293T cells with siControl or siH2A.Z and cotransfection of oriP plasmid expressing EBNA1. (B) Western blot for the expression of EBNA1, H2A.Z, or β-actin in 293T cells treated as described in panel A. (C) Quantification of western blot shown in panel B. (D) ChIP-qPCR for H2A.Z or control IgG at the DS, FR, or AMP (ampicillin resistance gene) regions of the oriP plasmid in 293T cells treated with siH2A.Z or siControl as shown in panel A. (E) ChIP-qPCR for EBNA1 or control IgG at the DS, FR, or AMP region of the oriP plasmid in siH2A.Z or siControl transfected 293T cells. (F) OriP plasmid copy number determined by qPCR using primers for oriP elements DS (left) or FR (right) comparing siControl or siH2A.Z in 293T cells. ***P < 0.001, ****P < 0.0001, Student t-test, n = 3 biological replicates.
Fig 5
Fig 5
EBNA1 increases H2A.Z enrichment at oriP-containing plasmids in 293T cells. 293T cells were transfected with OriP replicon (pHEBO), a plasmid expressing FLAG-EBNA1 (pCMVFLAG-EBNA1), and plasmid Control (pCMV-FLAG). (A) Western blot shows FLAG-EBNA1 and β-actin protein levels in three biological replicates. (B) ChIP-qPCR for FLAG-EBNA1 or control IgG at the DS, FR, or AMP (amplicillin resistance gene) regions in transfected 293T cells. (C) ChIP-qPCR for H2A.Z or control IgG at the DS, FR, or AMP region in transfected 293T cells with FLAG-EBNA1. ***P < 0.001, ****P < 0.0001, Student t-test, n = 3 biological replicates.
Fig 6
Fig 6
H2A.Z depletion alters CTCF and histone modifications on the EBV genome. (A) ChIP-qPCR for CTCF or control IgG at DS, CTCF166, or oriLyt regions of the EBV genome in SNU-719 cells treated with siControl or siH2A.Z. (B and C) ChIP-qPCR for H3K27ac, H3K27me3, H4K20me3, H3K4me3, or IgG control at the Qp region (B) or the oriLyt region (C) in untreated SNU719 cells. (D and E) ChIP-qPCR for H3K27ac (D) or H4K27me3 (E) or control IgG at Qp or oriLyt regions of EBV in SNU719 cells treated with siControl or si-H2A.Z. ***P < 0.001, ****P < 0.0001, Student t-test, n = 3 biological replicates.
Fig 7
Fig 7
Host genome binding patterns of EBNA1 and H2A.Z. (A) Heat map showing the different patterns of ChIP-seq peak distribution for EBNA1 (left) or H2A.Z (right) in SNU719 (left group) or Mutu I (right group). (B) Pie charts and Venn diagrams showing the distribution of EBNA1 and H2A.Z ChIP-seq peaks across the cellular genome. The pie chart shows the distribution between promoter (green or orange) and intergenic (blue) regions. Venn diagrams show the overlap of peaks between EBNA1 and H2A.Z in SNU719 or Mutu I cells. (C) Heatmap showing the overlap correlations of ChIP-seq peaks for H2A.Z and EBNA1 in SNU719 and Mutu I cells. (D) ChIP-seq tracks for EBNA1, H2A.Z, and CTCF are shown at the ADA (top) or IL6R (middle) or SELENOK/SELK (bottom) gene loci. Combined tracks for H2A.Z show Mutu I (blue) and SNU719 (red). Gene transcripts and GeneHancer interactions are shown below each set of tracks. (E and F) ChIP-qPCR of EBNA1 and H2A.Z for DNA binding at the cellular sites at IL6R, CDC7, SELK, FAM55B, GNK1/2, and also at SESN1 as an EBNA1 negative site in cellular genome for SNU-719 cells treated with siControl or siH2A.Z. ***P < 0.001, ****P < 0.0001, Student t-test, n = 3 experimental replicates.
Fig 8
Fig 8
RNA-seq analysis of H2A.Z knockdown in SNU719 cells. (A) Heatmap showing hierarchical clustering of gene expression change in SNU719 cells treated with siControl or siH2A.Z. Differential gene expression analysis was performed using DESeq2, and all genes with statistically significant changes (P < 0.05) are shown. (B) Reactome Pathway analysis of genes differentially regulated as defined in panel A (DESeq2 P < 0.05) in SNU719 cells treated with siH2A.Z or siControl. (C) Gene enrichment analysis for MYC Targets (left panel) PI3K_AKT_MTOR_Signaling (right panel) RNA-seq data set described in panel A. (D and E). Western blot (left) of Myc, H2A.Z, and β-actin in siControl or siH2A.Z transfected SNU719 cells and quantification (right) of Myc protein levels relative to β-actin.
Fig 9
Fig 9
Model of H2A.Z regulation of EBV latency through cooperative binding with EBNA1 and control of c-myc and mTOR pathways. Figure images were generated using the bioRender platform (biorender.com).

Update of

Similar articles

References

    1. Thorley-Lawson DA. 2015. EBV persistence--introducing the virus. Curr Top Microbiol Immunol 390:151–209. doi: 10.1007/978-3-319-22822-8_8 - DOI - PMC - PubMed
    1. Shannon-Lowe C, Rickinson A. 2019. The global landscape of EBV-associated tumors. Front Oncol 9:713. doi: 10.3389/fonc.2019.00713 - DOI - PMC - PubMed
    1. Taylor GS, Long HM, Brooks JM, Rickinson AB, Hislop AD. 2015. The immunology of Epstein-Barr virus-induced disease. Annu Rev Immunol 33:787–821. doi: 10.1146/annurev-immunol-032414-112326 - DOI - PubMed
    1. Farrell PJ. 2019. Epstein-Barr virus and cancer. Annu Rev Pathol 14:29–53. doi: 10.1146/annurev-pathmechdis-012418-013023 - DOI - PubMed
    1. Damania B, Kenney SC, Raab-Traub N. 2022. Epstein-Barr virus: biology and clinical disease. Cell 185:3652–3670. doi: 10.1016/j.cell.2022.08.026 - DOI - PMC - PubMed

LinkOut - more resources