. 2025 Jul 14;82(1):275.
doi: 10.1007/s00018-025-05788-5.

Integrative proteomics and metabolomics analyses reveals the regulation of autophagy and ferroptosis by RAB10 through Slc37a2/mTOR pathway in breast cancer

Affiliations

Integrative proteomics and metabolomics analyses reveals the regulation of autophagy and ferroptosis by RAB10 through Slc37a2/mTOR pathway in breast cancer

Yuxin Ji et al. Cell Mol Life Sci. .

Abstract

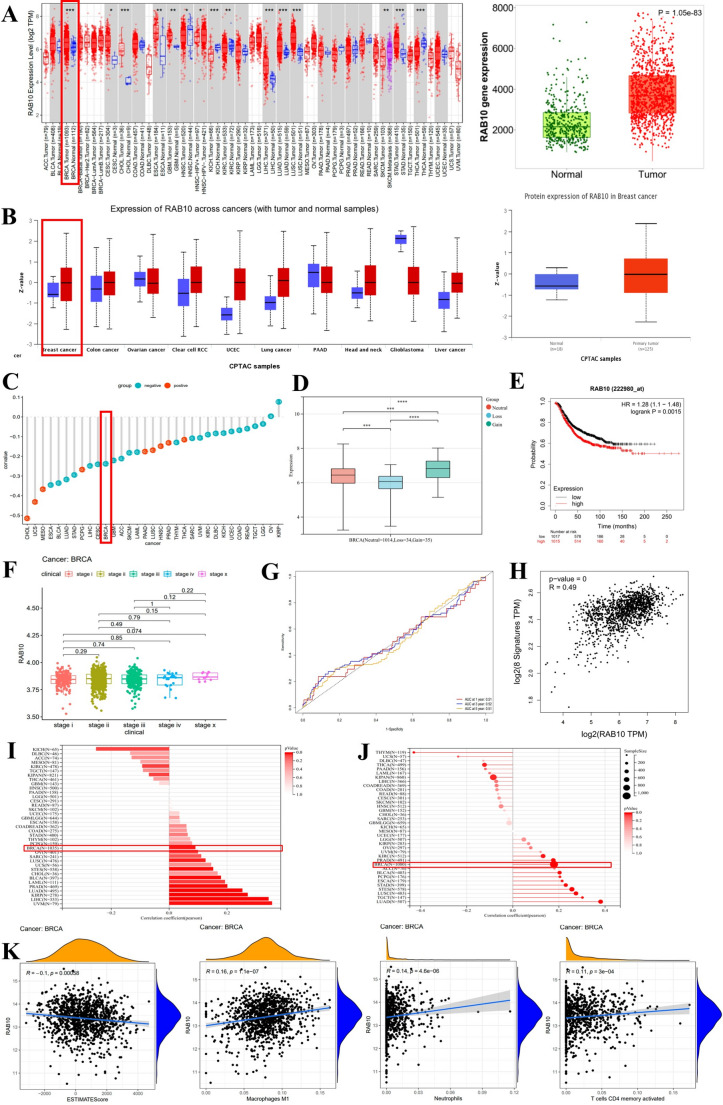
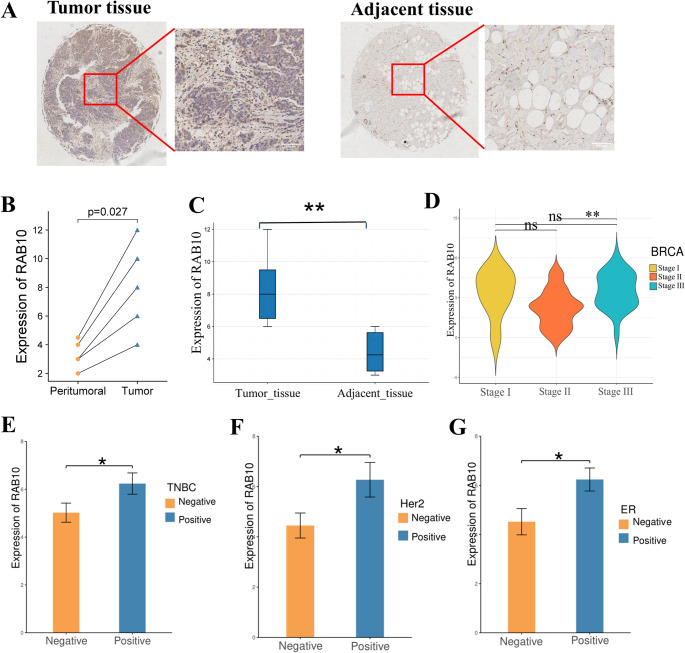
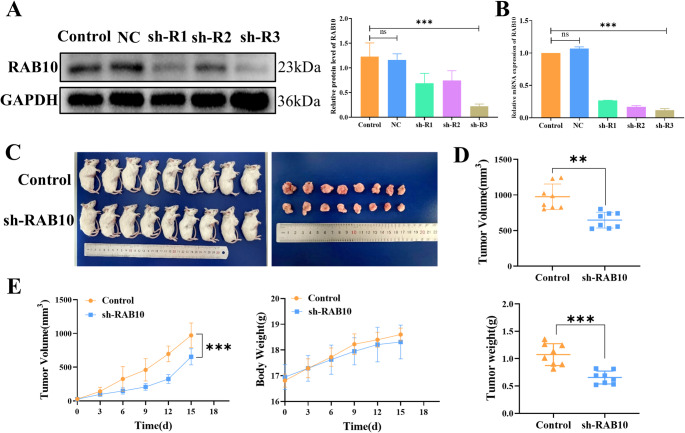
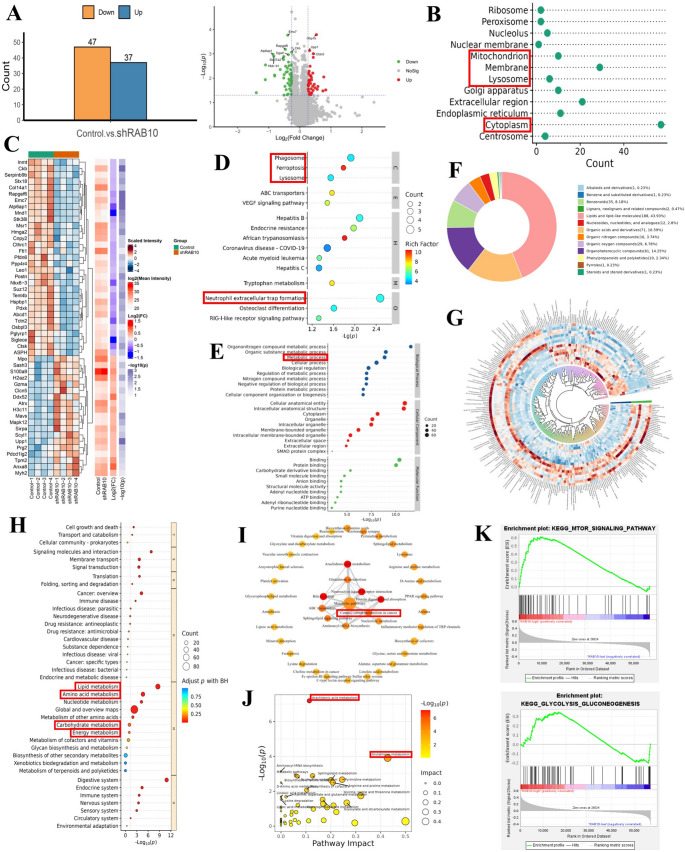
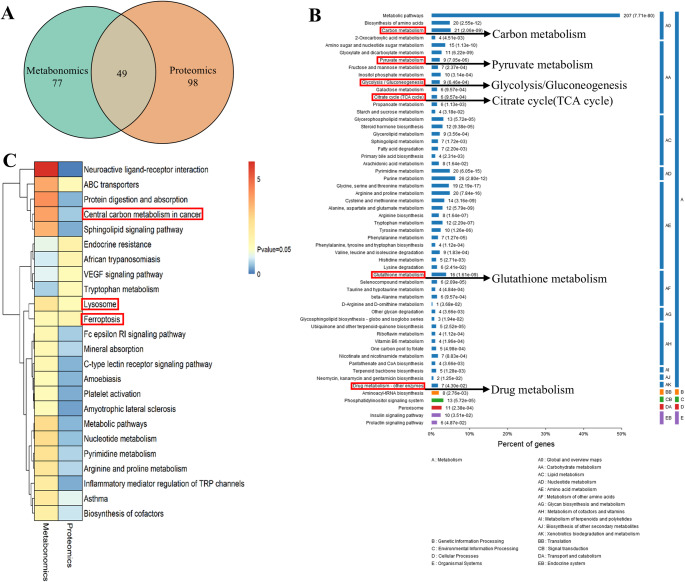
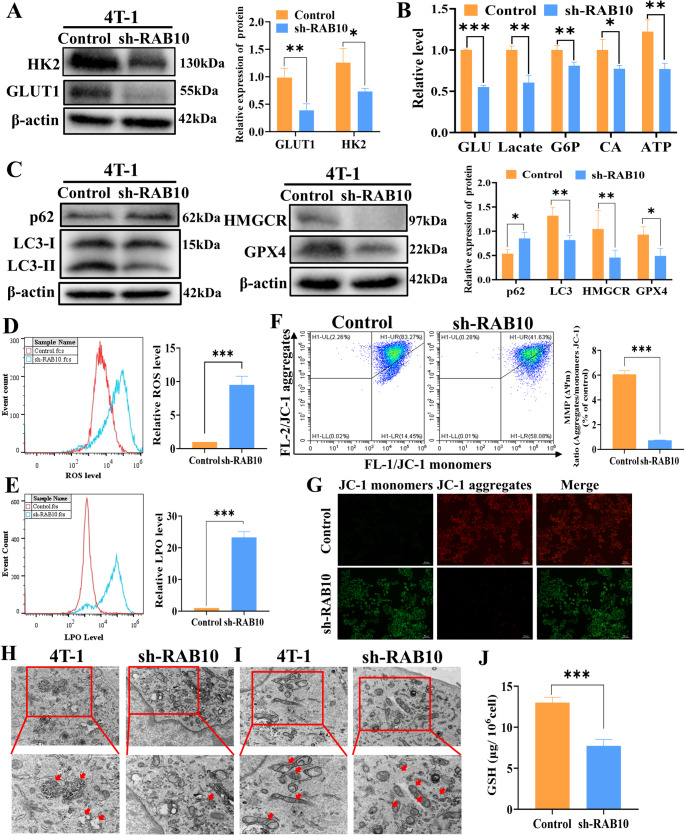
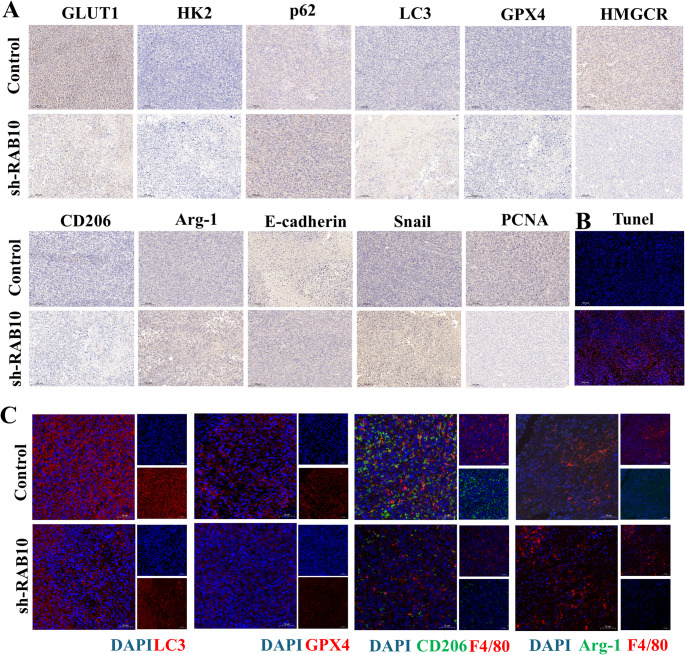
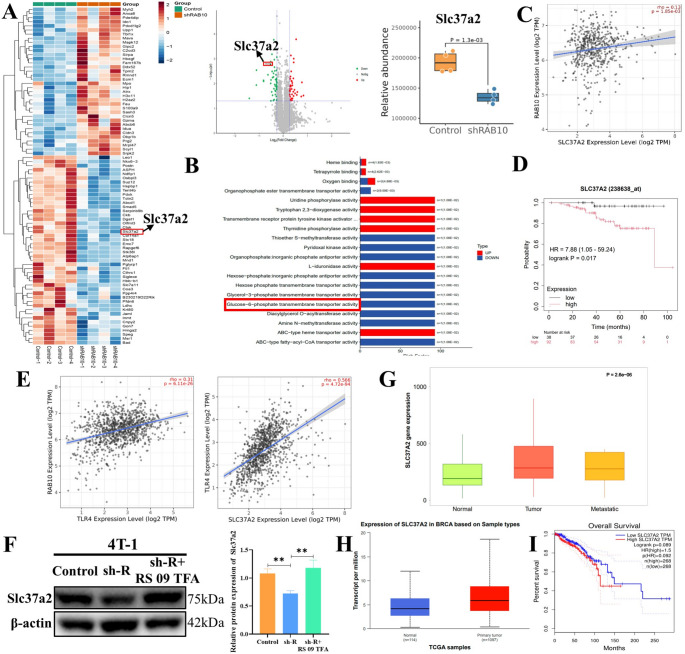
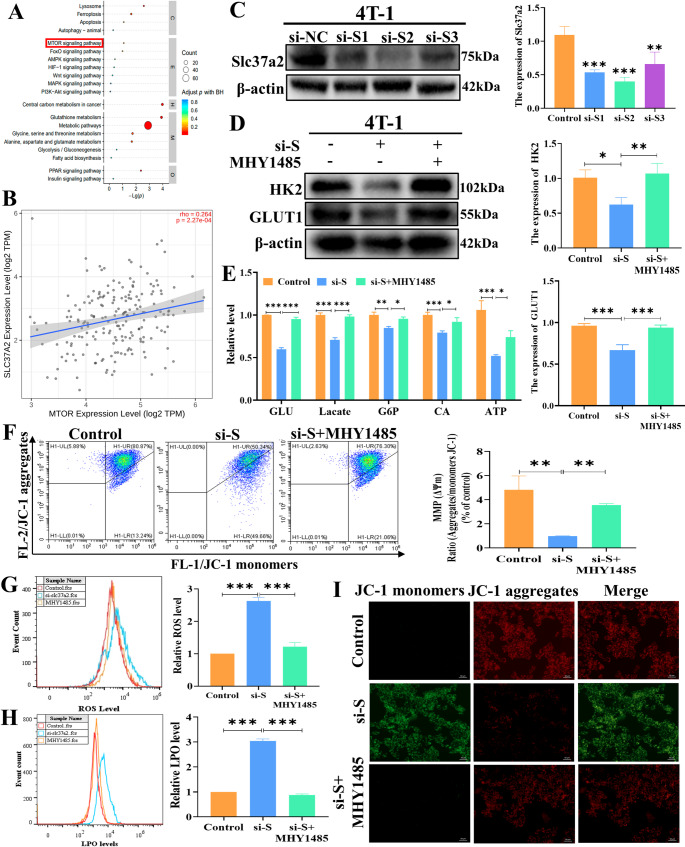
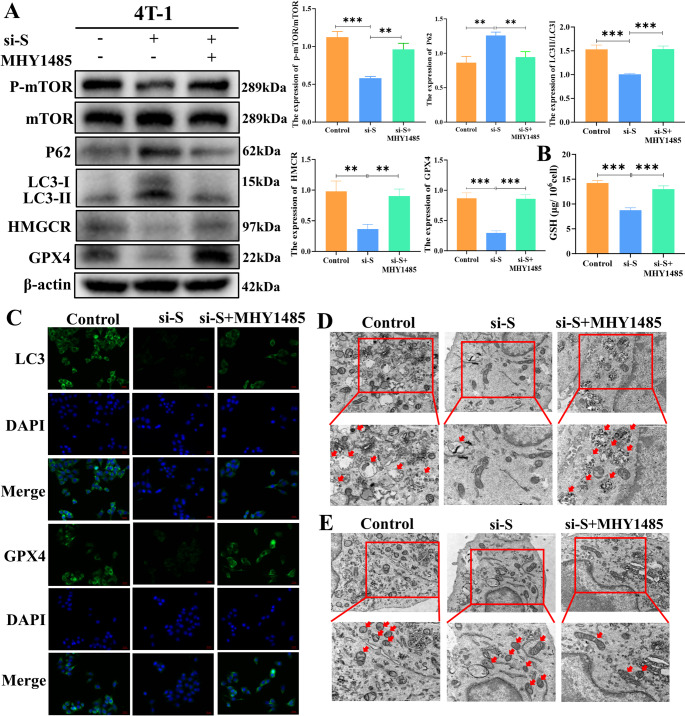
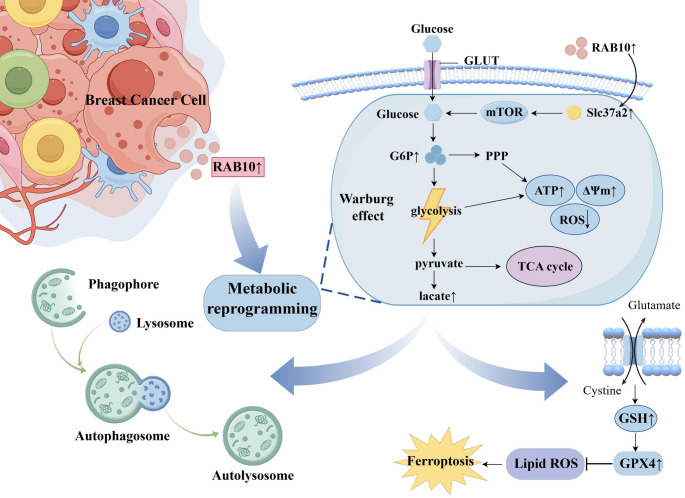
Breast cancer (BC) is the most prevalent and highly heterogeneous malignancy affecting females worldwide, and its development is closely linked to metabolic reprogramming. In this study, label-free quantification (LFQ) was used to analyze the protein expression in exosomes secreted by BC drug-resistant cells, identifying RAS-associated binding protein (RAB) 10 as the most significantly upregulated protein. RAB10, a member of the small GTPase family with complex biological functions, is highly expressed in BC and is associated with poor prognosis. In this study, we mainly utilized mouse breast cancer 4T-1 cells (wild-type control cells) and tumor-induced 4T-1 cells (isolated from mouse in situ tumor tissues to simulate the phenotype of the in vivo tumor microenvironment), and on this basis, conducted in vitro functional verification and in vivo tumorigenesis experiments. A comprehensive multi-omics analysis, including metabolomics and proteomics, following RAB10 knockdown, demonstrated the crucial role of RAB10 in regulating central carbon metabolism, which is essential for autophagy and ferroptosis in BC cells. Our study further confirmed that RAB10 mediates metabolic reprogramming in BC cells by regulating the Slc37a2/mTOR pathway, leading to enhanced autophagy and inhibition of ferroptosis. This comprehensive multi-omics analysis elucidated the key molecular and regulatory mechanisms underlying RAB10-induced metabolic reprogramming in tumors, providing potential new therapeutic targets and biomarkers for prognostic assessment in BC treatment.

Keywords: Autophagy; Breast cancer; Ferroptosis; Metabolism; RAB10.


Conflict of interest statement

Declarations. Ethics statement: All animal experiments were performed under the policy of the Ethics Committee of Bengbu Medical University. The study was approved by the Ethics Committee of Bengbu Medical University and the Ethics Committee of Laboratory Animal Management (Ethics No.: LENKO Approval No. [2023] 537). Conflict of interest: The authors declare no conflict of interest.

Figures

Fig. 1
Fig. 1
Bioinformatics analysis of RAB10 highly expressed in multiple cancers. (A) RNA sequencing data from 33 cancers in the TCGA database were analyzed using the TIMER2.0 platform. (B) RAB10 protein expression levels in tumor and normal tissues were analyzed using the UALCAN database. (C) DNA methylation levels of RAB10 across various cancers. (D) CNV copy number variation analysis of RAB10 expression in breast cancer. (E) Survival curves for overall survival (OS) in breast cancer (222981-s-at). (F) RAB10 mRNA expression in breast cancer patients across stages I, II, III, IV, and X. (G) ROC curves at 1, 3, and 5 years in the prediction model for breast cancer patients. (H) Correlation of RAB10 with multiple glucose metabolism genes. (I) LOH heterozygosity analysis of RAB10. (J) RNAss tumor stemness score of RAB10 in multiple cancers. (K) Correlation of RAB10 expression with infiltration levels of macrophages, neutrophils, CD8 + T cells, CD4 + T cells, and Treg cells. Data are the means ± SD (n = 3 independent experiments); *P < 0.05, **P < 0.01, ***P < 0.001, ****P < 0.0001
Fig. 2
Fig. 2
RAB10 is highly expressed in cancer tissues of BC patients. (A) Representative images of histochemical staining in breast cancer tissues and adjacent normal tissues. (B, C) Statistical analysis of RAB10 expression scoring in paired samples from breast cancer patients. (D) Statistical analysis of RAB10 expression scores in tumor tissues of breast cancer patients based on TNM stage classification. (E) Proportion of TNBC-positive patients with high RAB10 expression. (F) Proportion of HER2-positive patients with high RAB10 expression. (G) Proportion of ER-positive patients with high RAB10 expression. Data are the means ± SD (n = 3 independent experiments); *P < 0.05, **P < 0.01, ***P < 0.001, ****P < 0.0001
Fig. 3
Fig. 3
In vivo experiments confirm that RAB10 deletion inhibits breast cancer growth. (A) Western blot analysis showing knockdown efficiency of RAB10 lentiviral vectors. (B) qRT-PCR analysis confirming knockdown efficiency of RAB10 lentiviral vectors. (C) Digital images of tumors from each group. (D) Tumor volume and weight in each group after dissection. (E) Growth curves of body weight and tumor volume over time in different mouse groups. Data are the means ± SD (n = 3 independent experiments); *P < 0.05, **P < 0.01, ***P < 0.001, ****P < 0.0001
Fig. 4
Fig. 4
Proteomics and untargeted metabolomics analyses of key molecules and metabolic pathways involved in RAB10 induced malignant progression of breast cancer. (A) Number of differential proteins detected in positive and negative ion modes. (B) Subcellular localization analysis. (C) Hierarchical cluster analysis of differential proteins. (D) Enrichment bubble plot of KEGG-significant pathways detected by proteomics. (E) GO enrichment analysis for proteomics revealed that molecular function (MF) was focused on protein binding activity. (F) Number of metabolites detected in positive and negative ion modes and proportion of identified metabolites in each chemical classification. (G) Circle heatmap showing up- and down-regulated differential metabolites. (H) Enrichment map of major pathways detected by metabolomics. (I) Pathway-pathway network analysis. (J) Pathway analysis of upregulated and downregulated metabolites. (K) Gene Set Enrichment Analysis (GSEA) of RAB10-related pathways. Data are the means ± SD (n = 3 independent experiments); *P < 0.05, **P < 0.01, ***P < 0.001, ****P < 0.0001
Fig. 5
Fig. 5
Communal KEGG analysis of the respective KEGG enrichment results of the metabolites and proteins. (A) Venn diagram of total significant KEGG pathways. (B) KEGG metabolic pathway enrichment plot and corresponding P-values. (C) Heatmap of shared KEGG pathway enrichment. Data are the means ± SD (n = 3 independent experiments); *P < 0.05, **P < 0.01, ***P < 0.001, ****P < 0.0001
Fig. 6
Fig. 6
Knockdown of RAB10 inhibits glucose metabolism and autophagy and induces ferroptosis in 4T-1 cells. (A) Western Blot showing down-regulation of HK2 and GLUT1 expression levels after down-regulation of RAB10. (B) Kit assay for glucose concentration, lactate production, G6P content, citrate (CA) content and ATP levels down-regulated after sh-RAB10. (C) Western Blot showing the expression levels of P62, LC3, HMGCR, and GPX4. (D, E) Flow cytometry analysis of ROS and LPO content. (F) Changes in mitochondrial membrane potential. (HG) Fluorescence detection of mitochondrial membrane potential changes in both groups. (H, I) Morphological changes in autophagic vesicles and mitochondria observed through transmission electron microscopy. (J) Changes in GSH content following RAB10 knockdown. Data are the means ± SD (n = 3 independent experiments); *P < 0.05, **P < 0.01, ***P < 0.001, ****P < 0.0001
Fig. 7
Fig. 7
In vivo experimental validation of protein expression changes in tumor tissues after RAB10 knockdown. (A) IHC analysis of GLUT1, HK2, p62, LC3, GPX4, HMGCR, CD206, Arg-1, E-cadherin, and Snail expression in control and sh-RAB10 groups (scale bar = 100 μm). (B) TUNEL staining of tumor sections from different treatment groups (scale bar = 100 μm). (C) Immunofluorescence assay for GPX4, LC3, CD206, and Arg-1 expression levels. Data are the means ± SD (n = 3 independent experiments); *P < 0.05, **P < 0.01, ***P < 0.001, ****P < 0.0001
Fig. 8
Fig. 8
RAB10 was positively correlated with Slc37a2 and Slc37a2 was associated with poor prognosis of breast cancer. (A) Decreased expression of Slc37a2 following RAB10 knockdown. (B) Reduced activity of glucose-6-phosphate transmembrane transporter after RAB10 knockdown. (C) Correlation analysis of RAB10 and Slc37a2. (D) Kaplan-Meier data analyses show that BC patients with high Slc37a2 expression have worse 5-year overall survival and recurrence-free survival (P < 0.05). (E) Correlation analysis of RAB10, TLR4, and Slc37a2. (F) Western blot analysis of Slc37a2 expression following sh-RAB10 and RS 09 TFA treatment. (G) TNMplot database shows high Slc37a2 expression in BC patients (P < 0.01). (H) TCGA data analyses show that high Slc37a2 expression in primary tumor (P < 0.01).(I) TCGA data analyses show that BC patients with high Slc37a2 expression have worse 5-year overall survival and recurrence-free survival (P < 0.05). Data are the means ± SD (n = 3 independent experiments); *P < 0.05, **P < 0.01, ***P < 0.001, ****P < 0.0001
Fig. 9
Fig. 9
Down-regulation of Slc37a2 affects metabolic reprogramming of cells. (A) Multi-omics joint analysis shows that the mTOR signaling pathway plays a key role. (B) Correlation analysis between Slc37a2 and mTOR. (C) Western blot analysis of si-Slc37a2 knockdown efficiency. (D) Changes in GLUT1 and HK2 expression after treatment with si-S and MHY1485 in 4T-1 cells. (E) Changes in glucose concentration, lactate production, G6P content, citrate content, and ATP levels after treatment of 4T-1 cells with si-S and MHY1485. (F) Mitochondrial membrane potential changes detected by flow cytometry. (G) ROS levels detected by flow cytometry. (H) LPO levels detected by flow cytometry. (I) Mitochondrial membrane potential changes observed under a fluorescence microscope. Data are the means ± SD (n = 3 independent experiments); *P < 0.05, **P < 0.01, ***P < 0.001, ****P < 0.0001
Fig. 10
Fig. 10
Down-regulation of Slc37a2 inhibits cellular metabolism and autophagy, induces ferroptosis. (A) Western blot to detect changes in the expression levels of p-mTOR/mTOR, p62, LC3, HMGCR and GPX4 in 4T-1 cells after treatment with si-Slc37a2 and MHY1485. (B) Kit to detect changes in glutathione levels. (C) Immunofluorescence analysis of LC3 and GPX4 expression after Slc37a2 downregulation. (D) Changes in autophagic vesicles observed through transmission electron microscopy. (E) Mitochondrial morphology alterations observed through transmission electron microscopy. Data are the means ± SD (n = 3 independent experiments); *P < 0.05, **P < 0.01, ***P < 0.001, ****P < 0.0001
Fig. 11
Fig. 11
RAB10 regulates autophagy and ferroptosis in breast cancer cells by regulating metabolism reprogramming

Similar articles

References

    1. Bray F, Laversanne M et al (2024) Global cancer statistics 2022: GLOBOCAN estimates of incidence and mortality worldwide for 36 cancers in 185 countries[J/OL]. CA: a cancer journal for clinicians. 74(3):229–263. 10.3322/caac.21834 - PubMed
    1. Kawiak A (2022) Molecular research and treatment of breast Cancer[J/OL]. Int J Mol Sci 23(17):9617. 10.3390/ijms23179617 - PMC - PubMed
    1. Chua CEL, Tang BL (2018) Rab 10-a traffic controller in multiple cellular pathways and locations[J/OL]. J Cell Physiol 233(9):6483–6494. 10.1002/jcp.26503 - PubMed
    1. Nong S, Han X, Xiang Y et al (2023) Metabolic reprogramming in cancer: mechanisms and therapeutics[J/OL]. MedComm 4(2). 10.1002/mco2.218 - PMC - PubMed
    1. Liu J, Bai X, Zhang M et al (2024) Energy metabolism: a new target for gastric cancer treatment[J/OL]. Clinical & translational oncology: official publication of the federation of Spanish oncology societies and of the National Cancer Institute of Mexico. 26(2):338–351. 10.1007/s12094-023-03278-3 - PubMed

LinkOut - more resources