. 2025 Jul 14;23(7):e3003272.
doi: 10.1371/journal.pbio.3003272. eCollection 2025 Jul.

The locus coeruleus influences behavior by coordinating effective integration of fear memories and sensory input

Affiliations

The locus coeruleus influences behavior by coordinating effective integration of fear memories and sensory input

Haoyu Duan et al. PLoS Biol. .

Abstract

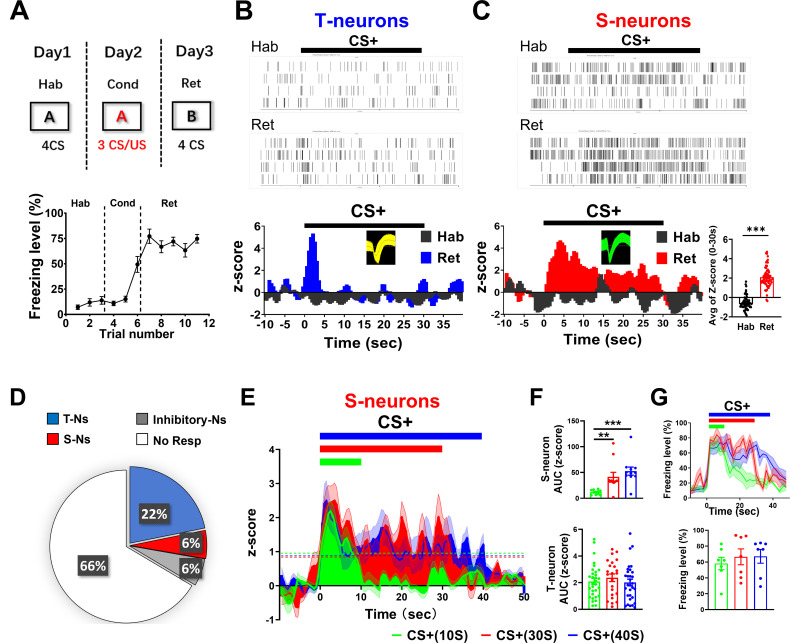
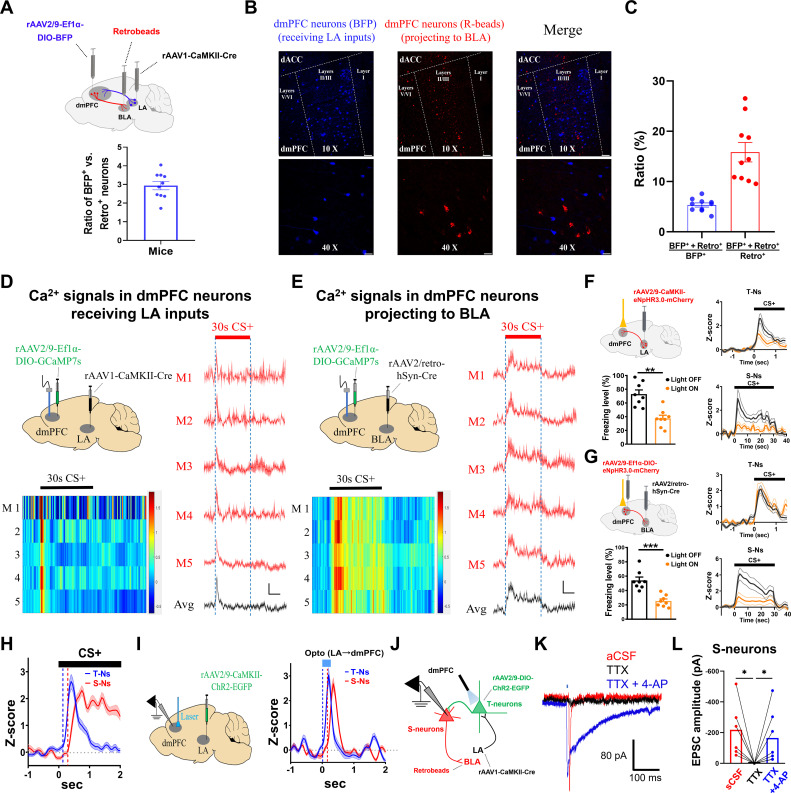
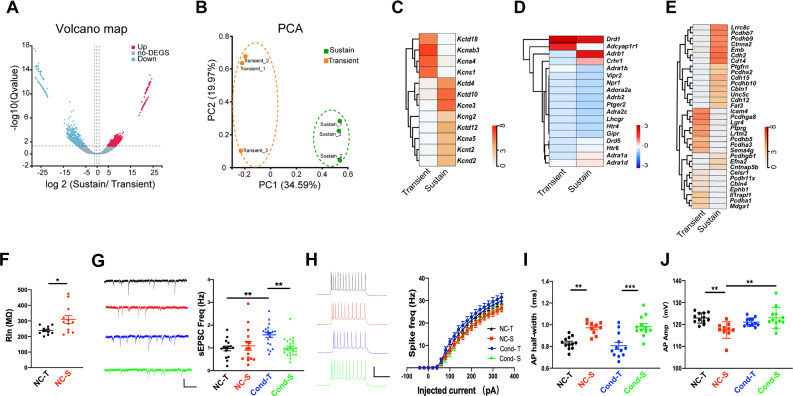
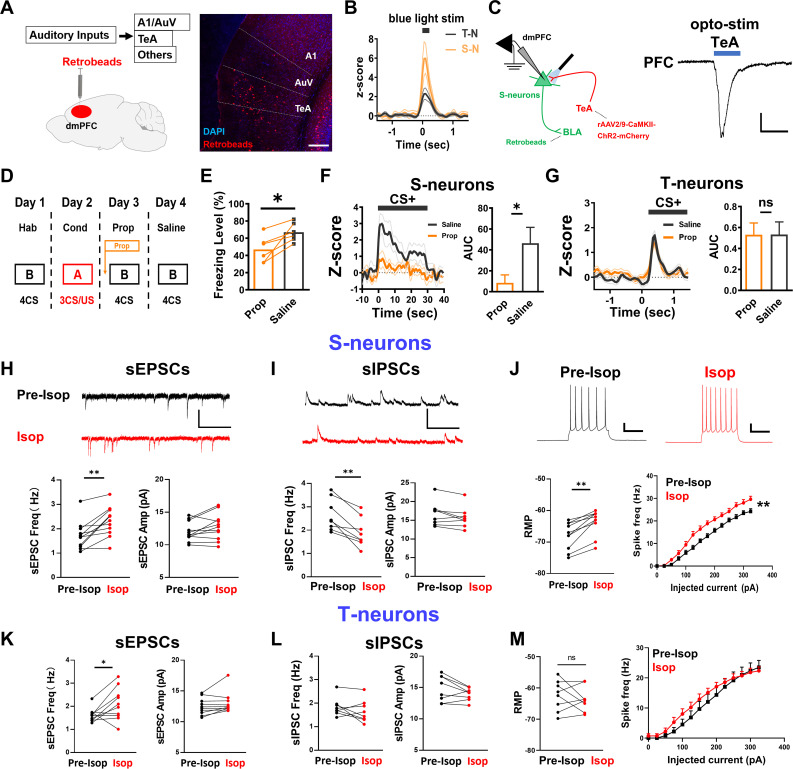
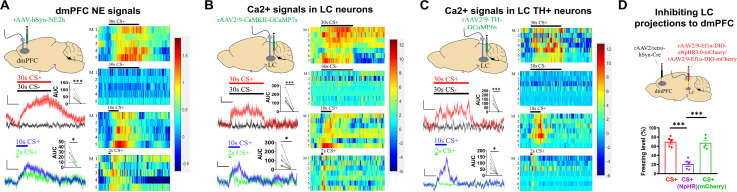
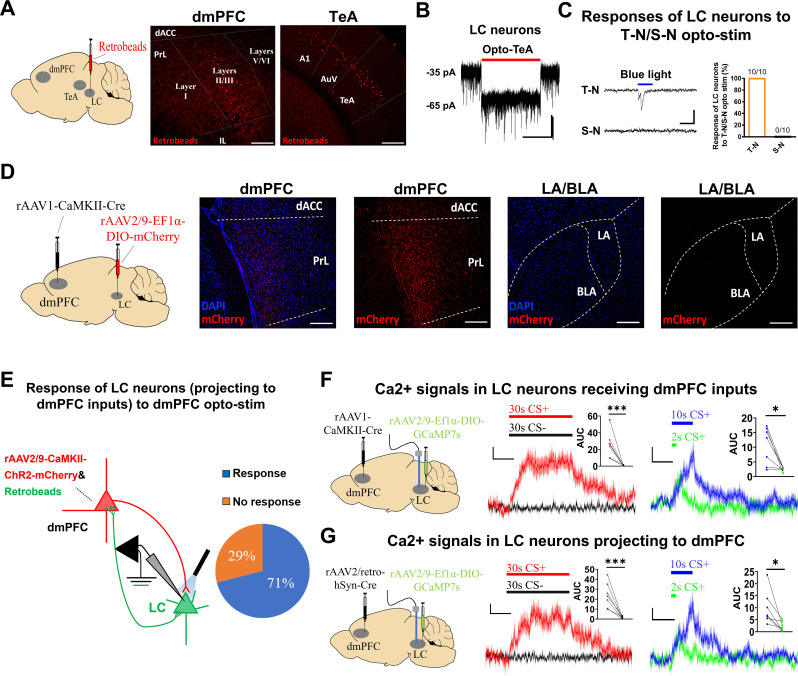
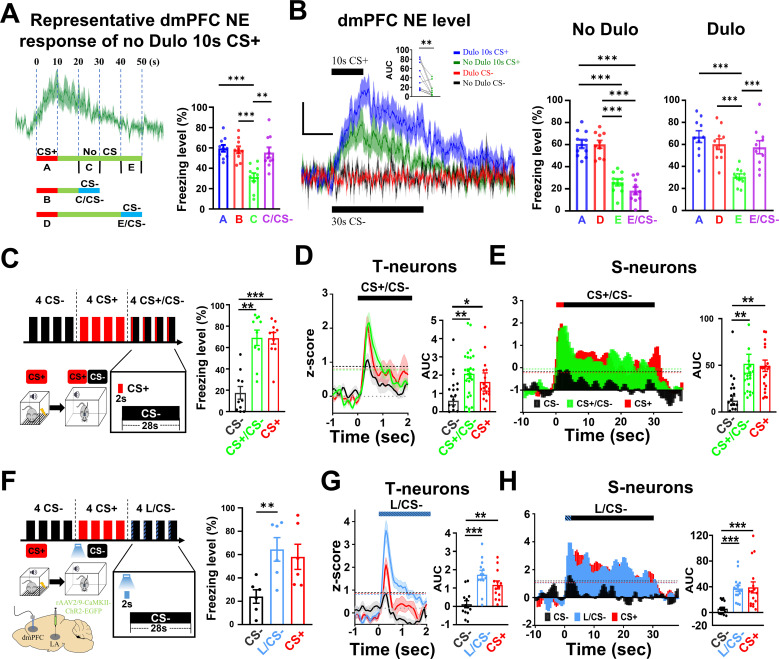
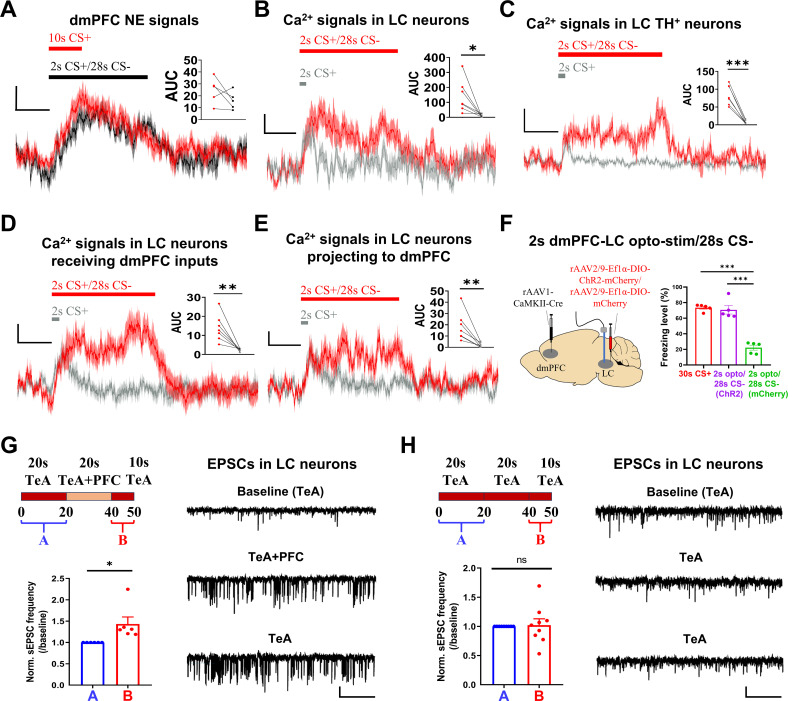
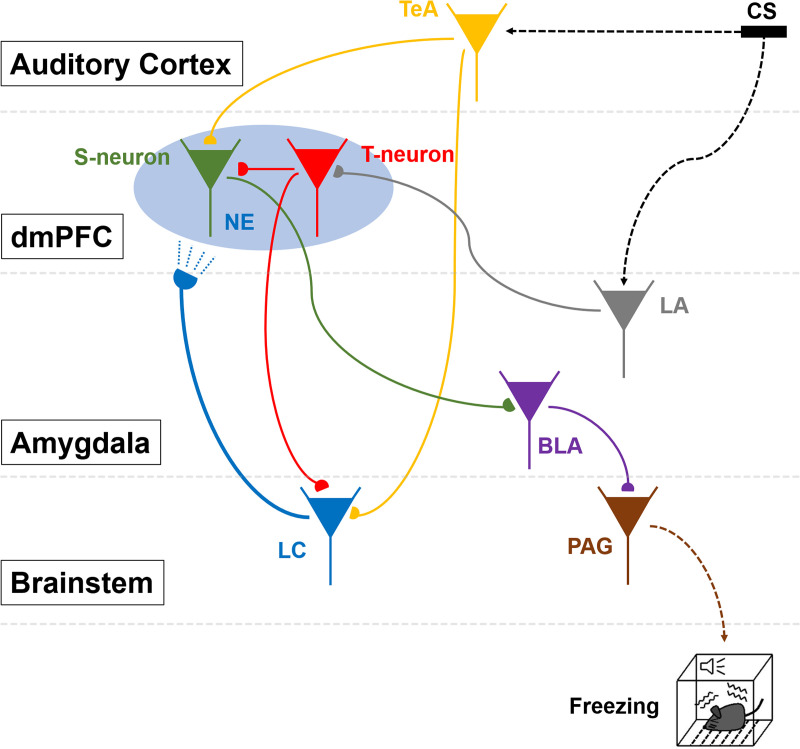
An essential function of memory is to guide behavior for better survival and adaptation. While memory formation has been extensively studied, far less is understood about how memory retrieval influences behaviors. In the auditory Pavlovian threat conditioning paradigm using C57BL/6J mice, retrieving a conditioned threat memory is associated with spiking in two dorsomedial prefrontal cortex (dmPFC) neurons with transient (T-neurons) and sustained (S-neurons) patterns. We show here that T-neurons and S-neurons are two distinct neuronal populations with different neuronal and synaptic properties and mRNA profiles. S-neuron spiking matches freezing behavior and is required for freezing. This sustained activity in S-neurons requires auditory inputs and the release of norepinephrine (NE) in the dmPFC. The activation of the locus coeruleus (LC) is initiated by dmPFC T-neuron inputs, sustained by auditory inputs, and is required for the transition to freezing by enhancing S-neuron activity. Interestingly, LC activation precipitates a brief period during which nonconditioned cues also induce freezing. Our findings highlight the critical contribution of the LC/NE system in the transition from memory to behavior, which coordinates the effective integration of memory, sensory inputs and emotional state for optimal adaptation.


Conflict of interest statement

The authors have declared that no competing interests exist.

Figures

Fig 1
Fig 1. Activity of dmPFC T-neurons and S-neurons during retrieval of threat memory.
(A) (Upper) Experimental procedure for threat conditioning. (Lower) Freezing levels before, during, and after auditory threat conditioning. N = 12 mice. (B) (Upper) Raster plots of spiking in representative T-neurons during habituation (Hab) and CS retrieval after conditioning (Ret). (Lower) Peri-event histograms showing spiking in the T-neurons. Bars indicate CS presentation. Insert: spike waveform. Bin width, 0.5 s. n = 23 units/5 mice. (C) (Upper) Raster plots of spiking in representative S-neurons during habituation and CS retrieval after conditioning. (Lower left) Peri-event histograms of S-neuron spiking. (Lower right) Averaged z-scores vales for S-neurons during habituation and retrieval. Insert: spike waveform and Avg of Z-score (0–30 s). Two-tailed unpaired t test, Hab vs. Ret, P < 0.001. n = 17 units/5 mice. (D) Distribution of recorded dmPFC neurons based on their responses to CS in conditioned mice. About 22% (151/692) showed a transient increase, 6% (41/692) sustained increase, 66% (460/692) no response and 6% (40/692) were inhibitory neurons and. n = 692 units/42 mice. (E) Spiking in S-neurons elicited by three CSs with different durations. Dotted lines indicate z-score = 1. (F) (Upper) The AUC (z-score) of CS-elicited S-neuron response. CSs correspond to those used in (E). One-way RM ANOVA, F (2, 45) = 9.671, Bonferroni’s posttest; CS+ (10 s) vs. CS+ (30 s), P < 0.01; CS+ (10 s) vs. CS+ (40 s), P < 0.001; n = 16 units/8 mice. (Lower) The AUC (z-score) of CS-elicited responses in T-neurons (n = 29 units/8 mice). (G) (Upper) Freezing levels and time courses elicited by three CSs. One-way RM ANOVA, F (2, 18) = 15.98, Bonferroni’s posttest; CS+ (10 s) vs. CS+ (30 s), P < 0.01; CS+ (10 s) vs. CS+ (40 s), P < 0.001. (Lower) Freezing levels elicited by three CSs. N = 7 mice. Unless specified, statistical comparisons were performed using two-tailed unpaired t test; *, P < 0.05; **, P < 0.01; ***, P < 0.001. Data represented as mean ± SEM. Numerical data can be found in S1 Data.
Fig 2
Fig 2. Distinct responses in dmPFC T-neurons and S-neurons, their inputs, outputs and connections with each other.
(A) (Top) Diagram showing the virus injection sites. The dmPFC neurons receiving LA inputs were labeled with BFP, BLA-projecting dmPFC neurons were labeled with retrobeads (red). (Bottom) Ratio of BFP+ vs. Retro+ neurons (each dot represents averaged values from a single mouse). N = 47 sections/10 mice. (B) Representative images showing the spatial localization of labeled dmPFC neurons with BFP (blue) or retrobeads (red), taken using 10 X (upper) or 40 X (lower) objectives. The majority of labelled neurons were located in layer II/III of dmPFC. Scale bars, 100 μm (10 X) and 25 μm (40 X). (C) Numbers of neurons positive for both BFP+ and Retro+ over BFP+ neurons (blue) and numbers of neurons positive for both BFP+ and Retro+ over Retro+ neurons (red). N = 10 mice. (D) (Left, top) Sites for virus injections and Ca2+ response recording; (Left, bottom), Heat maps showing Ca2+ signals elicited by 30 s CS+ (dotted lines) in dmPFC neurons receiving LA inputs. (Right) Averaged Ca2+ signals from individual mouse (red traces) and the averaged responses from all mice (black), elicited by 30 s CS+ in dmPFC neurons receiving LA inputs. Scale bars, 1% ΔF/F and 10 s. N = 5 mice. (E) (Left, top) Sites for virus injections and Ca2+ response recording; (Left, bottom) Heat maps showing Ca2+ signals elicited by 30 s CS+ in dmPFC neurons projecting to BLA. (Right) Averaged Ca2+ signals from individual mouse (red traces) and averaged responses from all mice (black), elicited by 30 s CS+ in dmPFC neurons projecting to BLA. Scale bars, 1% ΔF/F and 10 s. N = 5 mice. (F) (Left, top) Sites of virus injections and optogenetic inhibition; (Left, bottom) Opto-inhibition of LA axonal terminals in the dmPFC on freezing levels during CS+ retrieval. Two-tailed paired t test, Laser ON vs. Laser OFF, P < 0.01; N = 8 mice. (Right) Opto-inhibition of LA axonal terminals in dmPFC on spike rates in T-neurons (top) and S-neurons (bottom), during CS+ retrieval. T-neurons, n = 35 units/8 mice; S-neurons, n = 20 units/8 mice. (G) (Left, top) Sites of virus injections and optogenetic inhibition; (Left, bottom) Opto-inhibition of BLA-projecting dmPFC neurons on freezing levels during CS+ retrieval. Two-tailed paired t test, Light ON vs. Light OFF, P < 0.001; N = 8 mice. (Right) Opto-inhibition of BLA-projecting dmPFC neurons on spike rates in dmPFC T-neurons (top) and S-neurons (bottom), during CS+ retrieval. T-neurons, n = 41 units/8 mice; S-neurons, n = 24 units/8 mice. (H) Response latency of dmPFC T-neurons and S-neurons elicited by CS+. Dotted lines represent the time points when slope (dy/dx) of responses were equal to 1 (points of intersection were 0.122 and 0.298 s, respectively). T-neurons, n = 54 units/12 mice; S-neurons, n = 29 units/12 mice. (I) (Left) Sites of virus injections and dmPFC recording. (Right) Responses in dmPFC T-neurons and S-neurons to opto-stimulation of LA neuron axonal terminals in dmPFC (bar). Dotted lines represented the time points when slope (dy/dx) of responses were equal to 1 (points of intersection were 0.008 and 0.159 s, respectively). T-neurons, n = 32 units/6 mice; S-neurons, n = 16 units/6 mice. (J) Schematic diagram showing opto-activation of T-neurons and recording in S-neurons in PFC slices. (K) Representative EPSC traces in the S-neurons (projecting to BLA) elicited by opto-stimulation of dmPFC neurons receiving LA inputs (5 ms, bar), in sequential presence of aCSF, TTX, and TTX + 4-AP. The EPSC trace during TTX bath application (black) was rightward shifted for better visualization. Scale bars, 100 ms and 80 pA. (L) EPSC amplitudes in the S-neurons from H2. n = 6 cells/3 mice, paired t test, P < 0.05. Numerical data can be found in S1 Data.
Fig 3
Fig 3. Characterizations of T-neurons and S-neurons.
(A) Volcano plots showing significantly differentially expressed genes (DEGs) in the T-neurons and S-neurons. (B) Principal components analysis (PCA) of an RNA-seq data set of 6 samples was sufficient to distinguish between T-neurons and S-neurons. (C) Heat map showing average transcripts per million (TPM) of differentially expressed genes encoding potassium channels with significance. Heatmap was standardized by rows. (D) Heat map showing average TPM of differentially expressed genes related to norepinephrine signaling with significance. (E) Heat map showing average TPM of differentially expressed genes encoding cell adhesion molecules with significance. In all heatmaps, the redder the color, the higher the expression level. Standardized method: log (average TPM + 1). n = 20 cells/mouse, 3 mice each group. (F) Input resistance of T-neurons and S-neurons from non-conditioned (NC) mice. Two-tailed unpaired t test, NC-T vs. NC-S, P = 0.0179; n = 11 cells/3 mice (NC-T), 13 cells/3 mice (NC-S). (G) (Left) Representative sEPSC traces and (right) sEPSC frequency in dmPFC T-neurons and S-neurons, from conditioned (Cond) and non-conditioned (NC) mice. One-way RM ANOVA, F (2, 53) = 7.804, Bonferroni’s posttest, NC-T vs. Cond-T, P < 0.01; NC-S vs. Cond-S, P < 0.01; n = 15 cells/4 mice (NC-T), 15 cells/4 mice (NC-S), 20 cells/4 mice (Cond-T), 24 cells/6 mice (Cond-S). Scale bars, 20 pA and 500 ms. (H) (Left) Representative traces of action potentials in dmPFC T-neurons and S-neurons elicited by injection of current through the recording electrodes. (Right) Spike frequency of action potentials plotted against injected currents. Two-way RM ANOVA, F (30, 990) = 6.894, Bonferroni’s posttest, P < 0.001; NC-T vs. NC-S, P < 0.01; NC-T vs. Cond-T, P < 0.001; n = 10 cells/4 mice (NC-T), 11 cells/4 mice (NC-S), 11 cells/4 mice (Cond-T), 21 cells/6 mice (Cond-S). Scale bars, 50 mV and 200 ms. (I) Half-width of action potentials (AP) in the T-neurons and S-neurons. One-way RM ANOVA, F (3, 42) = 13.57, P < 0.001, Bonferroni’s posttest; NC-T vs. NC-S, P < 0.01; Cond-T vs. Cond-S, P < 0.001; n = 12 cells/4 mice (NC-T), 10 cells/4 mice (NC-S), 12 cells/4 mice (Cond-T), 12 cells/6 mice (Cond-S). (J) Amplitude of AP in the T-neurons and S-neurons. One-way RM ANOVA, F (3, 41) = 5.530, P < 0.01, Bonferroni’s posttest; NC-T vs. Cond-T, P < 0.05; n = 12 cells/4 mice (NC-T), 9 cells/4 mice (NC-S), 12 cells/4 mice (Cond-T), 12 cells/6 mice (Cond-S).
Fig 4
Fig 4. Contribution ofβ-norepinephrine receptors to dmPFC neuronal responses and freezing levels.
(A) Experimental paradigm for examining inputs to dmPFC using injection of retrobeads in dmPFC (left) and visualization of retrobeads in the auditory cortex (right). A1, primary auditory cortex; AuV, auditory cortex; TeA, temporal association cortex. Scale bar, 200 μm. (B) Responses (z-score) of T-neurons and S-neurons to opto-activation of TeA inputs (0.9 Hz, 250 ms). T-neurons, n = 20 units/5 mice; S-neurons, n = 12 units/5 mice. rAAV2/9-CaMKII-ChR2-mCherry viruses were injected in TeA and optical fiber implanted in the TeA to activate TeA neurons. (C) Injection of rAAV2/9-CaMKII-ChR2-mCherry virus in the TeA (Left). Representative EPSC trace in the dmPFC neurons to opto-stimulation of TeA inputs (Right). Bar indicates blue light illumination. Scale bars, 200 pA and 25 ms. (D) Experimental procedure for examining intra-cerebroventricular injection of propranolol or saline on neuronal responses and freezing levels. (E) Freezing levels during retrieval with (Prop) or without (Saline) propranolol injection in conditioned mice. Two-tailed paired t test, Prop vs. Saline, P < 0.05; N = 6 mice. (F) Effect of intra-cerebroventricular injection of Prop on spike rates in the S-neurons. Two-tailed paired t test, Prop vs. Saline, P < 0.05. N = 9 units/6 mice. (G) Effect of intra-cerebroventricular injection of Prop on spike rates in the T-neurons. N = 22 units/6 mice. (H) (Top) Representative sEPSCs traces in the S-neurons during bath application of Isop (50 μM). Scale bars, 20 pA and 50 ms. (Bottom) Effects of Isop on sEPSC frequency (Two-tailed paired t test, t = 4.246, df = 10, Pre-Isop vs. Isop, P < 0.01; n = 11 cells/4 mice), and sEPSC amplitude in the S-neurons (Two-tailed paired t test, t = 0.976, df = 20, Pre-Isop vs. Isop, P > 0.05; n = 11 cells/4 mice). (I) (Top) Representative sIPSCs traces in S-neurons during bath application of Isop. Scale bars, 50 pA and 50 ms. (Bottom) Effects of Isop on sIPSC frequency (Two-tailed paired t test, t = 4.961, df = 7, Pre-Isop vs. Isop, P < 0.01; n = 8 cells/3 mice) and sIPSC amplitude in the S-neurons (Two-tailed paired t test, t = 2.088, df = 7, Pre-Isop vs. Isop, P > 0.05; n = 8 cells/3 mice). (J) (Top) Representative action potential traces in the S-neurons before and after bath application of Isop. Scale bars, 20 mV and 200 ms. (Lower left) Effects of Isop on the resting membrane potential (RMP) in the S-neurons (Two-tailed paired t test, t = 6.143, df = 9, Pre-Isop vs. Isop, P < 0.01; n = 10 cells/4 mice) and intrinsic excitability of S-neurons (Two-way RM ANOVA, F (15, 288) = 2.294, Bonferroni’s posttest, P < 0.01; Pre-Isop vs. Isop, P < 0.01; n = 12 cells/3 mice). (K) Effects of Isop on sEPSC frequency (Two-tailed paired t test, t = 2.333, df = 9, Pre-Isop vs. Isop, P < 0.05; n = 10 cells/4 mice) and sEPSC amplitude in the T-neurons (Two-tailed paired t test, t = 1.758, df = 9, Pre-Isop vs. Isop, P < 0.05; n = 10 cells/4 mice). (L) Effects of Isop on sIPSC frequency (Two-tailed paired t test, t = 1.265, df = 7, Pre-Isop vs. Isop, P > 0.05; n = 8 cells/3 mice) and sIPSC amplitude in the T-neurons (Two-tailed paired t test, t = 1.778, df = 7, Pre-Isop vs. Isop, P > 0.05; n = 8 cells/3 mice). (M) Effects of Isop on RMP (Two-tailed paired t test, Pre-Isop vs. Isop, P > 0.05; n = 8 cells/3 mice) and intrinsic excitability of T-neurons (Two-way RM ANOVA, F (15, 336) = 0.4195, Bonferroni’s posttest, P > 0.05; Pre-Isop vs. Isop, P > 0.05; n = 12 cells/3 mice). Numerical data can be found in S1 Data.
Fig 5
Fig 5. The dmPFC NE levels, LC neuron activity and BLA NE levels associated with CS retrieval.
(A) (Left) Sites of virus injections and NE signal recording (top), and plots of NE signals with stimuli (middle and bottom). Scale bars, 0.5% ΔF/F and 10 s. Inserts: AUC of ΔF/F of dmPFC NE signals. Two-tailed unpaired t test, 30 s CS+ vs. 30 s CS−, P < 0.001; 10 s CS+ vs. 2 s CS+, P < 0.05. (Right) Heat maps showing dmPFC NE signals elicited by 30 s CS+, 30 s CS−, 10 s CS+ and 2 s CS+. N = 5 mice per group. (B) (Left) Sites of virus injections and Ca2+ signal recording (top), and plots of Ca2+ signals with stimuli (middle and bottom). Scale bars, 2% ΔF/F and 10 s. Inserts: AUC of ΔF/F of LC Ca2+ signals. Two-tailed unpaired t test, 30 s CS+ vs. 30 s CS−, P < 0.01; 10 s CS+ vs. 2 s CS+, P < 0.05. (Right) Heat maps of Ca2+ responses in the LC-neurons in response to 30 s CS+, 30 s CS−, 10 s CS+ and 2 s CS+. N = 7 mice per group. (C) (Left) Sites of virus injections and optical fiber recording (top), and plots of Ca2+ signals in the LC TH+ neurons with stimuli (middle and bottom). Scale bars, 2% ΔF/F and 10 s. Insert: AUC of ΔF/F of Ca2+ signals in the LC TH+ neurons. Two-tailed unpaired t test, 30 s CS+ vs. 30 s CS−, P < 0.01; 10 s CS+ vs. 2 s CS+, P < 0.05. (Right) Heat maps for Ca2+ signals in the LC TH+ neurons in response to 30 s CS+, 30 s CS−, 10 s CS+ and 2 s CS+. N = 7 mice per group. (D) Sites of virus injections and optical fiber recording (left), and impact of opto-inhibiting dmPFC-projecting LC neurons on freezing levels (right). Two-tailed paired t test, CS+ vs. CS+ (NpHR), P < 0.001; CS+ (NpHR) vs. CS+ (mCherry), P < 0.001. N = 5 mice, each group. Numerical data can be found in S1 Data.
Fig 6
Fig 6. LC/NE neurons are activated by inputs from dmPFC and TeA, and project to dmPFC.
(A) (Left) Experimental paradigm for examining major brain regions that project to LC, using retrobeads (red) injected in the LC. (Right) Brain regions with red fluorescence, dmPFC and TeA. Scale bar, 200 μm. (B) Responses of the LC neurons in LC slice to opto-activation of axonal terminals from TeA neurons (red bar, 10 s). rAAV2/9-CaMKII-ChR2-mCherry virus injected in the TeA, and laser illumination in the slices. Scale bars, 20 pA and 5 s. (C) (Left) Representative responses of LC neurons to opto-activation (bar, 50 ms) of axonal terminals from either T-neurons or S-neurons. Scale bars, 20 pA and 50 ms. (Right) All LC neurons responded to opto-activation of axonal terminals from the T-neurons, but none responded to opto-activation of axonal terminals from the S-neurons. n = 10 cells. (D) (Left) Experimental paradigm for examining outputs from the LC neurons receiving dmPFC projections. (Right) Presence of the mCherry fluorescence (red) in the dmPFC but not LA or BLA. Scale bars, 200 μm. (E) (Left) Schematic diagram showing opto-activation of dmPFC neurons axon terminals and recording in the dmPFC-projecting LC neurons in LC slices. (Right) 71% of dmPFC-projecting LC neurons responded to opto-activation of dmPFC neuron axon terminals and 29% showed no response to the same stimuli. (F) (Left) Diagram for virus injections, (middle and right) Ca2+ responses elicited by 30 s CS+, 30 s CS−, 10 s CS+ and 2 s CS+ in the LC neurons receiving dmPFC inputs. Scale bars, 0.5% ΔF/F and 10 s. N = 7 mice. Insert: AUC of ΔF/F of Ca2+ signals. Two-tailed unpaired t test, 30 s CS+ vs. 30 s CS−, P < 0.001; 10 s CS+ vs. 2 s CS+, P < 0.05. (G) (Left) Diagram for virus injections, (middle and right) Ca2+ responses to 30 s CS+, 30 s CS−, 10 s CS+ and 2 s CS+ in the LC neurons projecting to dmPFC. Scale bars, 0.5% ΔF/F and 10 s. N = 7 mice. Insert: AUC of ΔF/F of Ca2+ signals. Two-tailed unpaired t test, 30 s CS+ vs. 30 s CS−, P < 0.001; 10 s CS+ vs. 2 s CS+, P < 0.05.
Fig 7
Fig 7. An increase in dmPFC NE level opens a short window for transition to behavior during memory retrieval.
(A) (Left, top) Representative dmPFC NE responses to 10 s CS+ in the absence of Dulo. (Left bottom) Diagram for testing the impact of CS− on freezing levels when they were given at different time points after termination of 10 s CS+. Blue regions mark the period when CS− was given. (Right) Freezing levels during the corresponding time periods. Two-tailed paired t test, A vs. C, P < 0.001; B vs. C, P < 0.001; C vs. C/ CS−, P < 0.01. The same set of mice was used, N = 10 mice. (B) (Left) dmPFC NE signals elicited by 10 s CS+ and 30 s CS− in the absence or presence of NE uptake inhibitor Dulo. Insert: AUC of ΔF/F of dmPFC NE signals. Two-tailed unpaired t test, Dulo vs. No Dulo, P < 0.01. (Middle) Freezing levels without Dulo injection. Two-tailed paired t test, A vs. E, P < 0.001; A vs. E/CS−, P < 0.001; D vs. E, P < 0.001; D vs. E/CS−, P < 0.001. (Right) Freezing levels with Dulo injection. Two-tailed paired t test, A vs. E, P < 0.001; D vs. E, P < 0.001; E vs. E/CS−, P < 0.001. Scale bars, 0.5% ΔF/F and 10 s. The same set of mice was used, N = 10 mice. (C) Experimental protocol and stimulus patterns used (left) and corresponding freezing levels (right). One-way RM ANOVA, F (2, 8) = 0.163, Bonferroni’s posttest; CS− vs. CS+/CS−, P < 0.01; CS− vs. CS+, P < 0.001; N = 10 mice. (D) Spike rates in the T-neurons during CS retrieval (left) and AUC (z-score, 2 s) (right). One-way RM ANOVA, F (2, 72) = 4.699, Bonferroni’s posttest; CS− vs. CS+/CS−, P < 0.01; CS− vs. CS+, P < 0.05; n = 25 units/10 mice. (E) Spike rates in the S-neurons during CS retrieval (left) and AUC (z-score, 30 s) (right). One-way RM ANOVA, F (2, 33) = 2.092, Bonferroni’s posttest; CS− vs. CS+/CS−, P < 0.01; CS− vs. CS+, P < 0.01; n = 12 units/10 mice. (F) Experimental protocol for CS retrieval test, by CS+, CS−, by a hybrid stimulus (L/CS−) with opto-activation of LA axonal terminals in dmPFC for 2 s followed immediately by CS− (left) and corresponding freezing levels during retrieval (right). One-way RM ANOVA, F (2, 18) = 3.807, Bonferroni’s posttest; CS− vs. L/CS−, P < 0.05; N = 6 mice. (G) Spike rates in the T-neurons (left) and AUC (z-score, 2 s) (right). One-way RM ANOVA, F (2, 42) = 6.67, Bonferroni’s posttest; CS− vs. L/CS−, P < 0.001; CS− vs. CS+, P < 0.05; n = 13 units/6 mice. (H) Spike rates in the T-neurons (left) and AUC (z-score, 30 sec) (right). One-way RM ANOVA, F (2, 18) = 5.099, Bonferroni’s posttest; CS− vs. L/CS−, P < 0.001; CS− vs. CS+, P < 0.001; n = 16 units/6 mice. Numerical data can be found in S1 Data.
Fig 8
Fig 8. Short-term plasticity of the dmPFC-LC connections enables the CS generalization during threat memory retrieval.
(A) NE signals in the dmPFC elicited by 10 s CS+ or 2 s CS+/28 s CS−. Scale bars, 0.5% ΔF/F and 10 s. N = 5 mice. Insert: AUC of ΔF/F of dmPFC NE signals. (B) LC Ca2+ signals elicited by 2 s CS+ or 2 s CS+/28 s CS−. Scale bars, 2% ΔF/F and 10 s. N = 7 mice. Insert: AUC of ΔF/F of Ca2+ signals. Two-tailed unpaired t test, 2 s CS+/28 s CS− vs. 2 s CS+, P < 0.05. (C) Ca2+ signals in the LC TH+ neurons elicited by 2 s CS+ and 2 s CS+/28 s CS−. Scale bars, 2% ΔF/F and 10 s. N = 7 mice. Insert: AUC of ΔF/F of Ca2+ signals. Two-tailed unpaired t test, 2 s CS+/28 s CS− vs. 2 s CS+, P < 0.001. (D) Ca2+ signals elicited by 2 s CS+/28 s CS− and 2 s CS+ in the LC neurons receiving dmPFC projections. N = 7 mice, Two-tailed unpaired t test, 2 s CS+/28 s CS− vs. 2 s CS+, P < 0.01. (E) Ca2+ signals elicited by 2 s CS+/28 s CS− and 2 s CS+ in the LC neurons projecting to dmPFC. N = 7 mice, Two-tailed unpaired t test, 2 s CS+/28 s CS− vs. 2 s CS+, P < 0.01. (F) (Left) Sites of virus injections and optical fiber implantation. (Right) Freezing levels elicited by 30 s CS+, 2 s blue light stimulation followed by 28 s CS−. N = 5 mice, each group. (G) (Left) (Top) Experimental procedure for opto-stimulation. (Bottom) Normalized sEPSC frequency in the LC neurons to the sEPSCs during baseline period (period A). (Right) Representative traces of recorded EPSCs in the LC neurons during baseline (TeA stimulation only), during TeA + PFC stim and after stimulation (TeA stimulation only). Scale bars, 2 s and 20 pA. N = 6 cells/2 mice. (H) (Left) (Top) Experimental procedure for opto-stimulation. (Bottom) Normalized sEPSC frequency in the LC neurons to the sEPSC during baseline period (period A). (Right) Representative traces of recorded EPSCs in the LC neurons to opto-stimulation of TeA inputs, for the same durations as in (G). Scale bars, 2 s and 20 pA. N = 9 cells/2 mice. Numerical data can be found in S1 Data.
Fig 9
Fig 9. Summary on the neural circuit mediating the transition from memory retrieval to freezing behavior.
Presentation of CS+ activates LA neurons and TeA neurons. The activated LA neurons activate dmPFC T-neurons, which in turn activate dmPFC S-neurons and LC neurons. S-neurons receive inputs from TeA and send their outputs to BLA, which projects to PAG to enable freezing behavior. Activated LC neurons release NE in the dmPFC via their projections.

Similar articles

References

    1. Pavlov I. Conditional Reflexes: An Investigation of the Physiological Activity of the Cerebral Cortex. 1927. - PMC - PubMed
    1. Rescorla RA. Behavioral studies of Pavlovian conditioning. Annu Rev Neurosci. 1988;11:329–52. doi: 10.1146/annurev.ne.11.030188.001553 - DOI - PubMed
    1. Pearce JM, Bouton ME. Theories of associative learning in animals. Annu Rev Psychol. 2001;52:111–39. doi: 10.1146/annurev.psych.52.1.111 - DOI - PubMed
    1. Fanselow MS, Wassum KM. The origins and organization of vertebrate Pavlovian conditioning. Cold Spring Harb Perspect Biol. 2015;8(1):a021717. doi: 10.1101/cshperspect.a021717 - DOI - PMC - PubMed
    1. LeDoux JE. Emotion circuits in the brain. Annu Rev Neurosci. 2000;23:155–84. doi: 10.1146/annurev.neuro.23.1.155 - DOI - PubMed