. 2025 Aug 1;35(8):1781-1793.
doi: 10.1101/gr.279957.124.

Uncovering methylation-dependent genetic effects on regulatory element function in diverse genomes

Affiliations

Uncovering methylation-dependent genetic effects on regulatory element function in diverse genomes

Rachel M Petersen et al. Genome Res. .

Abstract

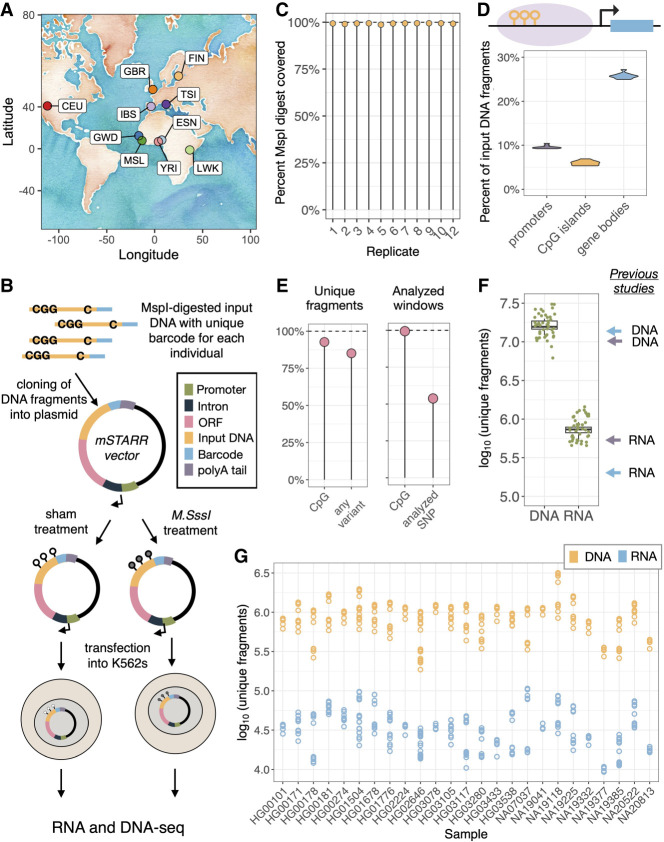
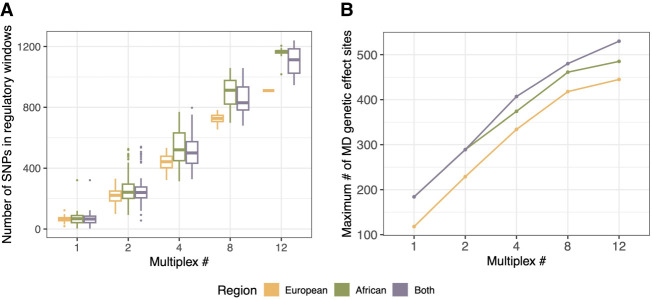
A major goal in evolutionary biology and biomedicine is to understand the complex interactions between genetic variants, the epigenome, and gene expression. However, the causal relationships between these factors remain poorly understood. mSTARR-seq, a methylation-sensitive massively parallel reporter assay, is capable of identifying methylation-dependent regulatory activity at many thousands of genomic regions simultaneously and allows for the testing of causal relationships between DNA methylation and gene expression on a region-by-region basis. Here, we develop a multiplexed mSTARR-seq protocol to assay naturally occurring human genetic variation from 25 individuals from 10 localities in Europe and Africa. We identify 6957 regulatory elements in either the unmethylated or methylated state, and this set was enriched for enhancer and promoter chromatin annotations, as expected. The expression of 58% of these regulatory elements is modulated by methylation, which is generally associated with decreased transcription. Within our set of regulatory elements, we use allele-specific expression analyses to identify 8020 sites with genetic effects on gene regulation; further, we find that 42.3% of these genetic effects vary in direction or magnitude between methylated and unmethylated states. Sites exhibiting methylation-dependent genetic effects are enriched for GWAS and EWAS annotations, implicating them in human disease. Compared with data sets that assay DNA from a single European ancestry individual, our multiplexed assay is able to uncover more genetic effects and methylation-dependent genetic effects, highlighting the importance of including diverse genomes in assays that aim to understand gene regulatory processes.


Figures

Figure 1.
Figure 1.
Multiplexed mSTARR-seq assays a diverse input library. (A) Sampling locations of the 25 individuals included in the assay: (CEU) Utah residents (CEPH); (ESN) Esan in Nigeria; (FIN) Finnish in Finland; (GBR) British in England and Scotland; (GWD) Gambian in Western Division in the Gambia; (IBS) Iberian population in Spain; (LWK) Luhya in Webuye, Kenya; (MSL) Mende in Sierra Leone; (TSI) Toscani in Italy; and (YRI) Yoruba in Ibadan, Nigeria. (B) Multiplexed mSTARR-seq design: Sample-specific barcodes are added to MspI-digested input DNA and inserted into the mSTARR vector downstream from a promoter, intron, and open reading frame (ORF). Plasmids are exposed to a methylation treatment or sham control and transfected into K562 cells and incubated for 48 h, and DNA and RNA are extracted and sequenced. (C) Percentage of an in silico MspI digest of the human genome that is represented in the DNA input of each replicate. (D) Percentage of input DNA fragments located within promoters, CpG islands, and gene bodies in each replicate (note these are not mutually exclusive annotations). (E) Percentage of unique DNA fragments that contain at least one CpG site and at least one SNP (left), and the percentage of analyzed windows (n = 525,074) that contain at least one CpG site and at least one analyzable SNP (i.e., biallelic, >0.05 MAF, and was called in our joint genotyping analysis; right). (F) Number of unique DNA and RNA fragments observed in each replicate; the mean number of fragments included in each replicate in Lea et al. (2018) (purple arrows) and Johnston et al. (2024) (blue arrows) is shown for comparison. (G) Number of unique DNA and RNA fragments included in each replicate from each of the 25 individuals included in the assay.
Figure 2.
Figure 2.
Multiplexed mSTARR-seq identifies regulatory and methylation-dependent (MD) regulatory activity. (A) Heuristic patterns of read pileups associated with the identification of regulatory activity and methylation dependence, with an example of the normalized read counts for a window falling into each of these categories. (B) Density of regulatory and nonregulatory windows (area under each curve normalized to one) in relation to the difference between normalized RNA and DNA counts for that window. (C) Fisher's exact test for enrichment in ChromHMM genomic annotations when comparing windows with regulatory activity (combined across conditions) versus nonregulatory windows. Bars above y = 0 indicate annotations that are overenriched in regulatory windows, and bars below y = 0 indicate annotations that are under enriched in regulatory windows; purple bars indicate enhancer and promoter annotations; and stars indicate significant over/underenrichment of that annotation type (for full results, see Supplemental Table S6). (D) Regulatory activity in the methylated versus unmethylated condition for MD windows colored by the logFC between conditions: 84.8% of MD windows have greater activity in the unmethylated condition, with the clustering of sites at x = 0 representing windows whose expression is entirely repressed by methylation. (E) Windows with MD regulatory activity have a greater number of CpG sites compared with regulatory windows that are not modulated by methylation.
Figure 3.
Figure 3.
Multiplexed mSTARR-seq identifies allele-specific regulatory activity that is modulated by methylation. (A) Patterns of read pileups associated with the identification of regulatory activity, ASE, and MD ASE. Reference alleles are indicated in blue; alternate alleles, in purple. (B) Density of tested sites with ASE versus without ASE in the unmethylated condition, with an example plot of each showing the regulatory activity (normalized DNA and RNA counts) and ASE (the ratio of reference allele to total counts, i.e., allelic imbalance) present in each replicate. (C) Fisher's exact test for enrichment in ChromHMM genomic annotations comparing ASE sites (combined across conditions) versus non-ASE sites. Bars above y = 0 indicate annotations that are overenriched in ASE sites, and bars below y = 0 indicate annotations that are underenriched in ASE sites; purple bars indicate enhancer annotations; orange bars indicate promoter annotations; and stars indicate significant (P < 0.05) over/underenrichment of that annotation type (for full results, see Supplemental Table S9). (D) The genetic effect in the methylated condition plotted against the genetic effect in unmethylated condition for ASE sites, with the 575 MD ASE sites highlighted in pink.
Figure 4.
Figure 4.
Insights into potential mechanisms involved in MD genetic effects. (A) One potential mechanism leading to MD genetic effects wherein TFs distinguish between alleles in one condition but not the other with an example site showing allelic imbalance (the ratio of reference allele to total counts) in the methylated versus unmethylated condition and a pie chart showing the percentage of MD genetic effect sites following this pattern. (B) Another potential mechanism leading to MD genetic effects wherein TFs bind to different alleles in alternate conditions with an example site and a pie chart showing the percentage of MD genetic effect sites following this pattern. (C) TF motifs that are enriched within ±200 bp of MD genetic sites that display increased ASE in the unmethylated condition (top) or methylated condition (bottom) colored by TF family. (D) Example of a MD genetic effect site that directly overlaps with a GWAS hit and is 60 bp away from an EWAS hit, which are associated with hemoglobin concentration and MetS, respectively. Created with bioRender (https://www.biorender.com/).
Figure 5.
Figure 5.
Multiplexing increases detection of MD genetic effects. (A) Number of variant sites located in regulatory regions that could potentially be tested for ASE when subset for different multiplexing regimes and samples originating from different geographical regions. (B) Maximum number of MD genetic effect sites that would have been present in our assay when subset for different multiplexing regimes and geographical regions.

Update of

Similar articles

References

    1. The 1000 Genomes Project Consortium. 2015. A global reference for human genetic variation. Nature 526: 68. 10.1038/nature15393 - DOI - PMC - PubMed
    1. Abell NS, DeGorter MK, Gloudemans MJ, Greenwald E, Smith KS, He Z, Montgomery SB. 2022. Multiple causal variants underlie genetic associations in humans. Science 375: 1247–1254. 10.1126/science.abj5117 - DOI - PMC - PubMed
    1. Anderson JA, Lin D, Lea AJ, Johnston RA, Voyles T, Akinyi MY, Archie EA, Alberts SC, Tung J. 2024. DNA methylation signatures of early-life adversity are exposure-dependent in wild baboons. Proc Natl Acad Sci 121: e2309469121. 10.1073/pnas.2309469121 - DOI - PMC - PubMed
    1. Arnold CD, Gerlach D, Stelzer C, Boryń ŁM, Rath M, Stark A. 2013. Genome-wide quantitative enhancer activity maps identified by STARR-seq. Science 339: 1074–1077. 10.1126/science.1232542 - DOI - PubMed
    1. Banovich NE, Lan X, McVicker G, Van de Geijn B, Degner JF, Blischak JD, Roux J, Pritchard JK, Gilad Y. 2014. Methylation QTLs are associated with coordinated changes in transcription factor binding, histone modifications, and gene expression levels. PLoS Genet 10: e1004663. 10.1371/journal.pgen.1004663 - DOI - PMC - PubMed

LinkOut - more resources