. 2025 Jul 14;16(1):6116.
doi: 10.1038/s41467-025-60337-9.

Paradoxical mTORC1-Dependent microRNA-mediated Translation Repression in the Nucleus Accumbens of Male Mice Consuming Alcohol Attenuates Glycolysis

Affiliations

Paradoxical mTORC1-Dependent microRNA-mediated Translation Repression in the Nucleus Accumbens of Male Mice Consuming Alcohol Attenuates Glycolysis

Yann Ehinger et al. Nat Commun. .

Abstract

mTORC1 promotes protein translation, learning and memory, and neuroadaptations that underlie alcohol use disorder (AUD). The mechanisms underlying alcohol-mediated mTORC1-dependent neuroadaptations that drive AUD are not well understood. We report that activation of mTORC1 in the nucleus accumbens (NAc) D1 neurons of male mice consuming alcohol results in paradoxical mTORC1-dependent repression of translation of transcripts, including Aldolase A, an essential enzyme in glycolysis. We further show that mTORC1-dependent Aldolase A translation repression in D1 neurons is mediated through upregulation of miR-34a-5p expression. Alcohol-mediated mTORC1 repression of Aldolase A translation in D1 neurons inhibits glycolysis in the NAc. Finally, we report that overexpression of miR-34a-5p in D1 NAc neurons increases, whereas systemic administration of L-lactate, the final product of glycolysis, attenuates excessive alcohol intake. Our data suggest that alcohol promotes paradoxical actions of mTORC1 on translation and glycolysis which in turn drive excessive alcohol use.


Conflict of interest statement

Competing interests: The authors declare no competing interests.

Figures
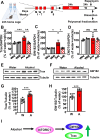
Fig. 1
Fig. 1. Alcohol via mTORC1 increases the translation of Trax and GW182 but not CNOT4 in the NAc.
A Mice underwent 7 weeks of IA20%2BC (Supplementary Table 1). Control animals had access to 2 water bottles. Three hours before the end of the last alcohol withdrawal period, mice were systemically injected with 20 mg/kg rapamycin or vehicle. The NAc was dissected from each of the four mouse groups (water+vehicle in white, water+rapamycin in gray, alcohol+vehicle in red, alcohol+rapamycin in red and hatched) at the end of the last alcohol withdrawal period, were subjected to polysomal fractionation and RT-qPCR analysis. Created in BioRender (2025) https://BioRender.com/uvam6j0. B–D Polysomal RNA levels of Trax (B), GW182 (C) and CNOT4 (D) were measured by RT-qPCR. Each data point represents an average of 3 technical replicates. Data are presented as the average ratio of each transcript to GAPDH ± SEM and expressed as % of water+vehicle. *p < 0.05, **p < 0.01, ***p < 0.001, ns: non-significant. n = 5 mice per group. Significance was determined using Two-way ANOVA followed by Tukey’s multiple comparisons test. (B) Alcohol x Rapamycin: F(1, 16) = 13.86, p = 0.0019, effect of Alcohol: F(1, 16) = 10.23, p = 0.0056, Effect of Rapamycin: F(1, 16) = 7.957, p = 0.0123; water and alcohol within the vehicle group, p = 0.0008, vehicle and rapamycin within the alcohol group, p = 0.0014. C Alcohol x Rapamycin: F(1, 16) = 6.541, p = 0.0211, effect of Alcohol: F(1, 16) = 5.84, p = 0.0280, Effect of Rapamycin: F(1, 16) = 5.224, p = 0.0363; water and alcohol within the vehicle group, p = 0.0137, vehicle and rapamycin within the alcohol group, p = 0.0165. (D) Alcohol x Rapamycin: F (1, 16) = 2.198, p = 0.1576, effect of Alcohol: F(1, 16) = 0.1552, p = 0.6989, Effect of Rapamycin: F(1, 16) = 0.0019, p = 0.9656. E–H A seperate cohort of mice underwent 7 weeks of IA20%2BC or water only. The NAc was dissected and Trax (E, G) and GW182 (F, H) protein levels were determined by western blot analysis. ImageJ was used for optical density quantification. Data are presented as the average ratio of Trax or GW182 to Tubulin±SEM and are expressed as % of water control. ***p < 0.001. n = 8 mice per group. Significance was determined using two-tailed unpaired t-tests. (G) t(14) = 4.354, p = 0.0007; (H) t(14) = 4.354, p = 0.0007. (I) Alcohol activates mTORC1 signaling in the NAc which in turn increases the translation of GW182 and Trax. Source data are provided as a Source Data file.
Fig. 2
Fig. 2. Alcohol via mTORC1 represses the translation of Aldolase A, PPM1E and Rbfox2 in the NAc.
Mice underwent 7 weeks of IA20%-2BC (Supplementary Table 1) and were treated with 20 mg/kg rapamycin as described above. A–C Polysomal mRNA levels of Aldolase A (A), PPM1E (B) and Rbfox2 (C). Each data point represents an average of 3 technical replicates. Data are presented as the average ratio of each transcript to GAPDH ± SEM and expressed as the % of water+vehicle. ***p < 0.001. n = 5 mice per group. Significance was determined using Two-way ANOVA followed by Tukey’s multiple comparisons test. A Alcohol x Rapamycin: F(1, 16) = 18.01, p = 0.0006, effect of Alcohol: F(1, 16) = 16.38, p = 0.0009, Effect of Rapamycin: F(1, 16) = 15.56, p = 0.0012; water and alcohol within the vehicle group, p = 0.0001, vehicle and rapamycin within the alcohol group, p = 0.0001. B Alcohol x Rapamycin: F(1, 16) = 12.86, p = 0.0025, effect of Alcohol: F(1, 16) = 10.51, p = 0.0051, Effect of Rapamycin: F(1, 16) = 19.13, p = 0.0005; water and alcohol within the vehicle group, p = 0.001, vehicle and rapamycin within the alcohol group, p = 0.0002. C Alcohol x Rapamycin: F(1, 16) = 27.39, p < 0.0001, effect of Alcohol: F(1, 16) = 18.9, p = 0.0005, Effect of Rapamycin: F(1, 16) = 11, p = 0.0044; water and alcohol within the vehicle group, p < 0.0001, vehicle and rapamycin within the alcohol group, p < 0.0001. D–I Aldolase A (D, G), PPM1E (E, H) and Rbfox2 (F, I) protein levels were determined by western blot analysis. Data are presented as the average ratio of Aldolase A, PPM1E and Rbfox2 to Tubulin±SEM and are expressed as the % of water control. *p < 0.05, ***p < 0.001. n = 8 mice per group. Significance was determined using two-tailed unpaired t-tests. G t(14) = 4.413, p = 0.0006; H t(14) = 5.426, p < 0.0001; I t(14) = 2.917, p = 0.0113. J Alcohol activates mTORC1 signaling in the NAc which in turn decreases the translation of Aldolase A, Rbfox2, PPM1E. Source data are provided as a Source Data file.
Fig. 3
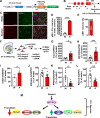
Fig. 3. Alcohol activates mTORC1, increases the translation of Trax, GW182 and CNOT, and decreases the translation of Aldolase A, PPM1E, Rbfox2 in NAc D1+ neurons.
A D1-Cre mice were crossed with RiboTag mice allowing the expression of RPL10-EGFP in D1-expressing neurons. B Mice underwent 7 weeks of IA20%2BC (Supplementary Table 1). Brains were dissected at the end of the last 24-hour withdrawal session as in Fig. 1A and processed for IHC or biochemical analysis. C IHC analysis of phospho-S6 levels in the NAc shell D1 neurons of drinking mice compared to water controls. Representative images of NAc at 20x magnification labeled with phospho-S6 in red, RPL10-GFP in green and NeuN in magenta. Scale bar 100 µm. D Phospho-S6 and D1 labeled neurons are expressed as % of water controls±SEM. ***p < 0.001. n = 3 mice per group. Significance was determined using two-tailed unpaired t-tests. t(4) = 27.29, p = <0.0001. E Percentage of D1 positive vs. D1 negative NAc shell neurons labeled as phosphoS6 positive neurons. F Affinity purification of ribosomes from D1+ neurons by using anti-GFP magnetic beads followed by RNA isolation and RT-qPCR. Image provided by Servier Medical Art (https://smart.servier.com/), licensed under CC BY 4.0 (https://creativecommons.org/licenses/by/4.0/). G–L Polysomal mRNA levels in D1+ neurons of Trax (G), GW182 (H), CNOT4 (I), Aldolase A (J), PPM1E (K), Rbfox2 (L) after alcohol withdrawal were determined by RT-qPCR. Each data point represents an average of 3 technical replicates. Data are presented as the average ratio of a transcript to GAPDH ± SEM and expressed as % of water control. *p < 0.05, **p < 0.01, ***p < 0.001. G, H, JL Water: n = 9, Alcohol: n = 10, n = 5 mice per group. Significance was determined using two-tailed unpaired t-tests. G t(17) = 4.042, p = 0.0008; H t(17) = 2.575, p = 0.0197; I t(8) = 2.322, p = 0.0488; J t(17) = 2.299, p = 0.0345; K t(17) = 3.425, p = 0.0032; L t(17) = 4.26, p = 0.0005. M Alcohol activates mTORC1 signaling in D1+ NAc neurons which in turn increases the translation of GW182, Trax and CNOT4 and represses the translation of Aldolase A, Rbfox2 and PPM1E. Source data are provided as a Source Data file.
Fig. 4
Fig. 4. Identification of miR-15b-5p, miR-25-3p, miR-92-3p and miR-34a-5p which are increased by alcohol in the NAc; Activation of mTORC1 is required for alcohol-mediated increase of miR-34a-5p expression.
A Potential miRNA-target interaction between miR-15b-5p, miR-25-3p, miR-92a-3p and miR-34a-5p the transcripts of interest: PPM1E, Aldolase A and Rbfox2. miRNA-target interactions were determined using miRWalk, TargetScan and miRDB. B Mice underwent 7 weeks of IA20%2BC or water only (Supplementary Table 1). Three hours before the end of the last 24 h of alcohol withdrawal, the NAc was removed and the expression of miR-15b-5p, miR-25-3p, miR-34a-5p and miR-92-3p, as well as miR-127-3p and miR-34a-3p, miR-122-5p, miR-15a-5p and miR-19b-3p were measured by RT-qPCR. Each data point represents an average of 3 technical replicates. Data are presented as individual data points and mean ± SEM. *p < 0.05, ***p < 0.001, ns: non-significant. n = 7 mice per group. Significance was determined using Two-way ANOVA followed by Sidak’s multiple comparisons test. Alcohol x miR: F (8, 110) = 3.994, p = 0.0003, effect of Alcohol: F(1, 110) = 33.14, p < 0.0001, Effect of miR: F(8, 110) = 2.428, p = 0.0187; miR15b-5p water vs. alcohol, p = 0.0147; miR 25-3p water vs. alcohol, p = 0.0402; miR 34a-5p water vs. alcohol, p = 0.0007; miR 92a-3p water vs. alcohol, p < 0.0001; miR 127-3p water vs. alcohol, p = 0.9977; miR 34a-3p water vs. alcohol, p > 0.9999; miR 122-5p water vs. alcohol, p = 0.9707; miR 15a-5p water vs. alcohol, p = 0.9998; miR 19b-3p water vs. alcohol, p = 0.6109. C, D Mice underwent 7 weeks of IA20%2BC or water only (Supplementary Table 1). Three hours before the end of the last 24 h of alcohol withdrawal session, mice that consumed alcohol (A) or water only (W) were injected with rapamycin (20 mg/kg) (R) or vehicle (V). The levels of miR-34a-5p (C) and miR-127-3p (D) were measured by RT-qPCR. Each data point represents an average of 3 technical replicates. Data are presented as individual data points and mean ± SEM. *p < 0.05, ns: non-significant. Water+Vehicle: n = 5 mice, Water+Rapamycin: n = 5 mice, Alcohol+vehicle: n = 5 mice, Alcohol+Rapamycin: n = 6 mice. Significance was determined using Two-way ANOVA followed by Sidak’s multiple comparisons test. C Alcohol x Rapamycin: F(1, 17) = 7.291, p = 0.0152, effect of Alcohol: F(1, 17) = 5.107, p = 0.0372, Effect of Rapamycin: F(1, 17) = 2.621, p = 0.1238; water and alcohol within the vehicle group, p = 0.0189, vehicle and rapamycin within the alcohol group, p = 0.0366. D Alcohol x Rapamycin: F(1, 17) = 0.01218, p = 0.9134, effect of Alcohol: F(1, 17) = 2.866, p = 0.1087, Effect of Rapamycin: F(1, 17) = 0.002773, p = 0.9586. E Alcohol increases the levels of miR-15b-5p, miR-25-3p, miR-92-3p and miR-34a-5p which are predicted to target the 3 transcripts shown in Fig. 3. Alcohol-mediated miR-34a-5p increase depends on mTORC1. Source data are provided as a Source Data file.
Fig. 5
Fig. 5. miR-34a-5p interacts with Aldolase A 3’UTR and represses Aldolase A levels in the NAc.
A Predicted interaction sites (in red) of miR-34a-5p sequence (top) and Aldolase A 3’UTR (middle). Mutated Aldolase 3’UTR is shown at the bottom. B Map of Aldolase A 3’UTR or mutant 3’UTR cloned into a luciferase reporter vector. C HEK293 cells were co-transfected with a reporter vector containing Aldolase A 3’UTR or mutant 3’UTR and miR-34a-5p or a negative control. Bar graph depicts average ± SD expressed as Firefly luminescence normalized to Renilla luminescence and relative to a reference control. Gray bars: Aldolase A or mutant Aldolase A. Hatched green bars: Aldolase A or mutant Aldolase A + miR-34a5p. Dotted blue bars: Aldolase A or mutant Aldolase A + miR control. **p < 0.01, ***p < 0.001, ns: non-significant. n = 4 independent experiments per group. Each data point represents an average of 3 technical replicates. Significance was determined using Two-way ANOVA followed by Tukey’s multiple comparisons test. miR x Aldolase A 3’UTR: F(2, 18) = 7.882, p = 0.0035, p = 0.0003, effect of Aldolase A 3’UTR: F(1, 18) = 3.144, p = 0.0931, Effect of miR: F(2, 18) = 34.75, p < 0.0001; Aldolase 3’UTR + miR34a-5p vs. Aldolase A 3’UTR + miR control, p < 0.0001; Aldolase A 3’UTR mutant + miR34a-5p vs. Aldolase A 3’UTR + miR34a-5p, p = 0.0053; Aldolase A 3’UTR + miR34a-5p vs. Aldolase A 3’UTR mutant + miR control, p < 0.0001. D Lenti-miR-34a-GFP infected NAc neurons. E, F miR-34a-5p or GFP was expressed in the NAc and Aldolase A protein level was evaluated by western blot analysis, quantified as a ratio of Aldolase A/GAPDH ± SEM and depicted as % of Aldolase A levels in the NAc of GFP infected mice. *p < 0.05. Water: n = 4 mice, Alcohol: n = 5 mice. Significance was determined using two-tailed Mann-Whitney test. F U = 0, p = 0.0159. Source data are provided as a Source Data file.
Fig. 6
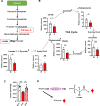
Fig. 6. Alcohol decreases TCA cycle metabolites, including lactate which depends on mTORC1.
A Aldolase A in the glycolysis pathway converts F1,6BP to G3P and DHAP. Lactate is the final product of glycolysis. B After 7 weeks of IA20%2BC (Supplementary Table 1) or water only, the NAc was dissected after 24 h of alcohol withdrawal and metabolite levels were measured. Data are presented as relative amount of individual metabolites in water vs. alcohol. Data are presented as individual data points and mean ± SEM. *p < 0.05, **p < 0.01, ns: non-significant. # metabolites that were not included in the panel. Water control: n = 6 mice, Alcohol withdrawal: n = 7 mice. Significance was determined using two-tailed Mann-Whitney test. Lactate U = 4, p = 0.0140; Citrate U = 6, p = 0.035; a-Ketogluturate U = 6, p = 0.035; Malate U = 3, p = 0.0082. C Mice underwent 7 weeks of IA20%2BC (Supplementary Table 1) or water only. Three hours before the end of the last alcohol withdrawal period, mice were systemically injected with 20 mg/kg rapamycin or vehicle. The NAc was dissected after 3 h, and lactate level was measured using a colorimetric assay. Data are presented as individual data points and mean ± SEM. Each data point represents an average of 3 technical replicates. **p < 0.01, ***p < 0.001. n = 6 mice per group. Significance was determined using One-way ANOVA followed by Tukey’s multiple comparisons test. F(2, 15) = 13.48, p = 0.0004. Water/vehicle vs alcohol/vehicle, p = 0.0005; alcohol/vehicle vs alcohol/rapamycin, p = 0.004. D Alcohol reduces TCA metabolites in the NAc and lactate which depends on mTORC1. Source data are provided as a Source Data file.
Fig. 7
Fig. 7. Overexpression of miR-34a in NAc D1 neurons increases alcohol consumption but does not affect locomotion or sucrose intake.
A Experimental timeline. Mice received a bilateral infusion of AAV2-Flex-miR-34a or AAV2-Flex-control in the NAc shell of D1-Cre mice. Three weeks after surgery, mice underwent 2 weeks of IA20%2BC followed by 2 weeks of water only and 2 weeks of IA1%Sucrose2BC. Mice were then subjected to the open field test. B The NAc of D1-Cre mice was infected with AAV2-Flex-control or AAV2-Flex-miR-34a-GFP. Three weeks later, mice underwent IA20%2BC, and alcohol consumption was measured daily for 6 sessions. Data are presented as mean ± SEM. *p < 0.05, **p < 0.01, ***p < 0.001. Control group: n = 10 mice, D1-specific miR-34a OE group: n = 9 mice. Significance was determined using Two-way ANOVA Mixed-effects followed by Sidak’s multiple comparisons test. miR34a-5p overexpression x Time: F (5, 84) = 1.036, p = 0.4017; miR34a-5p overexpression: F (1, 17) = 16.46, p = 0.0008; Time: F (5, 84) = 3.698, p = 0.0045. Session 1, p = 0.0037; Session 2, p < 0.0001; Session 3, p = 0.0578; Session 4, p = 0.0089; Session 5, p = 0.0277; Session 6, p = 0.061. C The NAc of D1-Cre mice was infected with AAV2-Flex-control or AAV2-Flex-miR-34a. Mice were placed in an open field and mice movement was recorded for 20 min. Locomotion is depicted in 1-minute bins. Data are presented as mean ± SEM. ns: non-significant. Control group: n = 10 mice, D1-specific miR-34a OE group: n = 9 mice. Significance was determined using Two-way ANOVA RM. miR34a-5p overexpression x Time: F(5, 85) = 0.3717, p = 0.8667; miR34a-5p overexpression: F(5, 85) = 0.3105, p = 0.5846; Time: F(5, 85) = 1.623, p = 0.1627. D AAV2-Flex-control or AAV2-Flex-miR-34a-GFP infected mice underwent 2 weeks of IA1%Sucrose2BC. Data are presented as mean ± SEM. ns: non-significant. Control group: n = 10 mice, D1-specific miR-34a OE group: n = 9 mice. Significance was determined using Two-way ANOVA RM. miR34a-5p overexpression x Time: F(19, 323) = 2.614, p = 0.0003; miR34a-5p overexpression: F(1, 17) = 1.148, p = 0.2990; Time: F(17, 323) = 10.58, p < 0.0001. Source data are provided as a Source Data file.
Fig. 8
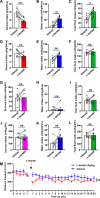
Fig. 8. Subcunenious administration of L-lactate attenuates alcohol consumption but does not affect locomotion or sucrose intake.
A–F Mice underwent 7 weeks of IA20%2BC (Supplementary Table 1). Mice received a single administration of L-lactate (s.c. 2 g/kg) or PBS on weeks 8th and 9th 30 min before the beginning of the 24 h alcohol drinking session in a counterbalanced manner. Alcohol and water were measured at the 4 h (A–C) and 24 h (D–F) time points. Data are presented as individual data points and mean ± SEM. **p < 0.01, ***p < 0.001, ns: non-significant. n = 9 mice per group. Significance was determined using two-tailed paired t-tests. A t(8) = 7.562, p = <0.0001; B t(8) = 5.917, p = 0.0004; C t(8) = 4.742, p = 0.0015; D t(8) = 2.004, p = 0.08; E t(8) = 2.352, p = 0.0509; F t(8) = 1.316, p = 0.2297. G–L Mice underwent 2 weeks of IA1%Sucrose2BC. Control animals had access to water only. On weeks 3 and 4, mice were s.c. injected with L-lactate (2 g/kg) or PBS in a counterbalanced manner 30 min before the beginning of a 24-hour drinking session. Sucrose and water intake were measured 4 h G–I and 24 h J–L later. Data are presented as individual data points and mean ± SEM. ns: nonsignificant. n = 9 mice per group. Significance was determined using two-tailed paired t-tests. G t(8) = 0.1349, p = 0.8960; H t(8) = 0.1971, p = 0.8482; I t(8) = 0.1370, p = 0.8944; J t(8) = 0.2076, p = 0.8402; K t(8) = 1.827, p = 0.1051; L t(8) = 0.4631, p = 0.6556. M Mice were habituated for 5 min in the open field apparatus. Mice were then injected s.c. with 2 g/kg L-lactate or PBS before being placed back in the open field and movement was recorded for an additional 20 min. Locomotion is depicted in 1-minute bins. Data are presented as mean ± SEM. ns: non-significant. n = 9 mice per group. Significance was determined using Two-way ANOVA RM. L-lactate x Time: F(19, 160) = 1.250, p = 0.2247; L-lactate: F(19, 160) = 0.9351, p = 0.5409; Time: F(1, 160) = 39.64, p < 0.0001. Source data are provided as a Source Data file.
Fig. 9
Fig. 9. Summary of results.
A Alcohol activates mTORC1 signaling in D1+ NAc neurons which in turn increases the translation of GW182, Trax and CNOT4 and represses the translation of Aldolase A, Rbfox2 and PPM1E. In parallel, alcohol increases the levels of miR-15b-5p, miR-25-3p, miR-92-3p and miR-34a-5p which are predicted to target Aldolase A, Rbfox2 and PPM1E. B Alcohol activates mTORC1 signaling in the NAc which increases the level of miR-34a-5p, repressing the translation of Aldolase A and decreasing the level of L-lactate, promoting further drinking. Created in BioRender (2025) https://BioRender.com/88rbr00.

Update of

Similar articles

References

    1. Liu, G. Y. & Sabatini, D. M. mTOR at the nexus of nutrition, growth, ageing and disease. Nat. Rev. Mol. Cell Biol.21, 183–203 (2020). - PMC - PubMed
    1. Napolitano, G., Di Malta, C. & Ballabio, A. Non-canonical mTORC1 signaling at the lysosome. Trends Cell Biol.32, 920–931 (2022). - PubMed
    1. Kim, J. & Guan, K. L. mTOR as a central hub of nutrient signalling and cell growth. Nat. Cell Biol.21, 63–71 (2019). - PubMed
    1. Santini, E., Huynh, T. N. & Klann, E. Mechanisms of translation control underlying long-lasting synaptic plasticity and the consolidation of long-term memory. Prog. Mol. Biol. Transl. Sci.122, 131–167 (2014). - PMC - PubMed
    1. Lipton, J. O. & Sahin, M. The neurology of mTOR. Neuron84, 275–291 (2014). - PMC - PubMed

MeSH terms

LinkOut - more resources