. 2025 Jul 14;16(1):5913.
doi: 10.1038/s41467-025-60251-0.

Stem and progenitor cell proliferation are independently regulated by cell type-specific cyclinD genes

Affiliations

Stem and progenitor cell proliferation are independently regulated by cell type-specific cyclinD genes

Mark E Lush et al. Nat Commun. .

Abstract

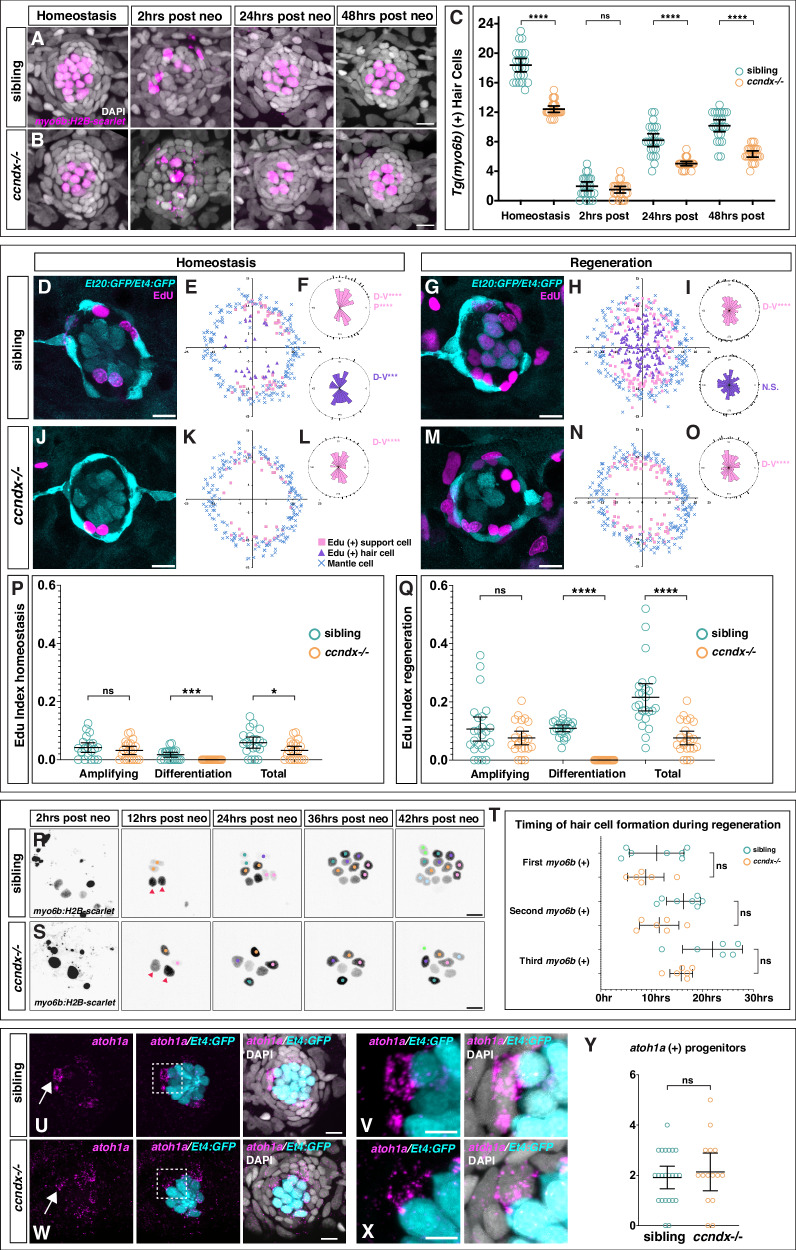
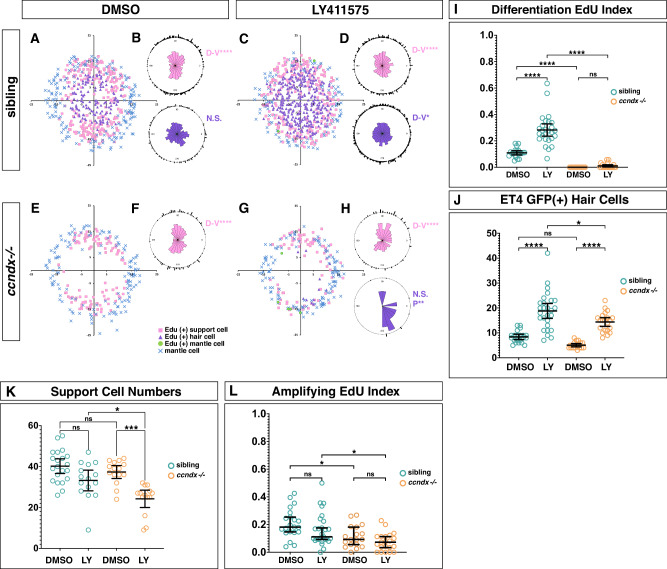
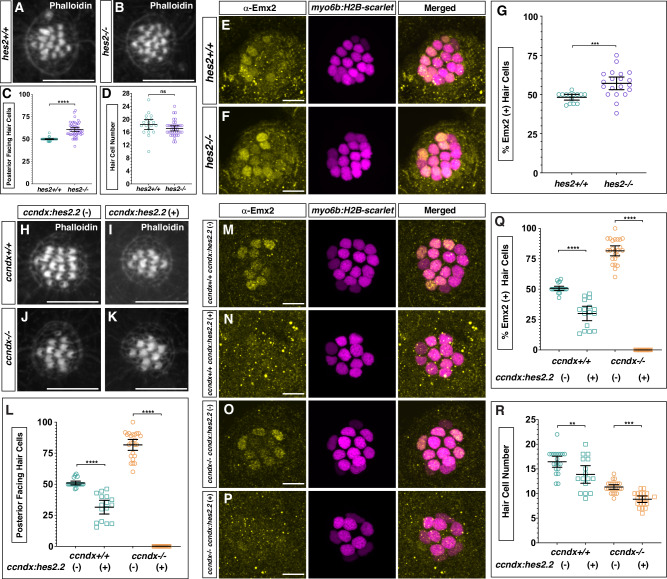
Regeneration and homeostatic turnover of solid tissues depend on the proliferation of symmetrically dividing adult stem cells, which either remain stem cells or differentiate based on their niche position. Here we demonstrate that in zebrafish lateral line sensory organs, stem and progenitor cell proliferation are independently regulated by two cyclinD genes. Loss of ccnd2a impairs stem cell proliferation during development, while loss of ccndx disrupts hair cell progenitor proliferation but allows normal differentiation. Notably, ccnd2a can functionally replace ccndx, indicating that the respective effects of these Cyclins on proliferation are due to cell type-specific expression. However, even though hair cell progenitors differentiate normally in ccndx mutants, they are mispolarized due to hes2 and Emx2 downregulation. Thus, regulated proliferation ensures that equal numbers of hair cells are polarized in opposite directions. Our study reveals cell type-specific roles for cyclinD genes in regulating the different populations of symmetrically dividing cells governing organ development and regeneration, with implications for regenerative medicine and disease.


Conflict of interest statement

Competing interests: The authors declare no competing interests.

Figures

Fig. 1
Fig. 1. ccndx and ccnd2a are dynamically expressed in different proliferating cells in the regenerating zebrafish lateral line.
A Representative image of a 5 dpf DAPI-stained zebrafish larva, posterior lateral line neuromast in boxed region. Scale bar = 200 µm. B Scanning electron micrograph of a 5 dpf zebrafish neuromast (dorsal view) with short stereocilia and long kinocilia in purple (adapted from Lush, M.E. and Piotrowski, T. (2014), Sensory hair cell regeneration in the zebrafish lateral line. Dev. Dyn., 243: 1187-1202. 10.1002/dvdy.24167”). C Transmission electron micrograph of a transverse section of a 5 dpf neuromast with hair cells in purple and mantle cells in blue. Additional support cells are unlabeled (adapted from Lush, M.E. and Piotrowski, T. (2014), Sensory hair cell regeneration in the zebrafish lateral line. Dev. Dyn., 243: 1187-1202. 10.1002/dvdy.24167”). Diagram of a neuromast showing a transverse section (D) and a dorsal view (E). Progenitor cells and hair cells are in purple, amplifying stem cells in the dorsal-ventral poles in pink and mantle cells in blue. F Integrated scRNA-seq UMAP plot of a neuromast regeneration time course (homeostasis, 0 min, 30 min, 1 h, 3 h, 5 h and 10 h after hair cell death; Baek et al., 2022). GJ scRNA-seq Feature Plots (Baek et al., 2022, https://piotrowskilab.shinyapps.io/neuromast_regeneration_scRNAseq_pub_2021/) illustrating gene-specific expression patterns. G pcna labels dividing, differentiating hair cell progenitors (purple arrow) and amplifying stem cells (pink arrow). H atoh1a is expressed in some central cells and marks the lineage from hair cell progenitors to hair cells (purple arrow). I ccndx is expressed in some central cells and along the hair cell lineage and is highest in progenitor cells undergoing differentiating divisions (purple arrow). J ccnd2a is more broadly expressed but is highest in the amplifying cell population (pink arrow) and absent from the hair cell lineage. K Heatmap of scaled gene expression across lateral line cell types during the averaged regeneration time course (Baek et al., 2022). L Heatmap of scaled gene expression during the regeneration time course. All genes are briefly upregulated at 0–30 min but show the largest activation between 3 − 10 h. atoh1a and ccndx show similar expression dynamics, whereas ccnd2a expression peaks slightly later. M Representative images of HCR in situ hybridization of ccndx (yellow) and ccnd2a (magenta) during the regeneration time course. Scale bar = 10 µm. Representative images of HCR in situ hybridization of ccndx (yellow) and atoh1a (magenta) during homeostasis (N) and 5 h after hair cell death (O). Scale bar = 10 µm.
Fig. 2
Fig. 2. In ccndx mutants hair cells regenerate through direct differentiation in the absence of proliferation.
Time course of hair cell regeneration in sibling (A) and ccndx−/− (B) at homeostasis and 2, 24 or 48 h after hair cell death. Hair cells are labeled by myo6b:H2B-mScarlet-I (magenta). Scale bar = 10 µm. C Hair cell counts in sibling and ccndx−/− at homeostasis and 2, 24 or 48 hrs after hair cell death. Circles represent individual neuromasts. Data are presented as mean values  + /− 95% confidence intervals. n = 24 for all. ns = not significant p = 0.99, ****p < 0.0001, Two-way Anova (genotype, condition) with Šidák multiple comparisons test. DF Sibling neuromast expressing sqEt4:GFP/sqEt20:GFP stained with EdU (magenta) after 5 − 6 dpf of homeostasis (D). Scale bar = 10 µm. Spatial analysis of multiple neuromasts showing EdU+ support cells (pink squares), EdU+ hair cells (purple triangles) and surrounding mantle cells (blue X’s, (E). F One-sided binomial analysis of position of EdU+ support cells (pink) and hair cells (purple). ****p < 0.00001, ***p < 0.0001. n = 21. Sibling neuromast 24 h after neomycin treatment expressing sqEt4:GFP/sqEt20:GFP and labeled with EdU (magenta) (G). Scale bar = 10 µm. Spatial analysis of multiple sibling regenerating neuromasts (H) and one-sided binomial analysis of EdU+ cell positions (I). **** p < 0.00001, ns = not significant, p = 0.27. n = 24. Jccndx−/− neuromast expressing sqEt4:GFP/sqEt20:GFP labeled with EdU (magenta) after 5 − 6 dpf of homeostasis (J). Scale bar = 10 µm. Spatial analysis of multiple ccndx−/− homeostatic neuromasts (K) and one-sided binomial analysis of EdU+ cell positions, ****p < 0.00001 (L). No EdU+ hair cells are present. n = 21. MO ccndx−/− neuromast 24 hrs after neomycin treatment expressing sqEt4:GFP/sqEt20:GFP and labeled with EdU (magenta) (M). Scale bar = 10 µm. Spatial analysis of multiple ccndx−/− regenerating neuromasts (N) and one-sided binomial analysis of EdU+ cell positions, ****p < 0.00001 (O). No EdU+ hair cells are present. n = 23. P EdU indexes of sibling and ccndx−/− amplifying, differentiation or total EdU+ cells during homeostasis. Data are presented as mean values  + /− 95% confidence intervals. N = 21 for sibling and ccndx−/−. ns = not significant p = 0.35, ***p = 0.0001, *p = 0.0223, two-tailed t-test. (Q) EdU indexes of sibling and ccndx−/− amplifying, differentiation and total EdU+ cells after 24 hrs of regeneration. Data are presented as mean values  + /− 95% confidence intervals. n = 24 for sibling and n = 23 for ccndx−/−. ns = not significant p = 0.19, ****p < 0.0001, two-tailed t-test. R Time-lapse analysis of regenerating sibling myo6b:H2B-mScarlet-I+ hair cells from 2 to 42 h after neomycin treatment. Red triangles point to hair cells that survived neomycin. Each new pair of hair cells is marked by differently colored dots. Scale bar = 10 µm. S Time-lapse analysis of regenerating ccndx−/− hair cells from 2 to 42 h after neomycin treatment. Red triangles point to hair cells that survived neomycin. Each new hair cell is marked by differently colored dots. T Quantification of the appearance of the first, second and third hair cell in sibling and ccndx−/− neuromasts over 30 h of regeneration. For siblings, the appearance of each new cell before division was counted. Data are presented as mean values  + /− 95% confidence intervals. n = 7 for sibling and n = 6 for ccndx−/−. ns = not significant, p = 1 for first, p = 0.29 for second and p = 0.62 for third myo6b(+) cells, Two-way Anova (genotype, time) with Šidák multiple comparisons test. U atoh1a HCR (magenta) and sqEt4:GFP+ (cyan) hair cells in 5 dpf sibling neuromasts. V A magnified atoh1a+/sqET4:GFP- progenitor cell from (U). Scale bar = 10 µm. W, X atoh1a HCR (magenta) and sqEt4:GFP+ (cyan) hair cells in 5 dpf ccndx−/− neuromasts. X A magnified atoh1a+/sqET4:GFP- progenitor cell from (W). Scale bar = 10 µm. Y Quantification of 5 dpf atoh1a+/sqET4:GFP progenitor cells showing no difference between sibling and ccndx−/−. Data are presented as mean values  + /− 95% confidence intervals. n = 23 for sibling and n = 15 for ccndx−/−. ns = not significant, p = 0.575, two-tailed t-test.
Fig. 3
Fig. 3. ccnd2a and ccndx are required for support cell and progenitor cell proliferation during development, respectively.
AF DAPI stained nuclei of neuromasts from sibling (A - C) or ccnd2a−/− (D - F) at 32, 48 or 72 hpf. Scale bar = 10 µm. G Quantification of total cell number from DAPI stained neuromasts in sibling and ccnd2a−/− at 32, 48 or 72 hpf. ns = not significant p = 0.98, ****p < 0.0001, Two-way Anova (genotype, condition) with Šidák multiple comparisons test. Data are presented as mean values  + /− 95% confidence intervals. n = 4 for 32 hpf sibling, n = 5 for 32 hpf ccnd2a−/−, n = 15 for 48 hpf sibling, n = 18 for 48 hpf ccnd2a-/, n = 16 for 72 hpf sibling and i = 16 for 72 hpf ccnd2a−/−. H Comparison of wildtype and ccnd2a−/− amplifying, differentiation or total EdU indexes between 2 − 3 dpf. ccnd2a−/− has reduced amplification and total EdU indexes. Data are presented as mean values  + /− 95% confidence intervals. ns = not significant p = 0.55, ***p = 0.0008, **p = 0.0016, two-tailed t-test. n = 16 for ccnd2a+/+ and n = 12 for ccnd2a−/−. Comparisons of wildtype and ccnd2a−/− support- (I) hair cell- (J) and total (K) cell numbers. ns = not significant p = 1 for (I) and p = 0.087 (K), ****p < 0.0001, Two-way Anova (genotype, condition) with Šidák multiple comparisons test. Data are presented as mean values  + /− 95% confidence intervals. n = 16 for 3dpf wildtype, n = 16 for 6dpf wildtype, n = 12 for 3dpf mutant and n = 20 for 6dpf mutant. L Comparison of sibling and ccndx−/− amplifying, differentiation or total EdU indexes between 2 − 3 dpf. Similarly to 5 − 6 dpf, ccndx−/− neuromasts show reduced differentiation and total EdU indexes and no change in the amplification index. Data are presented as mean values  + /− 95% confidence intervals. ns = not significant p = 0.25, ****p < 0.0001, *p = 0.0467, two-tailed t-test. n = 18 for both. MO Comparisons of sibling and ccndx−/− support-, hair cell- and total cell numbers. Data are presented as mean values  + /− 95% confidence intervals. ns=not significant p = 0.91, ****p < 0.0001, **p = 0.0019, Two-way Anova (genotype, condition) with Šidák multiple comparisons test. PS 5 dpf neuromasts from ccndx+/- (P, Q) or ccndx−/− (R, S) expressing sqEt4:GFP without or with ccnd2a-P2A-mScarlet-I driven by the ccndx promoter. Scale bar = 10 µm. T Quantification of sqEt4:GFP+ hair cells in ccndx+/- or ccndx−/− neuromasts at 5 dpf without or with ccnd2a-P2A-mScarlet-I. n = 12 for ccndx+/-/ccnd2a-P2A-mScarlet-I- and n = 16 for all other groups. Data are presented as mean values  + /− 95% confidence intervals. ns = not significant p = 0.11 and p = 1, ****p < 0.0001, Two-way Anova (genotype, condition) with Šidák multiple comparisons test.
Fig. 4
Fig. 4. Characterization of ccndx enhancer regions and negative regulation of ccndx expression by Notch signaling.
A UCSC zebrafish genome browser track showing two regions of conservation with the goldfish genome upstream of ccndx exon 1. The black bar indicates the 4.5 kb region cloned. B, C DAPI stained 32 hpf zebrafish larvae showing H2B-EGFP (cyan) expression in the hindbrain, spinal cord and migrating lateral line primordium driven by the ccndx upstream region with a higher magnification image of the primordium (C). Scale bars = 10 µm and 200 µm, respectively. D, E DAPI stained 5 dpf zebrafish showing H2B-EGFP (cyan) expression in the spinal cord and neuromasts driven by the ccndx upstream region with higher magnification view of a neuromast from a different larva (E). Scale bars =10 µm and 200 µm, respectively. ccndx HCR (yellow) in 5 dpf sibling (F) or atoh1a−/− neuromasts (G). sqEt4:EGFP expression (cyan) shows lack of hair cells in atoh1a−/− larvae. ccndx is expressed in atoh1a−/− neuromasts and shows a broader and more central expression pattern. Scale bar = 10 µm. HCR for ccndx (yellow) and atoh1a (magenta) in heat shocked sibling (H) and hs:atoh1a larvae (I). Scale bar = 10 µm. J ccndx HCR (yellow) in zebrafish expressing the tp1bglobin:egfp Notch reporter (cyan) showing the lack of co-localization. Scale bar = 10 µm. HCR for ccndx (yellow) and egfp (magenta) in ccndx:NLS-d2GFP (cyan) transgenic zebrafish treated with DMSO (K) or LY411575 (L) for 6 hrs. LY411575 treatment induces an increase in ccndx and egfp expression, especially in the central region. Scale bar = 10 µm.Maximum projection still images from time lapses of ccndx:NLS-d2EGFP transgenic zebrafish which were treated with DMSO (M) or LY411575 (N) immediately after neomycin treatment. There is an increase in the number of NLS-d2EGFP+ cells around 10 h after neomycin which decreases in DMSO treated fish but continues to increase with Notch inhibition. Scale bar = 10 µm. HCR for ccndx (yellow) in 5 dpf neuromasts in DMSO treated sibling (O) or atoh1a−/− (P) or LY411575 treated sibling (Q) or atoh1a−/− (R). Scale bar = 10 µm.
Fig. 5
Fig. 5. ccndx is required for the increased proliferation induced by Notch inhibition.
A Spatial analysis of EdU+ support cells and hair cells after 24 h of regeneration in control DMSO treated sibling neuromasts. B One-sided binomial analysis of EdU+ cell positions. n = 21. ****p < 0.00001, ns=not significant, p = 0.17. C Spatial analysis of EdU+ support cells and hair cells after 24 h of regeneration in LY411575 treated sibling neuromasts. D One-sided binomial analysis of EdU+ cell positions. n = 27. ****p < 0.00001, **p < 0.02. E Spatial analysis of EdU+ support cells and hair cells after 24 hrs of regeneration in control DMSO treated ccndx−/− neuromasts. F One-sided binomial analysis of EdU+ cell positions. There are no EdU+ hair cells in ccndx−/− neuromasts. n = 18. ****p < 0.00001. G Spatial analysis of EdU+ support cells and hair cells after 24 h of regeneration in LY411475 treated ccndx−/− neuromasts. H One-sided binomial analysis of EdU+ cell positions. There are few EdU+ hair cells in LY411575 treated ccndx−/− neuromasts. n = 21. ****p < 0.00001, **p < 0.006, ns=not significant, p = 0.11. I EdU index of differentiation divisions after DMSO and LY411575 (LY) treatment in sibling and ccndx−/− regenerating neuromasts. There is no significant difference in differentiating EdU indexes between DMSO or LY411575 treated ccndx−/− neuromasts. Data are presented as mean values  + /− 95% confidence intervals. ns = not significant p = 1, ****p < 0.0001, Two-way Anova (genotype, condition) with Šidák multiple comparisons test. n = 21 for DMSO sibling, n = 27 for LY411575 sibling, n = 18 for DMSO ccndx−/− and n = 21 for LY411575 ccndx−/−. J Quantification of sqEt4:EGFP+ hair cells in DMSO and LY411575 (LY) treated sibling or ccndx−/− neuromasts after 24 h of regeneration. LY411575 induces an increase in regenerated hair cells in both siblings and ccndx−/− neuromasts. ns = not significant p = 0.18, ****p < 0.0001, *p = 0.0113, Two-way Anova (genotype, condition) with Šidák multiple comparisons test. Data are presented as mean values  + /− 95% confidence intervals. n = 21 for DMSO sibling, n = 27 for LY411575 sibling, n = 18 for DMSO ccndx−/− and n = 21 for LY411575 ccndx−/−. K Quantification of support cell numbers in DMSO and LY411575 (LY) treated sibling or ccndx−/− neuromasts after 24 h of regeneration. LY411575 decreases support cells in both siblings and ccndx−/− neuromasts. Data are presented as mean values  + /− 95% confidence intervals. ns = not significant p = 0.067 and p = 0.84, *p < 0.024, ***p = 0.0007, Two-way Anova (genotype, condition) with Šidák multiple comparisons test. n = 21 for DMSO sibling, n = 27 for LY411575 sibling, n = 18 for DMSO ccndx−/− and n = 21 for LY411575 ccndx−/−. L EdU index of amplifying cells in DMSO and LY411575 (LY) treated sibling or ccndx−/− neuromasts after 24 h of regeneration. ns = not significant p = 0.46 and p = 0.78, *p < 0.018, Two-way Anova (genotype, condition) with Šidák multiple comparisons test. Data are presented as mean values  + /− 95% confidence intervals. n = 21 for DMSO sibling, n = 27 for LY411575 sibling, n = 18 for DMSO ccndx−/− and n = 21 for LY411575 ccndx−/−.
Fig. 6
Fig. 6. scRNA-seq of 5 dpf ccndx−/− neuromasts.
Phalloidin staining of sibling (A) and ccndx−/− (B) 5 dpf neuromasts. Scale bar = 10 µm. C Quantification of posterior-polarized hair cells per neuromast. Data are presented as mean values  + /− 95% confidence intervals. ****p < 0.0001, two-tailed t-test. n = 18 for sibling and n = 15 for ccndx−/−. Anti-Emx2 immunostaining (magenta) in 5 dpf sqEt4:EGFP (cyan) expressing sibling D and ccndx−/− neuromasts (E). Scale bar = 10 µm. F Quantification of the percentage of anti-Emx2+ hair cells per neuromast during homeostasis and at 24, 48 or 72 h after neomycin treatment. Data are presented as mean values  + /− 95% confidence intervals. **p = 0.006, ****p < 0.0001, Two-way Anova (genotype, condition) with Šidák multiple comparisons test. n = 30, n = 60, n = 55 and n = 58 for sibling at homeostasis, 24, 48 or 72 hpf respectively, n = 25, n = 61, n = 54 and n = 47 for ccndx−/− at homeostasis, 24, 48 or 72 hpf respectively. GJ Spatial analysis of Emx2+ or Emx2- hair cell nuclei cell position in sibling (G-H) and ccndx−/− (I-J) 72 h post neomycin treatment. H, J One-sided binomial analysis of Emx2+ hair cell positions, n = 18 for each group. K UMAP plot of integrated scRNA-seq datasets of 5 dpf sibling and ccndx−/− lateral line cells with neuromast cell types labeled. L Same UMAP plot as in (K) with sibling cells (cyan) or ccndx−/− cells (red) individually labeled showing a reduction in the number of dividing progenitor cells (arrows) in ccndx−/− larvae. M Dot plot showing percentage of hair cells that express a given known hair cell gene comparing sibling (cyan) and ccndx−/− (red) mature hair cell populations. Magnifications of scRNA-seq UMAP and Feature Plots of differentiating progenitor cells and young hair cells. Individual Feature Plots for atoh1a, hes2.2, and hey2 in sibling (N) and ccndx−/− (O). atoh1a is expressed in progenitor cells and young hair cells. hes2.2 is expressed in a subset of progenitor cells and is greatly reduced in ccndx−/− cells. hey2 expression in young hair cells is reduced in ccndx−/−. P Dot plot of mRNA expression levels of a subset of differentially expressed genes comparing sibling and ccndx−/− young hair cell populations. HCR for atoh1a (yellow) and hes2.2 (magenta) in a 5 dpf neuromast after DMSO (Q) or LY411575 (R) treatment showing co-expression within an individual progenitor cell. With cropped views of a single double-positive cell. Scale bar = 10 µm. Cropped image of hes2.2 Feature Plot from scRNA-Seq regenerating time-course from Baek et al.,2022 in progenitor cells (S) before emx2 expression (T) in young hair cells. Scale bar = 10 µm.
Fig. 7
Fig. 7. hes2 is required for proper hair cell polarity through regulation of Emx2.
Phalloidin staining of 5 dpf neuromasts from hes2+/+ (A) and hes2−/− (B) Scale bar = 10 µm. C Quantification of posterior facing hair cells per neuromast. Data are presented as mean values  + /− 95% confidence intervals. ****p < 0.0001, two-tailed t-test. n = 37 for hes2+/+ and n = 47 for hes2−/−. D Quantification of hair cell number in 5 dpf neuromasts from hes2+/+ and hes2−/−. Data are presented as mean values  + /− 95% confidence intervals. ns = not significant p = 0.12, two-tailed t-test. n = 19 for hes2+/+ and n = 37 for hes2−/−. Anti-Emx2 immunostaining (yellow) in myo6b:H2B-mScarlet-I (magenta) hes2+/+ (E) and hes2-/− (F) 5dpf neuromasts. Scale bar = 10 µm. G Quantification of the percentage of Emx2+ hair cells per neuromast at 5 dpf. Data are presented as mean values  + /− 95% confidence intervals. ***p = 0.0009, two-tailed t-test. n = 14 for hes2+/+ and n = 20 for hes2−/−. HK Phalloidin staining of 5 dpf neuromasts in control or ccndx:hes2.2 expressing, ccndx+/+ or ccndx−/−. Scale bar = 10 µm. L Quantification of posterior facing hair cells per neuromast. Data are presented as mean values  + /− 95% confidence intervals. ****p < 0.0001, Two-way Anova (genotype, condition) with Šidák multiple comparisons test. n = 20 for ccndx+/+/hes2-, n = 16 for ccndx+/+/hes2+, n = 24 for ccndx−/−/hes2- and n = 20 for ccndx−/−/hes2+. MP Anti-Emx2 immunostaining (yellow) in myo6b:H2B-scarlet (magenta) expressing ccndx+/+ or ccndx−/− neuromasts with or without ccndx:hes2.2 expression. Q Quantification of Emx2+ hair cells per neuromast in ccndx+/+ or ccndx−/− mutants with or without ccndx:hes2.2 expression. Data are presented as mean values  + /− 95% confidence intervals. ****p < 0.0001, Two-way Anova (genotype, condition) with Šidák multiple comparisons test. n = 20 for ccndx+/+/hes2-, n = 16 for ccndx+/+/hes2+, n = 24 for ccndx−/−/hes2- and n = 20 for ccndx−/−/hes2+. R Quantification of hair cell number in in ccndx+/+ or ccndx−/−mutants with or without ccndx:hes2.2 expression. Data are presented as mean values  + /− 95% confidence intervals. **p = 0.0024, ***p = 0.001, Two-way Anova (genotype, condition) with Šidák multiple comparisons test. n = 20 for ccndx+/+/hes2-, n = 16 for ccndx+/+/hes2+, n = 24 for ccndx−/−/hes2- and n = 20 for ccndx−/−/hes2+.

Update of

Similar articles

References

    1. Beumer, J. & Clevers, H. Hallmarks of stemness in mammalian tissues. Cell Stem Cell31, 7–24 (2024). - PMC - PubMed
    1. Doupe, D. P., Klein, A. M., Simons, B. D. & Jones, P. H. The ordered architecture of murine ear epidermis is maintained by progenitor cells with random fate. Dev. Cell18, 317–323 (2010). - PubMed
    1. Doupe, D. P. et al. A single progenitor population switches behavior to maintain and repair esophageal epithelium. Science337, 1091–1093 (2012). - PMC - PubMed
    1. Snippert, H. J. et al. Intestinal crypt homeostasis results from neutral competition between symmetrically dividing Lgr5 stem cells. Cell143, 134–144 (2010). - PubMed
    1. Lopez-Garcia, C., Klein, A. M., Simons, B. D. & Winton, D. J. Intestinal stem cell replacement follows a pattern of neutral drift. Science330, 822–825 (2010). - PubMed

LinkOut - more resources