. 2025 Jul 14;16(1):6416.
doi: 10.1038/s41467-025-61751-9.

Early identification of individuals at risk for multiple sclerosis by quantification of EBNA-1381-452-specific antibody titers

Affiliations

Early identification of individuals at risk for multiple sclerosis by quantification of EBNA-1381-452-specific antibody titers

Hannes Vietzen et al. Nat Commun. .

Abstract

Multiple sclerosis (MS) is an immune-mediated demyelinating disease. Epstein-Barr virus (EBV) encodes for the EBNA-1381-452 region that induces autoreactive antibody responses, which are likely critically involved in MS pathogenesis. Here we investigate whether these EBNA-1381-452-specific antibodies can serve as a biomarker to identify at-risk individuals for MS. We quantify EBNA-1381-452-specific antibody titers from 324 relapsing-remitting MS patients and 324 matched controls in longitudinal follow-up plasma samples, starting from the individual's EBV-seroconversion. In MS patients, significantly elevated EBNA-1381-452-specific IgG titers are identified that are increased already as early as nine months after EBV-seroconversion (OR:5.7; 95% CI: 4.1-8.1; P < 0.0001) and a median 5.4 years prior to MS diagnosis. Especially, the presence of continuously high EBNA-1381-452-specific antibody titers is associated with a more rapid MS diagnosis after EBV-seroconversion (P < 0.0001). Thus, the quantification of EBNA-1381-452-specific IgG antibody levels may provide a prognostic biomarker to determine the individual's risk for the diagnosis of MS.


Conflict of interest statement

Competing interests: The authors declare no competing interests.

Figures
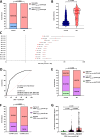
Fig. 1
Fig. 1. EBNA-1381-452-specific antibody titers are elevated in MS patients.
EBNA-1381-452-specific IgG titers were quantified in N = 704 MS patients and N = 5381 controls by ELISA. A Bars represent the number of MS patients and controls with detectable (OD ≥ 0.32) EBNA-1381-452-specific IgG antibody titers. Groups were compared using the two-sided Fisher’s exact test. B Violin plots represent the EBNA-1381-452-specific IgG antibody titers of EBNA-1381-452-specific IgG antibody seropositive MS patients (N = 689) and controls (N = 4189). Each data point represents one individual control or MS patient. Black lines indicate the median OD as well as the first and third quartiles. Dashed black lines indicate the cut-off for detection of EBNA-1381-452-specific IgG antibody (OD ≥ 0.32). Groups were compared using the two-sided Mann-Whitney Test. C Forest plot for the discrimination of MS patients and controls based on the EBNA-1381-452-specific IgG antibody titers. The number of MS patients (N = 704) and controls (N = 5381) with EBNA-1381-452-specific IgG antibody titers above the indicated cut-offs were compared using Fisher’s exact test. The individual OR (±95% CI) for each cut-off is shown. D Two-sided ROC analysis (not correct for multiple comparisons) to discriminate between EBNA-1381-452 IgG antibody seropositive MS patients (N = 689) and controls (N = 4189). E Distribution of MS patients and controls with high-level (OD ≥ 1.7), low level (OD ≤ 1.69 – ≥0.32), and absent (OD ≤ 0.31) EBNA-1381-452-specific antibody titers. Groups were compared using the Chi-square test. F, G EBNA-1381-452-specific IgG antibody titers are associated with axonal damage and MS disease severity. F Blots represent the number of MRI MS lesion in MS patients with high-level, low level, and absent EBNA-1381-452-specific antibody titers. Groups were compared using the Chi-square test. G Plasma NfL concentrations were quantified in N = 704 MS patients at the time point of MS diagnosis by SIMOA. Blots represent the mean plasma NfL concentrations in MS patients with high-level, low level, and absent EBNA-1381-452-specific antibody titers. Plasma NfL concentrations were compared between the groups using two-sided ANOVA and Dunn’s Post-Test. Source data are provided as a Source Data file. AUC: Area under the curve, EBNA-1: Epstein–Barr Virus Nuclear Antigen 1, MRI: Magnetic Resonance Imaging, MS: Multiple Sclerosis, NfL: Neurofilament Light Chain, OD: Optical Density. OR: Odds Ratio.
Fig. 2
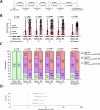
Fig. 2. EBNA-1381-452-specific IgG antibody titers are a biomarker for the future diagnosis of MS.
A Illustration of the included time points. EBNA-1381-452-specific IgG antibody titers were quantified from N = 324 MS patients and N = 324 controls at the time point of EBV seroconversion, median 8.9 months after EBV seroconversion (time point 1), median 17.8 months after EBV seroconversion (time point 2), median 26.9 months after EBV seroconversion (time point 3), median 36 months after EBV seroconversion (time point 4), and at the MS diagnosis or a matched time point for controls (median 97.2 months after EBV seroconversion). Created in BioRender. Vietzen, H. (https://BioRender.com/o5v1dep). (B) EBNA-1381-452-specific IgG antibody titers from individual MS patients (N = 324) and controls (N = 324) are shown for each individual time point. Boxes represent the mean EBNA-1381-452-specific IgG antibody titer for each individual time point. EBNA-1381-452-specific IgG antibody titers were compared between individual MS patients and controls for each individual time point using two-sided ANOVA and Dunn’s post-hoc test. C Distribution of high-level (OD ≥ 1.7), low level (OD ≤ 1.69 – ≥0.32), and absent (OD ≤ 0.31) EBNA-1381-452-specific IgG antibody titers is shown for each individual time point. The frequency of high-level, low level, and absent EBNA-1381-452-specific antibody titers was compared using the Chi-square test. D Forest plot for the discrimination of MS patients and controls based on the EBNA-1381-452-specific antibody titers: For each individual time point, the number of MS patients and controls with high-level EBNA-1381-452-specific antibody titers was compared to MS patients and controls with low-level and absent EBNA-1381-452-specific antibody titers (Fig. 2C) using the Fisher’s exact test. The individual ORs (±95% CI) for each comparison is shown Source data are provided as a Source Data file. EBNA-1: Epstein–Barr Virus Nuclear Antigen 1, EBV: Epstein-Barr virus, MS: Multiple Sclerosis, OR: Odds Ratio, T: Time point.
Fig. 3
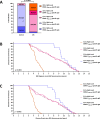
Fig. 3. Repeatedly high-level EBNA-1381-452-specific IgG antibody titers over time predict the diagnosis of MS.
EBNA-1381-452-specific IgG antibody titers from N = 324 MS patients and N = 324 controls were quantified at time point of EBV seroconversion, median 8.9 months after EBV seroconversion (time point 1), median 17.8 months after EBV seroconversion (time point 2), median 26.9 months after EBV seroconversion (time point 3), and median 36 months after EBV seroconversion (time point 4). The number of MS patients and controls with high-level EBNA-1381-452-specific IgG antibody titers (OD ≥ 1.7), was then assessed for time point 1, time point 2, time point 3 and time point 4. A Data are shown as the cumulative number of time points with high-level EBNA-1381-452-specific IgG antibody titers. Groups were compared using the Chi-square test. B The time point of MS diagnosis was compared to the cumulative numbers of time points with high-level EBNA-1381-452-specific IgG antibody titers using the two-sided Gehan-Breslow-Wilcoxon Test. C The time point of MS disease onset was compared to the cumulative numbers of time points with high-level EBNA-1381-452-specific IgG antibody titers using the two-sided Gehan-Breslow-Wilcoxon Test. EBNA-1: Epstein–Barr Virus Nuclear Antigen 1, EBV: Epstein-Barr virus, MS: Multiple Sclerosis, T: Time point.
Fig. 4
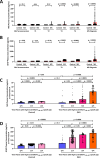
Fig. 4. EBNA-1381-452-specific IgG antibody titers increase before the axonal damage in MS patients.
EBNA-1381-452-specific IgG antibody titers, plasma NfL and plasma GFAP concentrations were quantified from N = 324 MS patients and N = 324 controls at the time point of EBV seroconversion, median 8.9 months after EBV seroconversion (time point 1), median 17.8 months after EBV seroconversion (time point 2), median 26.9 months after EBV seroconversion (time point 3), and median 36 months after EBV seroconversion (time point 4). Plasma (A) NfL and (B) GFAP concentrations from individual MS patients and controls are shown for each individual time point. Boxes represent the mean (A) NfL and (B) GFAP concentration for each individual time point. Plasma (A) NfL and (B) GFAP concentrations were compared between the groups using two-sided ANOVA and Dunn’s Post-Test. C, D Plasma (C) NfL and (D) GFAP concentrations were compared between controls and MS patients with 0/4, 1/4, 2/4, 3/4, and 4/4 time points with high-level (OD ≥ 1.7) EBNA-1381-452-specific IgG antibody titers using two-sided ANOVA and Dunn’s Post-Test. Source data are provided as a Source Data file.EBNA-1: Epstein–Barr Virus Nuclear Antigen 1, EBV: Epstein-Barr virus, GFAP: Glial Fibrillary Acidic Protein, MS: Multiple Sclerosis, NfL: Neurofilament Light Chain, T: Time point.

References

    1. Reich, D. S., Lucchinetti, C. F. & Calabresi, P. A. Multiple sclerosis. N. Engl. J. Med378, 169–180 (2018). - PMC - PubMed
    1. Walton, C. et al. Rising prevalence of multiple sclerosis worldwide: insights from the Atlas of MS, third edition. Mult. Scler.26, 1816–1821 (2020). - PMC - PubMed
    1. Bjornevik, K. et al. Longitudinal analysis reveals high prevalence of Epstein-Barr virus associated with multiple sclerosis. Sci. (N. Y., NY)375, 296–301 (2022). - PubMed
    1. Ascherio, A. et al. Epstein-Barr virus antibodies and risk of multiple sclerosis: a prospective study. Jama286, 3083–3088 (2001). - PubMed
    1. Cortese, M. et al. Serologic response to the Epstein-Barr virus peptidome and the risk for multiple sclerosis. JAMA Neurol.81, 515–524 (2024). - PMC - PubMed

MeSH terms

LinkOut - more resources