. 2025 Jul 14;16(1):6496.
doi: 10.1038/s41467-025-61846-3.

Quantitative phase imaging with temporal kinetics predicts hematopoietic stem cell diversity

Affiliations

Quantitative phase imaging with temporal kinetics predicts hematopoietic stem cell diversity

Takao Yogo et al. Nat Commun. .

Abstract

Innovative identification technologies for hematopoietic stem cells (HSCs) have expanded the scope of stem cell biology. Clinically, the functional quality of HSCs critically influences the safety and therapeutic efficacy of stem cell therapies. However, most analytical techniques capture only a single snapshot, disregarding the temporal context. A comprehensive understanding of the temporal heterogeneity of HSCs necessitates live-cell, real-time and non-invasive analysis. Here, we developed a prediction system for HSC diversity by integrating single-HSC ex vivo expansion technology with quantitative phase imaging (QPI)-driven machine learning. By analyzing the cellular kinetics of individual HSCs, we discovered previously undetectable diversity that snapshot analysis cannot resolve. The QPI-driven algorithm quantitatively evaluates stemness at the single-cell level and leverages temporal information to significantly improve prediction accuracy. This platform advances the field from snapshot-based identification of HSCs to dynamic, time-resolved prediction of their functional quality based on past cellular kinetics.


Conflict of interest statement

Competing interests: The authors declare no competing interests.

Figures
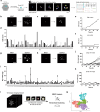
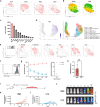
Fig. 1
Fig. 1. Quantitative phase imaging-based single-cell kinetic analysis of expanded HSCs.
a Protocol for analyzing single HSC time-lapse quantitative phase imaging (QPI). CD34-CD201+CD150+KSL cells were isolated from fresh mouse bone marrow and cultured ex vivo for 7 days. Subsequently, a single CD48-CD150+CD201+KSL ex vivo expanded HSC was isolated and monitored using time-lapse QPI for 96 h. Data represent n = 2 independent biological experiments. b, c Representative images of HSCs that underwent rapid or slow divisions over 96 h. Scale bar: 100 μm. d Number of cells produced by each HSC after 96 h of expansion, derived from experiments conducted following the protocol described in (a). Each ID represents a single HSC clone (n = 64). Source data are provided as a Source Data file. e, f Representative proliferation patterns of HSCs that underwent rapid or slow divisions over 96 h. Source data are provided as a Source Data file. g, h Representative images of HSCs that produce cells with high or low dry mass. i Dry mass of cells produced by each HSC after 96 h of culture, derived from experiments conducted following the protocol described in (a). Each ID represents a single HSC clone (n = 64). Source data are provided as a Source Data file. j, k Representative dry mass dynamics of HSCs that produce either high- or low-mass cells. Source data are provided as a Source Data file. l Protocol for classifying cells based on kinetic features derived from QPI data. Fifty CD34-CD201+CD150+KSL cells were isolated from fresh mouse bone marrow. Subsequently, each HSC was tracked for 36 h, yielding a total of 11,512 cell images. From these images, 11 kinetic parameters (Dry Mass, Sphericity, Velocity, Volume, Mean Thickness, Perimeter, Radius, Area, Length, Width and Length/Width Ratio) were extracted using the Cell Analysis Toolbox within the Livecyte platform, followed by Uniform Manifold Approximation and Projection (UMAP) analysis and hierarchical clustering. Data represent n = 3 independent biological experiments. m UMAP analysis of expanded HSCs based on kinetic features obtained by QPI, colored by hierarchical clustering, derived from experiments conducted following the protocol described in (l). Source data are provided as a Source Data file.
Fig. 2
Fig. 2. Hlf marks functional HSCs during ex vivo expansion.
a t-distributed stochastic neighbor embedding (tSNE) analysis of ex vivo expanded HSCs based on Fluorescence Activated Cell Sorter (FACS) data (CD201, CD48, CD150, cKit, Sca1, Lin). FACS data from three independent experiments were integrated for the analysis. b tSNE of expanded HSCs, overlaid with CD201 and CD48 markers. Data from three independent experiments were integrated for this analysis. c RNA-seq profiles of selected HSC-associated genes in CD48-CD201+CD150+KSL cells (n = 3). Data reanalyzed from previously published source. Error bars represent standard deviation (SD). Mean of n = 3 independent cultures. Source data are provided as a Source Data file. d UMAP of single-cell RNA-seq data from 7-day expanded HSCs with 10 clusters and Hlf expression. e tSNE analysis of ex vivo expanded HSCs from Hlf-tdTomato mice. FACS data from days 1, 3, and 5 were integrated. Left: gating for high, middle, and low Hlf-tdTomato populations. Right: populations highlighted across expansion days. Data from n = 3 independent experiments were integrated. f Gating strategy for Hlf-tdTomato high and low expanded HSCs. g Mean donor peripheral blood chimerism in primary (n = 4, 5 mice per group) and secondary recipients (n = 3–5 mice per group). Source data are provided as a Source Data file. h Mean donor bone marrow chimerism in primary recipients (n = 4 mice in Hlf-tdTomatohigh group, n = 5 in Hlf-tdTomatolow group). Error bars represent SD. Two-sided t-test, **P = 0.0025. Source data are provided as a Source Data file. i Schematic of hematopoietic dynamics following transplantation of expanded HSCs, classified by Hlf-tdTomato expression using AkaBLI. Luminescence recorded on day 9–28 post-transplantation. Experiments were conducted with n = 5 mice per group. j Representative IVIS images from the Hlf-tdTomato high/low Akaluc+ HSC transplantation. k, l Dynamics of total average luminescence intensity after transplantation of Hlf-tdTomato high/low expanded HSCs, derived from experiments conducted following the protocol described in (i). Experiments were conducted with n = 5 mice per group. All individual IVIS imaging data are presented in Supplementary Fig. 4h. Source data are provided as a Source Data file.
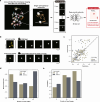
Fig. 3
Fig. 3. Predicting Hlf expression levels from cellular kinetic features.
a Protocol for classifying cells based on kinetic features derived from QPI data. Fifty Hlf-tdTomao+CD34- CD150+KSL cells were isolated from fresh mouse bone marrow. Subsequently, each HSC was tracked for 36 h, yielding a total of 11,876 cell images. From these images, 11 kinetic parameters (Dry Mass, Sphericity, Velocity, Volume, Mean Thickness, Perimeter, Radius, Area, Length, Width and Length/Width Ratio) were extracted, followed by UMAP analysis and hierarchical clustering, and an overlay of Hlf-tdTomato expression levels based on fluorescence imaging. Data represent n = 3 independent biological experiments. b UMAP plot of expanded HSCs based on kinetic features, overlaid with Hlf-tdTomato expression level. Representative images of clusters are shown on the plot. derived from experiments conducted following the protocol described in (a). Source data are provided as a Source Data file. c UMAP plot colored by hierarchical clustering, derived from experiments conducted following the protocol described in (a). Source data are provided as a Source Data file. d Mean red intensity of each cluster, derived from experiments conducted following the protocol described in (a). This result was validated using other data sets (Supplementary Fig. 5c,d). Source data are provided as a Source Data file. e Violin plot comparing dry mass, sphericity, and velocity among Hlf-tdTomato high, middle, and low expanded HSCs. Hlf-tdTomato⁺ CD34⁻ CD150⁺KSL cells were isolated from fresh mouse bone marrow. After 7 days of ex vivo expansion, cells were sorted from the CD201⁺CD150⁺CD48⁻KSL fraction into Hlf-tdTomato high, middle, and low populations based on the histogram shown on the left, with 100 cells per group. Twenty-four hours after sorting, QPI was performed to extract kinetic features. Data represent n = 3 independent biological experiments. The median is indicated by bold dotted lines, and the quartiles by thin dotted lines. Statistical significance was assessed using one-way ANOVA with Tukey’s post-test (****P < 0.0001). Source data are provided as a Source Data file.
Fig. 4
Fig. 4. Single HSC kinetics analysis with Hlf-tdTomato dynamics.
a Protocol for analyzing single HSC time-lapse quantitative phase imaging. Fresh HSCs from Hlf-tdTomato reporter mouse bone marrow were cultured ex vivo for 7 days. Subsequently, a single CD48-CD150+CD201+KSL ex vivo expanded HSC was isolated and monitored using time-lapse QPI for 96 h. Cellular kinetics were then quantified using the Cell Analysis Toolbox within the Livecyte platform. Data represent n = 2 independent biological experiments. b Red mean fluorescence intensity of each cell produced after 96 h, derived from experiments conducted following the protocol described in (a). Each ID represents a single HSC clone (n = 63). Source data are provided as a Source Data file. ce Representative images of single sorted HSCs (input) and their produced cells (output) over 96 h. Scale bar: 100 μm. Hlf-tdTomato expression shown as red overlay. Representative dynamics of HSCs that maintained high Hlf-tdTomato levels and divided slowly (f, i), decreased Hlf-tdTomato levels and proliferated rapidly (g, j), or maintained Hlf-tdTomato levels but did not proliferate (h, k). Source data are provided as a Source Data file. l Correlation between the CD150 level of sorted single HSCs and the cell count after 96 h, derived from experiments conducted following the protocol described in (a). Simple linear regression (blue line) and 95% CI (black lines). Source data are provided as a Source Data file. m Correlation between the Hlf-tdTomato level of sorted single HSCs and the cell count after 96 h, derived from experiments conducted following the protocol described in (a). Simple linear regression (blue line) and 95% CI (black lines). Source data are provided as a Source Data file. n Correlation between the Hlf-tdTomato level of sorted single HSCs and the average Hlf-tdTomato level of produced cells after 96 h, derived from experiments conducted following the protocol described in (a). Simple linear regression (blue line) and 95% CI (black lines). o Correlation between the cell count and the average Hlf-tdTomato level of produced cells after 96 h, derived from experiments conducted following the protocol described in (a). Simple linear regression (blue line) and 95% CI (black lines).
Fig. 5
Fig. 5. QPI-driven machine learning prediction of Hlf expression levels.
a Protocol for QPI-driven machine learning to predict the Hlf-tdTomato level of live HSCs. Fifty Hlf-tdTomato⁺ CD34⁻ CD150⁺KSL cells were isolated from fresh mouse bone marrow. Subsequently, each HSC was tracked using QPI for 60 h; time-lapse imaging was performed every 4 min and 21 s. Individual cells were tracked, and their trajectories were extracted to generate a dataset matching video data of each cell from frame 1 to frame n with the corresponding Hlf-tdTomato intensity in the final frame (frame n). 3D Residual Neural Network (ResNet) was used on this training dataset. Dataset consists of videos from n = 3 independent biological datasets for training, and a separate, independent dataset was used for validation. b Illustration of representative datasets with fixed field-of-view images (above) and images centered on cell position (below). c QPI-driven machine learning with and without cell motility, comparing predicted Hlf-tdTomato expression levels (x-axis) and measured Hlf-tdTomato levels (y-axis). d Mean squared error of Hlf-tdTomato predictions with and without cell motility using 5, 10, and 20 input images. Source data are provided as a Source Data file. e Correlation coefficient of Hlf-tdTomato predictions with and without cell motility using 5, 10, and 20 input images. Source data are provided as a Source Data file.

References

    1. TILL, J. E. & McCULLOCH, E. A. A direct measurement of the radiation sensitivity of normal mouse bone marrow cells. Radiat. Res.14, 213–222 (1961). - PubMed
    1. Visserc, J. W. M., Bauman, J. G. J., Mulder, A. H., Euason, J. F. & De Leeuw, A. M. Isolation of murine pluripotent hemopoietic stem cells. J. Exp. Med.159, 1576–1590 (1984). - PMC - PubMed
    1. Spangrude, G. J., Heimfeld, S. & Weissman, I. L. Purification and characterization of mouse hematopoietic stem cells. Science241, 58–62 (1988). - PubMed
    1. Morrison, S. J. & Weissman, I. L. The long-term repopulating subset of hematopoietic stem cells is deterministic and isolatable by phenotype. Immunity1, 661–673 (1994). - PubMed
    1. Osawa, M., Hanada, K. I., Hamada, H. & Nakauchi, H. Long-term lymphohematopoietic reconstitution by a single CD34- low/negative hematopoietic stem cell. Science273, 242–245 (1996). - PubMed