. 2025 Jul 14;16(1):6477.
doi: 10.1038/s41467-025-61688-z.

Boosting RNA nanotherapeutics with V-ATPase activating non-inflammatory lipid nanoparticles to treat chronic lung injury

Affiliations

Boosting RNA nanotherapeutics with V-ATPase activating non-inflammatory lipid nanoparticles to treat chronic lung injury

Zhiqiang Zhao et al. Nat Commun. .

Abstract

Lipid nanoparticles (LNPs) are a promising platform for mRNA delivery. However, their use in inflammatory pulmonary diseases is limited by reactogenicity and suboptimal delivery. Here we develop a non-inflammatory LNP (NIF-LNP) by incorporating ursolic acid, identified from a natural product library, into a biodegradable, cationic phosphoramide-derived LNP formulation. NIF-LNPs exhibit a 40-fold enhancement in lung protein expression without causing significant reactogenicity compared to LNPs containing ALC-0315. Our CRISPR-KO mechanistic studies uncover that ursolic acid promote endosome acidification by activating the V-ATPase complex, acting as a central hub for endosomal trafficking of LNPs and inflammation control. Furthermore, we identify an intracellular circadian regulatory gene, NR1D1, encapsulated in NIF-LNPs, showing notable therapeutic efficacy in bronchopulmonary dysplasia and lung fibrosis. To enhance clinical feasibility, we have developed a lyophilized formulation that maintains stability for over 90 days and ensures efficient nebulization in preclinical male mouse, pup rat, and male dog models. Overall, this V-ATPase-activating atomized NIF-LNP presents a viable strategy for treating variable chronic inflammatory lung diseases.


Conflict of interest statement

Competing interests: L.M., Z.Q.Z. and X.Z.S. have filed a patent for the development of the described NIF LNPs. The remaining authors declare no competing interests.

Figures
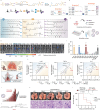
Fig. 1
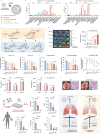
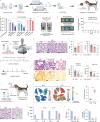
Fig. 1. Development of phosphoramide lipid (PL) library for lung targeting RNA delivery and their inflammation evaluation.
a Schematic of phosphorus oxychloride-mediated multicomponent reactions (PMR) in the synthesis of PLs. RT: Room temperature. b, c Structures of the three components of PLs used in the synthesis library and the screening process. d Preparation of PL LNPs by a microfluidic device. e Expression of mLuc at 6 h after intratracheal administration of the PL LNPs, the original MC3, ALC-0315, or cKK-E12 LNPs (0.2 mg/kg, n = 3 mice, one representative mouse in each group were shown). f Quantification of (e). g Schematic illustration of lipid nanoparticle (LNP) induced lung inflammation and collection of bronchoalveolar lavage (BAL). h Correlation analysis between cytokine secretion and mLuc expression after intratracheal administration of the PL LNPs. Measurement of IL-1β, IL-6, and TNF-α concentration were conducted using ELISA assay in BAL collected at 24 h after intratracheal administration of the PL LNPs (n = 3 mice in each group, mean values were presented). i Schematic shows the positive correlation of cytokine concentration and luciferase expression. j Chemical structure of PL32. k Gross anatomical images and H&E staining of lungs from healthy mice and ALI mice intratracheally instilled with PBS or single dose 0.6 mg/kg of mLuc in MC3 LNPs, ALC-0315 LNPs, and PL32 LNPs. n = 3 mice per group with similar results. Scale bar, 100 μm. Arrows indicate the areas of hepatization and inflammation. l Survival curve of bleomycin induced pulmonary fibrosis mice after two doses of mLuc LNPs treatment (0.6 mg/kg, n = 8 mice in each group). Data were represented as mean ± SEM. Figure (a, c, d, g, i, l) were created in BioRender. com with attribution line Miao, L. (2025) https://BioRender.com/p99f207, Miao, L. (2025) https://BioRender.com/a31ebmk, Miao, L. (2025) https://BioRender.com/g9lq68b, Miao, L. (2025) https://BioRender.com/kfsouj6, Miao, L. (2025) https://BioRender.com/v99qgqe and Miao, L. (2025) https://BioRender.com/qrqgh2s, respectively. Source data are provided as a Source Data file.
Fig. 2
Fig. 2. Construction of NIF LNPs with improved mRNA transfection efficiency.
a Adding NAIPs in PL32 LNPs to prepare non-inflammatory NAIP LNPs. b In vitro expression of mLuc delivered by NAIP-LNPs formulations in A549 cells. 24 hours after incubation with mLuc LNPs, the expression was measured using a BioTek plate reader (n = 3 biologically independent wells). c Chemical structures of the lead candidate NAIPs. d Expression of mLuc 6 h after intratracheal administration of the representative NAIP-LNPs and the original PL32 LNPs (0.2 mg/kg, n = 4 mice). Lung tissues were lysed, and luminescence was detected using a BioTek plate-reader. The quantification of the mLuc expression was presented on the right in (e), P-CAL: PL32 with calycosin; P-OA: PL32 with oleanolic acid; P-AA: PL32 with asiatic acid; P-UA: PL32 with ursolic acid, (n = 4 mice). f Relative mRNA expression of Il-1β and Cxcl1 in lung tissues of (d) (n = 3 mice). g Quantification of neutrophils, macrophages, and M1-/M2-macrophages by flow cytometry analysis in previous lung tissues of (d) (n = 3 mice). h, i Inflammatory cytokines levels of BAL in idiopathic pulmonary fibrosis (IPF) and acute lung injury (ALI) mice intratracheally instilled with PL32 LNPs and P-UA LNPs for 24 h (0.6 mg/kg, n = 3 mice per group). j Anatomical inspection and H&E stain of lung tissues. Scale bar, 100 μm. k Detection of inflammatory cytokines in human peripheral blood mononuclear cells (PBMCs) treated with PL32 LNPs and P-UA LNPs for 24 h by Cytometric Bead Array (CBA) - I Kit (n = 3 independent wells). l Schematic illustration of mRNA expression and inflammation in lung after administration of non-inflammatory P-UA LNPs and traditional PL32 LNPs. Data were represented as mean ± SEM. Statistical significance was calculated through two-tailed unpaired Student’s t-test. (h, i) One-way ANOVA with Dunnett test (eg), and One-way ANOVA with Tukey’s test (b, k). Figure 2a, k, l were created in BioRender. com with attribution line Miao, L. (2025) https://BioRender.com/4tk9uu8, Miao, L. (2025) https://BioRender.com/7t6a86q Miao, L. (2025) and Miao, L. (2025) https://BioRender.com/9bx34ve), respectively. Source data are provided as a Source Data file.
Fig. 3
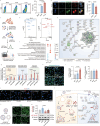
Fig. 3. NIF LNPs improve mRNA expression and reduce inflammatory injury by activating V-ATPase.
a Cellular uptake of Cy3-labeled PL32 and P-UA LNPs analyzed by flow cytometry (n = 3 wells). b Confocal images of intracellular distribution of LNPs in A549 cells. Three-time repeats with similar results. Scale bar, 20 μm. c Schematics of genome-wide CRISPR knockout (KO) screen method. d Hits of the top 10 gRNAs enriched in the GFP-low population in PL32 and P-UA LNPs. e String-based protein interaction based on top 50 gRNAs enriched in the GFP-low population of P-UA LNPs. f Gene Ontology (GO) analysis of gRNAs in GFP-low population of P-UA LNP, p.adjust is calculated using Benjamini-Hochberg method. g Decreased folds of mLuc expression in major gene knockdown cell lines (n = 3 wells). h Endosomal acidity measured by lysotracker in different groups. A549 cells were treated with 200 ng of mLuc LNPs for 2 h. The relative fluorescence intensities from 3 parallel tests were quantified. Scale bar, 20 μm. i V-ATPase activity and concentration evaluation in purified endosomes treated with LNPs for 24 h in A549 cells (n = 3 dishes). j IF staining of ALIX in A549 cells with different treatments. The number of ALIX puncta per cell was shown below. Three-time repeats with similar results. Scale bar, 50 μm. k Schematics of separate dosing of UA liposomes (LipoUA) with PL32 LNPs and P-UA LNPs. l ROS activation after treatment with LNPs and separate UA liposomes with PL32 LNPs in RAW264.7 cells. Three-time repeats with similar results. Scale bar, 10 μm. m Downstream activation of NF-κB pathways after treating with LNPs, and separate UA liposomes with PL32 LNPs in RAW264.7 cells (n = 3 wells). GAPDH: the loading control. n Schematics of the mechanism of UA promoting mRNA expression and reducing inflammation. Data were represented as mean ± SEM. Statistical significance was calculated through two-tailed unpaired Student’s t-test (b, g), One-way ANOVA with Dunnett’s test (i) or Tukey’s test (a, m). Figure 3c, k, n were created in BioRender. com with attribution line Miao, L. (2025) https://BioRender.com/4huyh8x, Miao, L. (2025) https://BioRender.com/4bfch5u and Miao, L. (2025) https://BioRender.com/nqlsk00), respectively. Source data are provided as a Source Data file.
Fig. 4
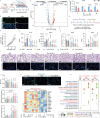
Fig. 4. NIF LNPs relieve lung injury in bronchopulmonary dysplasia (BPD) rat model.
a Schematic representations of BPD models. b Proteomic differential analysis of lung tissues in BPD rats and wild-type (WT) rats (n = 4 rats). c Relative mRNA expression of Nr1d1 in healthy and BPD rats with 80% oxygen exposure for different days (n = 5 rats in day 7 and 14, n = 3 rats in day 21 and 28). d Representative immunofluorescence staining of NR1D1 in lungs from healthy and BPD rats with 80% oxygen exposure for 21 days. e Treatment schedules for intratracheal administrations of PBS, blank and mRNA containing LNPs (equivalent to 0.6 mg/kg mRNA, blank LNPs with the same lipid dose). f Growth rate of BPD rats after different treatments (n = 6 rats). g Inflammatory cytokine levels in BAL and (h) reactive oxygen species (ROS) and superoxide dismutase (SOD) levels in lung tissues from BPD rats in all treatment groups (n = 6 rats). i H&E and CD31 staining of lungs in BPD rats with all groups after treatment. Scale bar, 100 μm. (n = 6 rats in each group). j Mean linear intercept (MLI), radical alveolar counts (RACs) and CD31 coverage% area in rats’ lung. The quantification was performed in four randomly selected fields per rat for MLI and RACs and three randomly selected fields for CD31(from n = 6 rats). k IF staining of NR1D1 in the lungs from BPD rats treated with P-UA mNR1D1. Same experiments were repeated three times, with one representative image shown. Scale bar, 100 μm. l Heat map and (m) bubble chart analyzed by KEGG showing the key altered pathways of the bulk transcriptome in lung of BPD rats treated with PBS, blank P-UA LNPs, and mNR1D1 LNPs (n = 4 rats in each group). Data were represented as mean ± SEM. Statistical significance was calculated through two-tailed unpaired Student’s t-test (c) or One-way ANOVA with Dunnett’s test (g, h, j). Two side Fisher test was performed for (m). Figure (a, e) were created in BioRender. com with attribution line Miao, L. (2025) https://BioRender.com/mlpmmia and Miao, L. (2025) https://BioRender.com/86u5sda, respectively. Source data are provided as a Source Data file.
Fig. 5
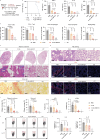
Fig. 5. NIF LNPs relieve lung injury in IPF mice model.
a Treatment schedules for intratracheal administrations of PBS, PL32 LNPs formulated mNR1D1, P-UA LNPs formulated mNR1D1 (0.6 mg/kg), and empty P-UA LNPs with the same lipid dose. b Mice survival curve of all treatment groups and mNR1D1 PL32 LNPs after 4 doses (0.6 mg/kg, n = 8 mice). c Inflammatory cytokine levels in BAL from IPF mice in all treatment groups (n = 5 mice). d Infiltrated immune cells proportion in the lung tissue of all treatment group by flow cytometry (n = 4 mice in PBS, n = 3 mice in P-UA, n = 5 mice in P-UA mNR1D1 and WT group). T cells were labeled as CD45+CD11b-CD3+; CD4 T cells were labeled as CD45+CD11b-CD3+CD4+; macrophages were labeled as CD45+CD11b+F4/80high; neutrophils were labeled as CD45+CD11b+F4/80medLy6G+; polymorphonuclear myeloid derived suppressor cells (MDSCs (PMN)) were labeled as CD45+CD11b+F4/80lowLy6clowLy6G+; (e) Representative images of Masson’s trichrome, (f) Sirius red, (g) H&E, and IF staining of (h) lysyl oxidase (LOX) and (i) α-SMA in IPF mice after different treatments (n = 5 mice). Scale bar=100 μm in (ei). j The quantification of (e, f, h, i) was performed in three randomly selected fields per mouse (from n = 5 biological independent mice per group, mean ± SEM). k Flow cytometric analysis of IL-4 (upper) and IL-17 (bottom) positive cells in CD45+ group (n = 5 mice). l Quantification of (k) (n = 5 mice). Data were represented as mean ± SEM. Statistical significance was calculated through One-way ANOVA with Tukey’s test (c, d, j, l). Figure 5a was created in BioRender. com with attribution line Miao, L. (2025) https://BioRender.com/sbg9i5w. Source data are provided as a Source Data file.
Fig. 6
Fig. 6. Preparation of aerosolizable and Freeze-dried stable NIF LNPs.
a Schematics for LNP preparation, freeze-dried storage and reconstitution for nebulization inhalation. b Quantification of protein expression in lungs treated with P-UA LNPs of all formulations at 6 h post-administration by nebulization inhalation. (n = 3 mice, 0.2 mLuc/kg). c The photos of optimized P-UA LNPs after lyophilization and reconstitution. d IVIS images of lung in mice treated with mLuc P-UA LNPs pre- and post-lyophilization (n = 3 mice, 0.2 mLuc/kg). e Hydrodynamic diameter of P-UA LNPs post-lyophilization over 3 months (n = 3 independent tests). f Therapeutic schedule for BPD rats treated with mNR1D1 P-UA LNPs by nebulization inhalation. g H&E staining of BPD lung treated with mNR1D1 P-UA LNPs by nebulization inhalation (n = 3 mice). Scale bar, 100 μm. h Quantification of radial alveolar count (RAC) and mean linear intercept (MLI) (n = 3 mice, five randomly fields each). i Therapeutic schedule for IPF mice treated with mNR1D1 P-UA LNPs by nebulization inhalation. j Masson’s trichrome and Sirius red staining of IPF lungs treated with mNR1D1 P-UA LNPs by nebulization inhalation (n = 3). Scale bar, 100 μm. k Quantification of coverage area of collagen (n = 3 mice, five selected fields each). l Schematics of mLuc expression of nebulized LNPs in beagle dogs. m IVIS images of dogs’ lungs in treated with mLuc containing LNPs by nebulization inhalation (0.3 mg/kg). Quantification was presented on the right. 21 pieces of lung tissue from 7-lobe lung per dog were lysed for luminescence detection. n H&E staining of dogs’ lungs treated with LNPs by nebulization inhalation. Scale bar, 100 μm. o Cytokines in dogs’ BAL after treated with LNPs by nebulization inhalation (n = 1 dog). p Neutrophils and WBC in dogs’ blood after treated with LNPs by nebulization inhalation (n = 1 dog). Data were represented as mean ± SEM. Statistical significance was calculated through two-tailed unpaired Student’s t-test (m) or One-way ANOVA with Dunnett’s test (b, h, k). Figure 6a, f, i, l were created in BioRender. com with attribution line Miao, L. (2025) https://BioRender.com/9yumzcs, Miao, L. (2025) https://BioRender.com/4flxdkv, Miao, L. (2025) https://BioRender.com/6wt8ggy and Miao, L. (2025) https://BioRender.com/scwe1ol, respectively. Source data are provided as a Source Data file.

References

    1. Wang, C., Zhang, Y. B. & Dong, Y. Z. Lipid Nanoparticle-mRNA Formulations for Therapeutic Applications. Acc. Chem. Res54, 4283–4293 (2021). - PMC - PubMed
    1. Melamed, J. R. et al. Ionizable lipid nanoparticles deliver mRNA to pancreatic β cells via macrophage-mediated gene transfer. Sci. Adv.9, eade1444 (2023). - PMC - PubMed
    1. Liu, S. et al. Membrane-destabilizing ionizable phospholipids for organ-selective mRNA delivery and CRISPR-Cas gene editing. Nat. Mater.20, 701 (2021). - PMC - PubMed
    1. Miao, L. et al. Delivery of mRNA vaccines with heterocyclic lipids increases anti-tumor efficacy by STING-mediated immune cell activation. Nat. Biotechnol.37, 1174 (2019). - PubMed
    1. Zhang, L. Z. et al. Effect of mRNA-LNP components of two globally-marketed COVID-19 vaccines on efficacy and stability. Npj Vaccines8, 156 (2023). - PMC - PubMed

LinkOut - more resources