. 2025 Jul 14;16(1):6369.
doi: 10.1038/s41467-025-61567-7.

Dual targeting of tumoral cells and immune microenvironment by blocking the IL-33/IL1RL1 pathway

Affiliations

Dual targeting of tumoral cells and immune microenvironment by blocking the IL-33/IL1RL1 pathway

Denggang Fu et al. Nat Commun. .

Abstract

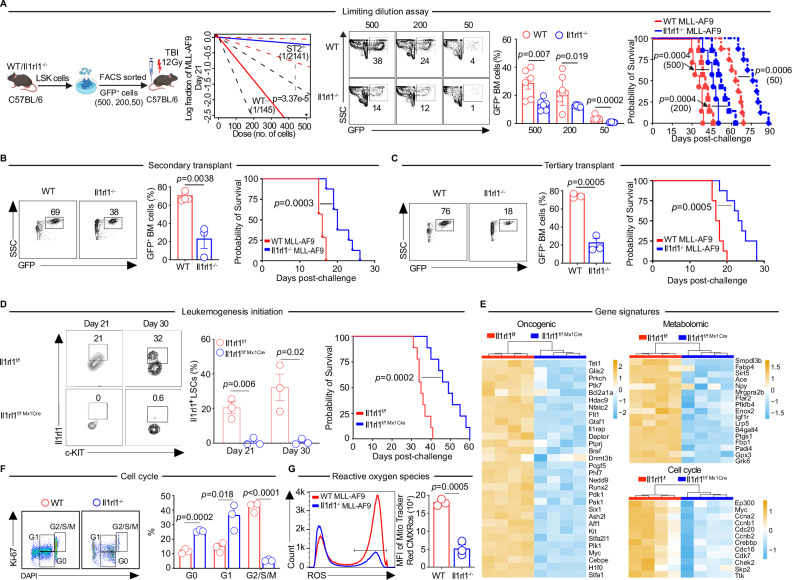
Leukemia stem cells (LSCs) are a small yet powerful subset of leukemic cells that possess the ability to self-renew and have a long-term tumorigenic capacity, playing a crucial role in both leukemia development and therapy resistance. These LSCs are influenced by external and internal factors within the bone marrow niche. By delving into the intricate interplay between LSCs and their immune environment, we can pave the way for innovative immunotherapies that target both the malignant stem cells and the suppressive immune microenvironment, addressing both the "seed" and the "soil" simultaneously. Through the analysis of public datasets and patient samples, we show that elevated IL1RL1 expression correlates with poor prognosis and therapy resistance in acute myeloid leukemia (AML). At the core of this process, stem cell leukemogenesis initiation and maintenance signals are driven by a stress-induced IL-33/IL1RL1 autocrine loop. This LSC-induced IL-33/IL1RL1 signaling fosters an immune regulatory microenvironment. Therefore, IL1RL1 emerges as a promising therapeutic target, with IL1RL1-specific T cell-engaging bispecific antibodies holding great potential as cutting-edge immunotherapeutics for AML.


Conflict of interest statement

Competing interests: N.-K.V.C. reports receiving commercial research grants from Y-mabs Therapeutics and Abpro-Labs Inc.; holding ownership interest/equity in Y-Mabs Therapeutics Inc., holding ownership interest/equity in Abpro-Labs, and owning stock options in Eureka Therapeutics. N.-K.V.C. is the inventor and owner of issued patents licensed by Memorial Sloan Kettering Cancer Center (MSKCC) to Ymabs Therapeutics, Biotec Pharmacon, and Abpro-labs. Both MSKCC and N.-K.V.C. have financial interest in Y-mabs. N.-K.V.C. is an advisory board member for Abpro-Labs and Eureka Therapeutics. Otherwise, the authors declare that they have no competing interests.

Figures

Fig. 1
Fig. 1. High IL1RL1 in leukemic cells and LSCs correlate with poor prognosis and refractoriness in AML patients.
Kaplan-Meier survival of AML patients with high vs. low IL1RL1 expression (above vs. below median) in combined TCGA/TARGET datasets (A, n = 360) and AMLCG1999 (B, n = 417). Log-rank test. IL1RL1 mRNA expression in AML patients vs. healthy donors from TCGA/TARGET (AML, n = 360; HD, n = 514) (C), and FHCC/AMLCG1999 (AML, n = 611; HD, n = 38) (D). In box plots, the center line represents the mean, the box limits represent the 25th and 75th percentiles, and the whiskers extend to the minimum and maximum values of IL1RL1 expression. Unpaired two-sided t-test was used. E IL1RL1 expression across molecular AML subtypes (IDH1^mut, n = 51; IDH2^mut, n = 55; NPM1mut, n = 216; CEBPAmut, n = 52; FLT3ITD, n = 190; FLT3TKD, n = 79; NRASmut, n = 68; EVI1pos, n = 51) and healthy donors (n = 46) from the FHCC AML dataset. ANOVA analysis with post-hoc Bonferroni t-test was used. Proportion of infiltrating LSC and progenitor subsets in IL1RL1high and IL1RL1low AML patients from TCGA/TARGET (F, n = 180/group) and AMLCG1999 (G, n ≈ 208/group) datasets. Violin plots show median, the 25th and 75th percentiles, and whisker. Wilcoxon rank-sum test. IL1RL1 (H) and IL-33 (I) mRNA expression in AML LSCs (CD34+CD38) vs. normal HSCs (CD34+CD38+/−) from the Princess Margaret dataset (LSC, n = 54; HSC, n = 16), GSE63270 (n = 20), and healthy HSCs from GSE24759, GSE17054, and GSE19599 (n = 14). Data are presented as box and whisker plots. Unpaired two-sided t-test was used. J Representative flow plots and frequencies (mean ± SEM) of IL1RL1+LSCs in bone marrow aspirates ~21 days post-induction chemotherapy in AML non-responders (NR, n = 10) vs. complete responders (CR, n = 12). LSCs defined as CD34+CD38CD90+CD45RA. Unpaired two-sided t-test was used. K Representative plots and frequencies (mean ± SEM) of IL1RL1+IL-33+LSCs in NR vs. CR AML patients, LSCs as defined in (J) (n = 10–12/group). Unpaired two-sided t-test was used.
Fig. 2
Fig. 2. Il1rl1 is required for leukemogenesis initiation and LSCs self-renewal.
A Limiting dilution assays were performed to assess leukemogenic potential in WT and Il1rl1−/− mice using the MLL-AF9 AML model. Estimated LSC frequencies at day 21 post-transplant were calculated using ELDA from mice transplanted with 500, 200, or 50 MLL-AF9 LSCs (n = 8/group). Representative flow cytometry plots and quantification of GFP+ BM cells are shown (n = 6–8/group). Kaplan-Meier survival curves for mice transplanted with sorted WT or Il1rl1−/− LSCs (500, 200, or 50 cells) are presented. B Secondary transplantation with 0.5 × 10⁶ BM cells from primary leukemic mice was performed. Shown are representative flow plots and GFP+BM cell frequencies at day 15 (n = 3/group), along with survival curves of secondary recipients. C Tertiary transplantation was conducted using BM from secondary recipients. GFP+BM frequencies at day 15 and survival curves of tertiary recipients are shown (n = 3/group). D Inducible deletion of Il1rl1 under the Mx1 promoter was evaluated post-AML challenge. Il1rl1 expression and GFP+LSC frequencies in Il1rl1f/f and Il1rl1f/f Mx1Cre mice were assessed at days 21 and 30 after pIpC induction (n = 3/group). Survival curves of transplanted mice are shown. E Heatmaps show differential expression of oncogenic, metabolic, and cell cycle-related genes in Il1rl1f/f and Il1rl1f/f Mx1Cre LSCs (log₂-transformed). F Cell cycle analysis of GFP+ BM cells in Il1rl1f/f and Il1rl1f/f Mx1Cre LSCs recipients on day 14 post-pIpC shows representative plots and distributions across G0, G1, and G2/S/M phases (n = 3/group). G ROS levels in GFP+ BM cells in Il1rl1f/f and Il1rl1f/f Mx1Cre LSCs recipients at day 14 post-pIpC are shown as histograms and quantified by mean fluorescence intensity (n = 3/group). Data are presented as mean ± SEM. Statistical analyses were performed using unpaired two-sided t-test (AD, F, G) or log-rank tests for Kaplan-Meier survival.
Fig. 3
Fig. 3. Il1rl1 is required for leukemia maintenance.
A Experimental schema for investigating the role of Il1rl1 in murine MLL-AF9 leukemia maintenance. Il1rl1 WT or Il1rl1−/−LSCs were sorted and defined as MLL-AF9GFPLineage negative, c-Kit+Sca-1+. B Representative flow plots and the frequencies presented as mean values ± SEM of LSCs in the BM of Il1rl1f/f vs Il1rl1f/f Mx1Cre LSCs transferred mice on day 14 (n = 3) and day 21 (n = 3). pIpC was administered on day 4 after the leukemia was established, unpaired two-sided t-test. C Kaplan-Meier survival curves of mice transplanted with Il1rl1f/f (n = 12) vs Il1rl1f/f Mx1Cre (n = 13) LSCs with pIpC administration on day 4 after the leukemia was established. Log-rank test was used.
Fig. 4
Fig. 4. Hematopoietic stress induces an IL-33/Il1rl1 signaling autocrine loop in HSCs and LSCs in the healthy and leukemic BM niches.
A Hematopoietic stress-induced IL-33/Il1rl1 loop in normal HSCs. Schematic of 5-FU administration in IL-33GFP reporter mice to assess Il1rl1 and IL-33 expression in LSK and long-term HSCs. Representative flow plots and quantification (mean ± SEM) of Il1rl1 and/or IL-33 expression at days 3 and 5 post-5-FU or vehicle injection (n = 4/group). Unpaired two-sided t-test was used. B IL-33/Il1rl1 autocrine loop in LSCs. Schematic of IL-33 deficiency in MLL-AF9GFP LSCs using IL-33Cit/Cit KO mice. Mice received 500 IL-33WT or IL-33Cit/Cit KO MLL-AF9GFP LSCs with IL-33Cit/Cit KO supporting BM cells. Kaplan-Meier survival analysis compared recipient mice (log-rank test). Flow plots and frequencies (mean ± SEM) of Il1rl1+GFP+BM cells at days 7 and 14 post-transplant (n = 3/group), analyzed by unpaired two-sided t-test. C Stem cell remodeling by the LSC-derived IL-33/Il1rl1 loop. Representative plots and quantification (mean ± SEM) of total LSCs, long-term LSC frequencies, and absolute cell numbers in mice transplanted with IL-33WT vs IL-33Cit/Cit KO MLL-AF9GFP LSCs over time (n = 3/group). Unpaired two-sided t-test was used. D Immune microenvironment remodeling by the LSC-derived IL-33/Il1rl1 loop. Absolute numbers and frequencies (mean ± SEM) of CD8+T cells, Ki-67+CD8+T cells, perforin+CD8+T cells, WT1+CD8+T cells (with representative plots), Il1rl1+Foxp3+Tregs, and MDSCs at day 14 post-transplant in IL-33WT vs IL-33Cit/Cit KO MLL-AF9GFP LSC recipients (n = 3/group). Unpaired two-sided t-test.
Fig. 5
Fig. 5. Development of functional and non-functional anti-Il1rl1 T-BsAbs.
A Schematic structure of anti-murine Il1rl1 T-BsAbs (BC281) and mutated control BC462 T-BsAbs. B Purity evaluated by HPLC of anti-murine Il1rl1 T-BsAb (BC281) and control BC462. C Schematic structure of anti-human IL1RL1 T-BsAb (BC282) and mutated control BC283. D Purity evaluated by HPLC of anti-human IL1RL1 T-BsAbs (BC282) and control BC283. E Surface plasmon resonance (SPR) analysis of BC281 and BC282 binding kinetics. Interactive indexes between IL1RL1 antibodies and the surface ligands included association (Ka), dissociation (Kd), equilibrium constant (KD) and binding half-lives (t1/2) are shown. F Toxicity tests in vivo at different dosages of anti-murine Il1rl1 T-BsAbs treatment in normal C57BL/6 mice. Kaplan-Meier survival curves of mice injected at different dosages and body weight changes presented as mean values ± SEM (n = 5/group). For survival analysis, log-rank test was used. For the frequencies comparison (n = 3/per group), Unpaired two-sided t-test was used. G Toxicity of anti-murine Il1rl1 T-BsAbs in the immunocompetent MLL-AF9 leukemia model. Body weight change of mice treated with BC281 and control BC462 (n = 6); colon length of mice treated with BC281 and control BC462 on day 10, 16, 24 post-AML challenge (n = 3/timepoint). Data are mean ± s.e.m. Unpaired two-sided t-test was used. H Experimental schema of anti-murine Il1rl1 T-BsAbs BC281 and control BC462 treatment in immunocompetent MLL-AF9 leukemia model; Kaplan-Meier survival curves of mice treated with BC281(5 µg), BC281(10 µg), and control BC462 (10 µg), log-rank test was used for survival (n = 10/group); Frequencies of MLL-AF9gfp total BM cells and LSCs in the BM from mice treated with BC281(5 µg), BC281(10 µg), and control BC462 (10 µg) at Day 21 post-challenge, ANOVA with post-hoc Bonferroni t-test was used. Data are mean ± s.e.m. (n = 3/group).
Fig. 6
Fig. 6. Anti-Il1rl1 T-BsAbs eradicate leukemia and LSCs to extend survival in AML models.
A In vitro cytotoxicity of anti-Il1rl1 T-BsAbs BC281 vs. control BC462 against MLL-AF9GFP leukemic cells co-cultured with CD8+T cells, measured by SYTOX Blue at 6 and 16 h and varying T-BsAb concentrations (n = 3 per concentration). Two-way ANOVA; data shown as mean ± SEM. B Il1rl1 expression on MLL-AF9GFP cells at transplantation and treatment schema in the immunocompetent AML model. C Kaplan-Meier survival curves of MLL-AF9GFP mice treated with BC281 or BC462 (n = 7/group). Log-rank test. Frequencies (mean ± SEM) of GFP+LSCs (D) and CD3+CD8+, WT1+CD8+ T cells (E) in BM at days 10, 16, and 24 post-treatment (n = 6). Unpaired two-sided t-test. F In vitro cytotoxicity of anti-Il1rl1 T-BsAbs against Il1rl1+Foxp3+Tregs at 6 and 16 h; in vivo Tregs frequencies at days 10, 16, and 24 (n = 6) post-treatment. Two-way ANOVA. G The ratio of CD8+T cell to leukemic cells in the malignant BM niche without treatment at days 4, 11, and 17 post-challenge (n = 4). H, I Kaplan-Meier survival and frequencies (mean ± SEM) of GFP+LSCs, CD3+CD8+, WT1+CD8+ T cells, and Il1rl1+Foxp3+Tregs in mice treated with BC281, BC462, CD8+T cells, ALT-803 or combinations (n = 4–12/group). Log-rank test for survival. One-way ANOVA for frequencies. J In vitro cytotoxicity of anti-human IL1RL1 T-BsAbs BC282 vs. control BC283 against MOLM14GFP cells co-cultured with CD8+T cells at 16 h and various concentrations (n = 3). Two-way ANOVA. K IL1RL1 expression on MOLM14GFP cells and schema for humanized AML treatment model. L Kaplan-Meier survival and leukemic cell frequencies (mean ± SEM) in BC282 vs. BC283-treated MOLM14GFP mice at days 21 and 50 (n = 3–12/group). Log-rank test for survival and Unpaired two-sided t-test. M Body weight changes and colon length at day 21 post-treatment with BC282 or BC283 (n = 3–10). Data are mean ± s.e.m. Unpaired two-sided t-test for colon length and two-way ANOVA for body weight changes. N, O CD8+T cell number, activation (Ki-67+, CD107a+, IFN-γ+), and exhaustion (PD-1+) marker frequencies in BM on day 21 post-treatment (n = 3/group). Data are mean ± s.e.m. Unpaired two-sided t-test.
Fig. 7
Fig. 7. Anti-human IL1RL1 T-BsAbs show potent activity against primary AML xenografts.
A Histograms of IL1RL1 expression vs isotype control on eight pediatric AML PDX cells, six with MLL oncofusion and 2 PDX AML cells with non-MLL oncofusion (NPTL-301 and NPTL-511) via flow cytometry. B Representative plot of IL1RL1 expression on AML pediatric PDX NTPL-377irfp/luc at the time of transplantation, and schema of anti-human IL1RL1 T-BsAb treatment in PDX AML model; Radiance imaging of AML PDX mice in untreated, adoptive transfer of human T cells, BC283 + adoptive transfer of human T cells, and BC282 + adoptive transfer of human T cells treated groups at days 28, 36, 42, and 49 post-treatment; Frequencies of NTPL-377irfp/luc leukemic cells over time in the 4 groups; Kaplan Meier survival curves of NTPL-377irfp/luc PDX mice in the 4 groups. Log-rank test was used. C Anti-hIL1RL1 T-BsAb in combination with IL-15 treatment in PDX AML model. Experimental scheme of anti-hIL1RL1 T-BsAb treatment in combination with IL-15 in PDX AML model; Radiance imaging of leukemia bearing mice in untreated, T cells+BC283+hIL-15, BC82 alone+hIL-15, and T cells+BC282+hIL-15 treated groups post treatment. Data are mean ± s.e.m. (n = 5–8). C Survival analysis of NTPL-377irfp/luc cells bearing NSG mice untreated, and treated with T cells +BC283+hIL-15, BC282 alone+hIL-15, and T cells+BC282+hIL-15. Log-rank test was used for survival analysis (n = 5–8).

Similar articles

References

    1. Jemal, A. et al. Annual report to the nation on the status of cancer, 1975-2014, featuring survival. J. Natl. Cancer Inst.109, djx030 (2017). - PMC - PubMed
    1. Burd, A. et al. Precision medicine treatment in acute myeloid leukemia using prospective genomic profiling: feasibility and preliminary efficacy of the Beat AML Master Trial. Nat. Med.26, 1852–1858 (2020). - PMC - PubMed
    1. Garlanda, C., Dinarello, C. A. & Mantovani, A. The interleukin-1 family: back to the future. Immunity39, 1003–1018 (2013). - PMC - PubMed
    1. Griesenauer, B. & Paczesny, S. The ST2/IL-33 Axis in immune cells during inflammatory diseases. Front. Immunol.8, 475 (2017). - PMC - PubMed
    1. Levescot, A. et al. BCR-ABL-induced deregulation of the IL-33/ST2 pathway in CD34+ progenitors from chronic myeloid leukemia patients. Cancer Res.74, 2669–2676 (2014). - PubMed

MeSH terms

LinkOut - more resources