. 2025 Jul 14;15(1):25435.
doi: 10.1038/s41598-025-09464-3.

A mitochondrial-related gene signature predicts prognosis and immunotherapy response in hepatocellular carcinoma

Affiliations

A mitochondrial-related gene signature predicts prognosis and immunotherapy response in hepatocellular carcinoma

Hongli Shu et al. Sci Rep. .

Abstract

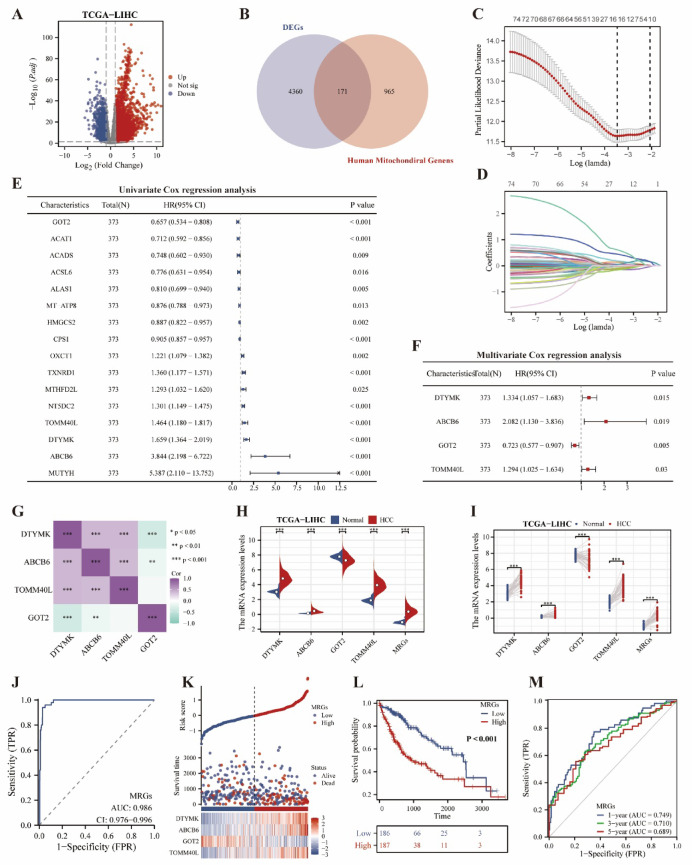
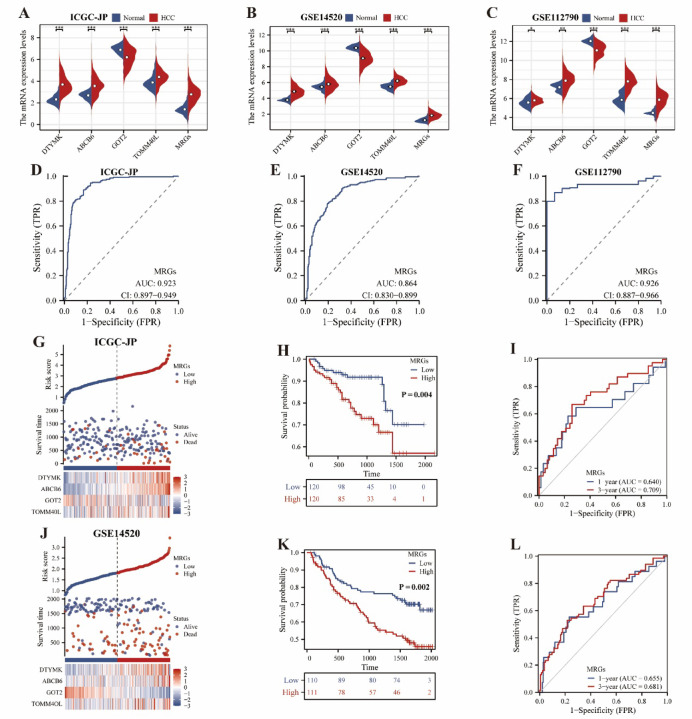
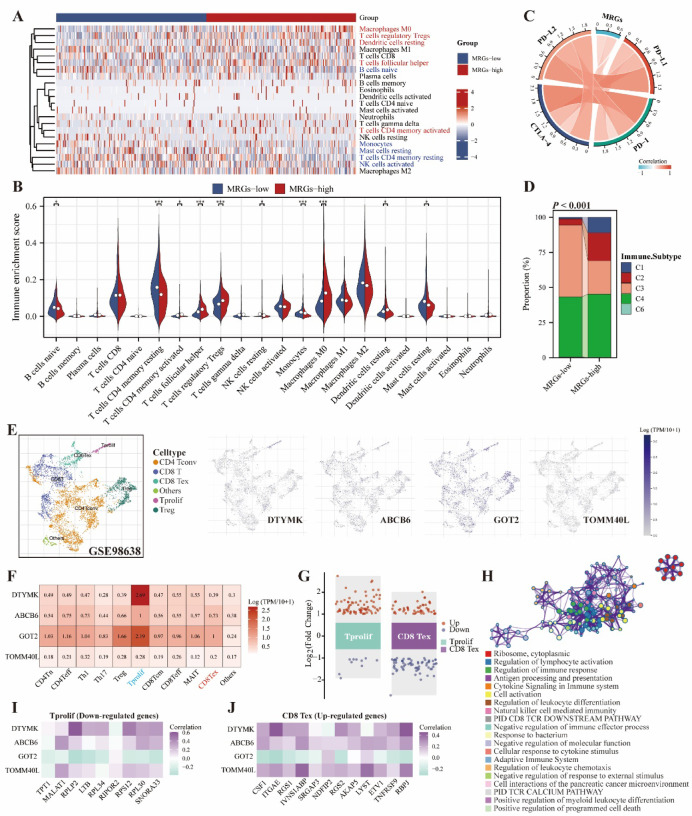
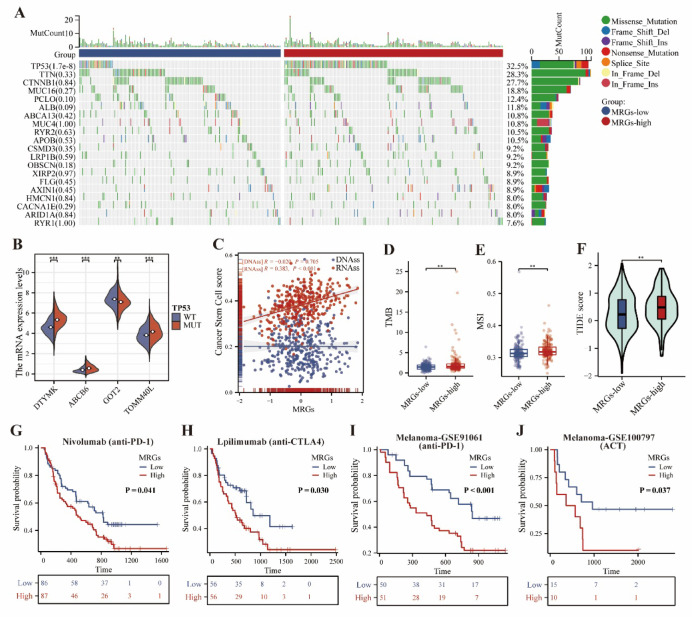
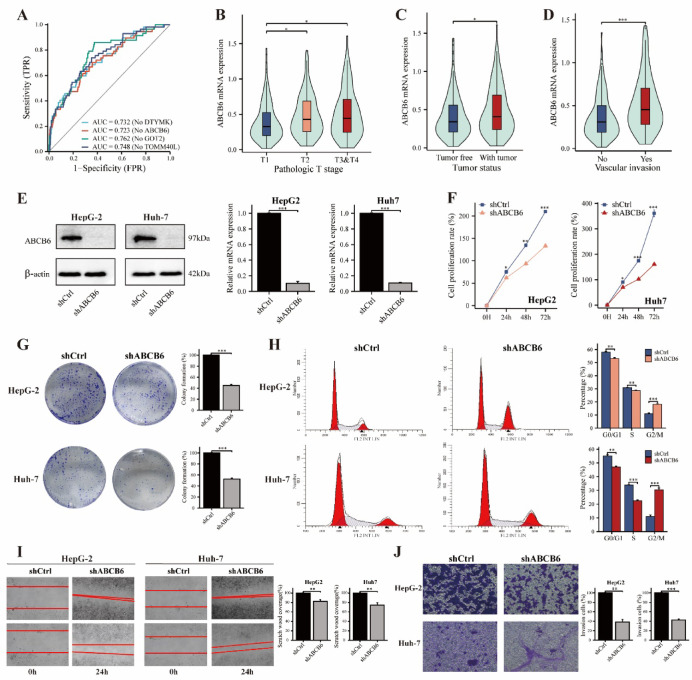
Hepatocellular carcinoma (HCC) remains a leading cause of cancer-related mortality worldwide, characterized by frequent recurrence and poor clinical outcomes. This study aimed to develop a mitochondria-related genes (MRGs) signature for prognostic stratification and immunotherapy response prediction in HCC patients. Derived from the TCGA-LIHC cohort and validated across independent ICGC-JP and GEO datasets, the MRGs signature comprised four genes (DTYMK, ABCB6, GOT2, and TOMM40L) that were markedly overexpressed in HCC tissues and strongly associated with adverse prognosis. MRGs-based nomogram exhibited superior predictive accuracy, highlighting their clinical potential for personalized risk assessment. Within the tumor microenvironment, high-MRGs tumors demonstrated significant enrichment of immunosuppressive components, including regulatory T cells, tumor-associated macrophages, and checkpoint molecules PD-1 and CTLA-4. The MRGs-high subgroup showed heightened sensitivity to cisplatin but resistance to erlotinib, and impaired immunotherapy responses, which has potential clinical transformation value in the design of individualized combination therapy. Functional validation revealed ABCB6 as a key oncogenic driver, with genetic depletion significantly attenuating HCC cell proliferation, migration, and invasion in vitro. Collectively, the MRGs signature serves as a better predictor of HCC prognosis and therapeutic resistance, while its core component ABCB6 emerges as a critical regulator of HCC malignancy.

Keywords: ABCB6 transporter; Hepatocellular carcinoma; Immunotherapy resistance; Mitochondrial metabolism; Prognostic biomarker.


Conflict of interest statement

Declarations. Competing interests: The authors declare no competing interests.

Figures

Fig. 1
Fig. 1
Flow chart of this study.
Fig. 2
Fig. 2
Construction of a HCC-associated MRGs signature utilizing the TCGA-LIHC cohort. (A) The volcano plot demonstrating differentially expressed genes between HCC and normal tissues using the TCGA-LIHC cohort. (B) The Venn diagram showing the intersection of HCC-associated DEGs with human mitochondria-associated genes. Lasso (C,D), univariate (E), and multivariate Cox regression analyses (F) were performed to screen and construct a MRGs signature in HCC. (G) Heat map showing correlation between members of MRGs. (H,I) Unpaired and paired analyses were performed to assess the differential expression of members of MRGs in HCC and normal tissues. (J) ROC curve demonstrating the accuracy of MRGs in diagnosing HCC tissue. (K) The scatterplot demonstrating the difference in survival time and number of deaths in HCC patients in the MRGs-high and -low groups. (L) Kaplan–Meier survival curve showing the difference in overall survival of HCC patients in the MRGs-high and -low groups. (M) Time-dependent ROC curves demonstrating the accuracy of MRGs in predicting 1-, 3-, and 5-year survival in HCC patients. **P < 0.01, ***P < 0.001.
Fig. 3
Fig. 3
Validation of MRGs expression levels and prognostic value using multiple independent cohorts. (AC) ICGC-JP, GSE14520, and GSE112790 cohorts were used to validate the expression levels of DTYMK, ABCB6, GOT2, TOMM40L, and MRGs in HCC and normal tissues, respectively. (DF) ROC curves demonstrating the accuracy of MRGs in diagnosing HCC tissue. The scatterplot of MRGs, ICGC-JP (G) and GSE14520 (J) cohorts were the validation subset 1 and validation subset 2, respectively. (H,K) Kaplan–Meier survival analyses were performed to demonstrate the difference in overall survival of HCC patients between the MRGs-high and -low groups. (I,L) Time-dependent ROC curves demonstrating the accuracy of MRGs in predicting 1- and 3-year survival in HCC patients. *P < 0.05, **P < 0.01, ***P < 0.001.
Fig. 4
Fig. 4
Construction and validation of a HCC-related nomogram model based on MRGs. (A) A general overview of the association of MRGs with clinicopathologic characteristics of patients with HCC using TCGA-LIHC cohort. MRGs were related to pathological stage in TCGA-LIHC (B) and ICGC cohorts (C), T stage (D), histologic grade (E), AFP concentration (F), and residual tumor (G). (H) A nomogram model was constructed combining MRGs and pathological stage by utilizing the TCGA-LIHC cohort. (I) The calibration curves of the model were shown for 1-, 3-, and 5-year, respectively. (JL) Time-dependent ROC curves demonstrated the ability of the model to predict 1-, 3-, and 5-year overall survival in HCC patients using the TCGA-LIHC, ICGC-JP, and GSE14520 cohorts, respectively. *P < 0.05, **P < 0.01, ***P < 0.001.
Fig. 5
Fig. 5
Biological functions of MRGs. (A) The volcano map showing differentially expressed genes between MRGs using the TCGA-LIHC cohort. MRGs related DEGs were subjected to GO enrichment analysis, including MF, CC (B), and BP (C). (D) KEGG analysis of MRGs related DEGs. (E) The scatterplot demonstrating the correlation between MRGs and HRD using the TCGA-LIHC cohort. (F) Comparison of the difference in IC50 between MRGs-high and -low groups for cisplatin and erlotinib. ***P < 0.001.
Fig. 6
Fig. 6
Role of MRGs in the tumor microenvironment. (A) The heatmap showing the relationship between MRGs and immune cells on the basis of the Cibersort algorithm. (B) Differences in infiltration of immune cells between MRGs-high and -low groups. (C) Chord plot demonstrating the correlation of MRGs with four immunosuppressive checkpoints. (D) Differences in immune subtypes of HCC patients between MRGs-high and -low groups. C1: wound healing; C2: IFN-gamma dominant; C3: inflammatory; C4: lymphocyte depleted; C6: TGF-β dominant. (E,F) Single-cell analysis demonstrated the expression abundance of DTYMK, ABCB6, GOT2, and TOMM40L on immune cells using the GSE98638 cohort. (G) Volcano diagram showing differentially expressed genes on Tprolif and Tex cells. (H) Functional enrichment of the differentially expressed genes. (I,J) Heatmap showing the correlation of MRGs members with Tprolif-upregulated and Tex-downregulated genes. *P < 0.05, **P < 0.01, ***P < 0.001.
Fig. 7
Fig. 7
MRGs with genetic mutations and immunotherapy. (A) The oncoplot depicted gene mutation differences in HCC patients between MRGs-high and -low groups. (B) Differential expression of DTYMK, ABCB6, GOT2 and TOMM40L between TP53-mut and -wt groups. (C) The scatterplot demonstrated the correlation of MRGs with tumor stemness indicators, DNAss and RNAss. (DF) Differences in TMB, MSI, and TIDE scores of HCC patients between MRGs-high and -low groups. (G,H) Kaplan–Meier curves demonstrated the difference in progression-free survival (PFS) of patients treated with nivolumab or ipilimumab between the MRGs-high and -low groups. (I,J) Kaplan–Meier curves demonstrated the difference in PFS of melanoma patients treated with anti-PD-1 or ACT between the MRGs-high and -low groups using the GSE91061 and GSE100797 cohort, respectively. **P < 0.01, ***P < 0.001.
Fig. 8
Fig. 8
Knockdown of ABCB6 significantly inhibited HCC cell proliferation, migration, and invasion in vitro. (A) Time-dependent ROC curves were utilized to screen core genes for MRGs. (BD) Differential expression of ABCB6 in different T-stages, tumor status and vascular invasion. (E) WB and qPCR assays were performed to validate the knockdown efficiency of ABCB6 in HepG-2 and Huh-7 cells. (F,G) The CCK-8 and colony formation assays demonstrated the effect of knockdown of ABCB6 expression on the proliferation of HCC cells. (H) Flow cytometry showing the effect of ABCB6 abrogation on the HCC cell cycle. (I,J) Wound healing and transwell assays exhibited the effects of ABCB6 knockdown on HCC cell migration and invasion. *P < 0.05, **P < 0.01, ***P < 0.001.

References

    1. Sung, H. et al. Global cancer statistics 2020: GLOBOCAN Estimates of Incidence and Mortality Worldwide for 36 Cancers in 185 Countries. CA Cancer J. Clin.71, 209–249. 10.3322/caac.21660 (2021). - PubMed
    1. El-Serag, H. B. Hepatocellular carcinoma: Recent trends in the United States. Gastroenterology127, S27–S34. 10.1053/j.gastro.2004.09.013 (2004). - PubMed
    1. Xu, I. M. et al. Transketolase counteracts oxidative stress to drive cancer development. Proc. Natl. Acad. Sci. USA113, E725–E734. 10.1073/pnas.1508779113 (2016). - PMC - PubMed
    1. Venook, A. P., Papandreou, C., Furuse, J. & de Guevara, L. L. The incidence and epidemiology of hepatocellular carcinoma: A global and regional perspective. Oncologist15(Suppl 4), 5–13. 10.1634/theoncologist.2010-S4-05 (2010). - PubMed
    1. Lu, J. et al. Management of patients with hepatocellular carcinoma and portal vein tumour thrombosis: comparing east and west. Lancet Gastroenterol. Hepatol.4, 721–730. 10.1016/S2468-1253(19)30178-5 (2019). - PubMed

MeSH terms

Substances