. 2025 Aug;644(8078):1058-1068.
doi: 10.1038/s41586-025-09249-8. Epub 2025 Jul 14.

Microbiota-driven antitumour immunity mediated by dendritic cell migration

Affiliations

Microbiota-driven antitumour immunity mediated by dendritic cell migration

Nina Yi-Tzu Lin et al. Nature. 2025 Aug.

Abstract

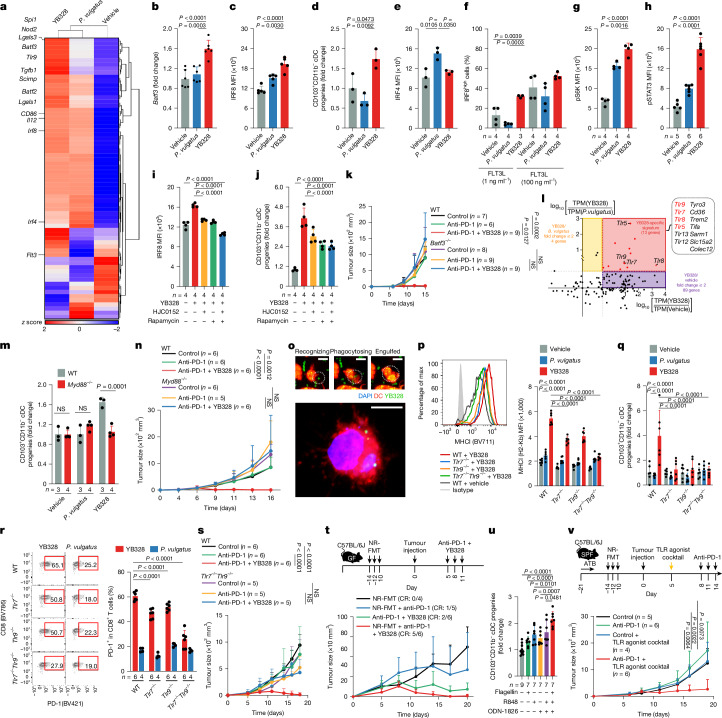
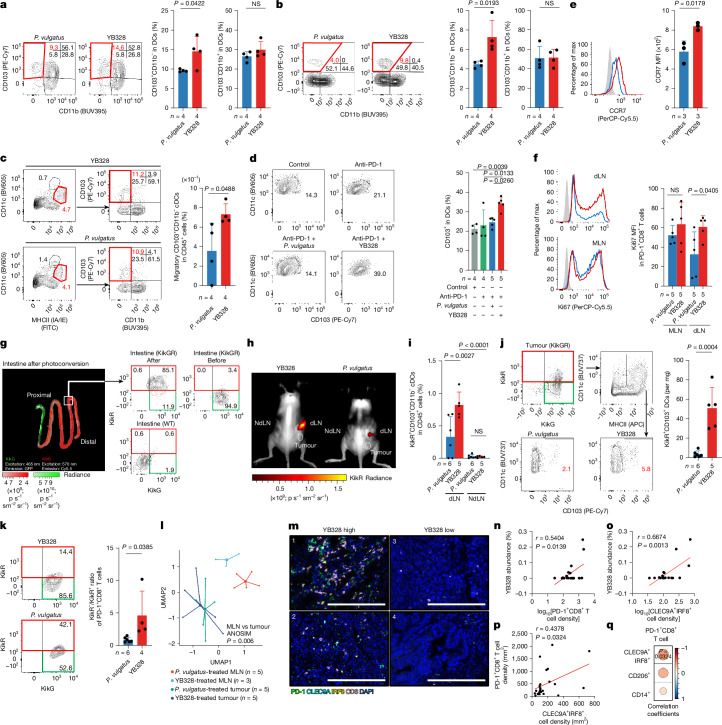
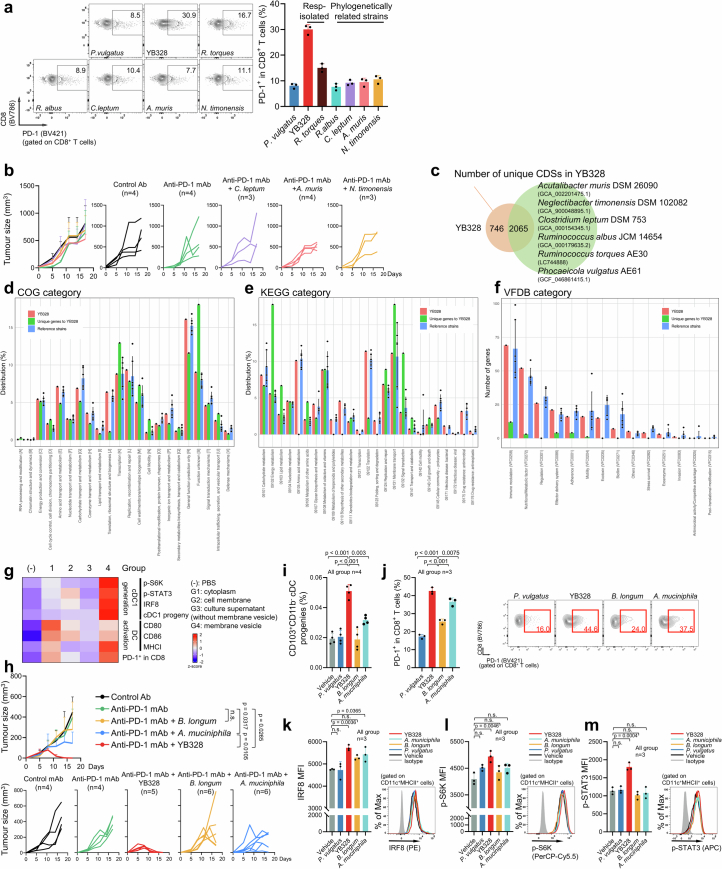
Gut microbiota influence the antitumour efficacy of immune checkpoint blockade1-6, but the mechanisms of action have not been fully elucidated. Here, we show that a new strain of the bacterial genus Hominenteromicrobium (designated YB328) isolated from the faeces of patients who responded to programmed cell death 1 (PD-1) blockade augmented antitumour responses in mice. YB328 activated tumour-specific CD8+ T cells through the stimulation of CD103+CD11b- conventional dendritic cells (cDCs), which, following exposure in the gut, migrated to the tumour microenvironment. Mice showed improved antitumour efficacy of PD-1 blockade when treated with faecal transplants from non-responder patients supplemented with YB238. This result suggests that YB328 could function in a dominant manner. YB328-activated CD103+CD11b- cDCs showed prolonged engagement with tumour-specific CD8+ T cells and promoted PD-1 expression in these cells. Moreover, YB238-augmented antitumour efficacy of PD-1 blockade treatment was observed in multiple mouse models of cancer. Patients with elevated YB328 abundance had increased infiltration of CD103+CD11b- cDCs in tumours and had a favourable response to PD-1 blockade therapy in various cancer types. We propose that gut microbiota enhance antitumour immunity by accelerating the maturation and migration of CD103+CD11b- cDCs to increase the number of CD8+ T cells that respond to diverse tumour antigens.


Conflict of interest statement

Competing interests: S. Koyama receives research funding from Otsuka Pharmaceutical and Chugai Pharmaceutical outside this study and receives honoraria from MSD and Chugai Pharmaceutical. K.I. receives honoraria from MSD and Chugai Pharmaceutical. M.N. receives honoraria (lecture fees) from MSD, Ono Pharmaceutical and Bristol-Myers Squibb (BMS). A.K. receives personal fees from Daiichi-Sankyo, Lilly, Ono Pharmaceutical, Taiho Pharmaceutical, BMS, Merck Pharmaceutical, Sumitomo Dainippon Pharma and AstraZeneca outside this study. K.W. serves as a board member and a founder of ARC Therapies outside of this study. T.D. receives personal fees for advisory roles from Sumitomo Dainippon Pharma, Taiho Pharmaceutical, Takeda Pharmaceutical, Chugai Pharmaceutical, AbbVie, Bayer, Rakuten Medical, Otsuka Pharmaceutical, KAKEN Pharmaceutical, Kyowa Kirin, SHIONOGI, PRA Health Science, A2 Health Care, Noile-Immune Biotech, MSD, Daiichi-Sankyo, Amgen, Novartis, Boehringer Ingelheim, Janssen Pharmaceutical and Astellas Pharmaceutical; receives honoraria (lecture fees) from BMS, Rakuten Medical, Ono Pharmaceutical, Daiichi-Sankyo and AstraZeneca; and receives research funding from Lilly, MSD, Daiichi-Sankyo, Sumitomo Dainippon Pharma, Taiho Pharmaceutical, Novartis, Merck Pharmaceutical, Janssen Pharmaceutical, Boehringer Ingelheim, Pfizer, BMS, AbbVie, Eisai, IQVIA, Chugai Pharmaceutical and SHIONOGI outside this study. K.S. reports receiving personal fees for consulting and advisory roles from BMS, Takeda, Ono Pharmaceutical, Novartis, Daiichi Sankyo, Amgen, Boehringer Ingelheim, Merck Pharmaceutical, Astellas, Guardant Health Japan, Janssen, AstraZeneca, Zymeworks Biopharmaceuticals, ALX Oncology and Bayer; receiving honoraria from BMS, Ono Pharmaceutical, Janssen, Eli Lilly, Astellas and AstraZeneca; and receiving research funding (all to the institution) from Astellas, Ono Pharmaceutical, Daiichi Sankyo, Taiho Pharmaceutical, Chugai, Merck Pharmaceutical, Amgen, Eisai, PRA Health Sciences and Syneos Health, outside the submitted work. H.M. receives research grants from Ono Pharmaceutical, Daiichi Sankyo, PFDeNA, Konica-Minolta and Ambry Genetics and serves as a board member of CureGene outside this study. H.N. receives research funding and honoraria (lecture fees) from Ono Pharmaceutical, BMS, Chugai Pharmaceutical, BD Japan and MSD; receives honoraria (lecture fees) from Amgen; receives research funding from Taiho Pharmaceutical, Daiichi-Sankyo, Kyowa Kirin, Zenyaku Kogyo, Oncolys BioPharma, Debiopharma, Asahi-Kasei, Sysmex, Fujifilm, SRL, Astellas Pharmaceutical, Sumitomo Dainippon Pharma, ARC Therapies and RIKAKEN Holdings; and serves as a scientific advisor and a founder of ARC Therapies and a scientific advisor of LTZ Therapeutics outside this study. S.F., Y.B. and H.N. are the primary inventors on pending patents 2020-165470 belonging to RIKEN and the National Cancer Center Japan. The other authors declare no competing interests.

Figures

Fig. 1
Fig. 1. The response to PD-1 blockade therapy is correlated with the diversity of gut microbiota and enrichment of Ruminococcaceae in association with the abundance of PD-1+CD8+ T cells in the TME.
Faecal samples were collected from patients (n = 15 NSCLC, n = 35 GC) who received PD-1 blockade therapy. a, Comparison of Shannon diversity of gut microbiota of responders and non-responders. b, ROC analysis of the diversity (Shannon index) of microbiota in faeces. AUC, area under the curve. c, Kaplan–Meier curves for PFS of patients with high or low Shannon diversity of gut microbiota. High and low Shannon diversity of gut microbiota in patients were stratified by ROC analysis (b). d, Differences between gut microbiota of responders and non-responders as visualized by PCoA based on unweighted UniFrac distances. The ellipses represent the 95% confidence intervals (CIs). e, Cladogram of differentially abundant taxa identified by LEfSe analysis. Symbol sizes are scaled by the relative abundance. f, Linear discriminant analysis (LDA) scores of the significantly different taxa between responders and non-responders. g,h, ROC analysis (left) and Kaplan–Meier curves (right) for PFS in patients with high or low Ruminococcaceae (g) or Bacteroidaceae (h) abundance. io, Immune profiles of tumour-infiltrating lymphocytes (TILs) in patients with both biopsy and faecal samples available (n = 4 NSCLC, n = 22 GC). Correlations between subsets of TILs and bacterial families enriched in responders and non-responders (i). The frequency of PD-1+CD8+ T cells (representative staining (j,m) and summary (k,n)) in patients with high or low abundances of Ruminococcaceae (k) or Bacteroidaceae (n) stratified by ROC analysis in g and h. Cells were gated on CD8 TILs (j,m). The correlation between PD-1 expression by tumour-infiltrating CD8+ T cells and the abundance of Ruminococcaceae (l) or Bacteroidaceae (o). Significance was assessed using two-sided Mann–Whitney U-test, with data presented as the median (a,k,n); two-sided log-rank test (c, g, right, h, right); ANOSIM with one-tailed significance computed using 999 permutations) (d); or two-sided Pearson’s correlation (i,l,o).
Fig. 2
Fig. 2. YB328 colonization restores responsiveness to anti-PD-1 treatment.
ae, The morphological traits of YB328. a, Left, scanning electron microscopy image. Scale bar, 1 µm. Right, transmission electron microscopy image of negatively stained cells. The arrows indicate extracellular membrane vesicles secreted by YB328. Scale bar, 0.5 µm. b,d, Relative abundances of YB328 (b) and P.vulgatus (d) in faecal samples of patients shown in Fig. 1a–h (n = 50). c,e, ROC curves (left) and Kaplan—Meier curves (right) of the PFS of patients with high or low abundances of YB328 (c) or P.vulgatus (e) in faeces. f,g, Tumour growth curves of SPF mice with B16F10 (f) or MC38 (g) tumours (left, summary; right, each mouse). n = 4–6 mice per group. Here and in other figures, control indicates mice treated with an isotype control antibody. hj, The frequency (representative staining (left) and summary (right)) of PD-1 (h, n = 8), CD62L and CD44 (i, n = 7) and IFNγ and TNF production (j, n = 7) by CD8+ T cells in MC38 tumours. Cells were gated on CD8+ TILs (hj). km, The mean fluorescent intensity (MFI) of CD86 (k, n = 6), CD40 (l, control or anti-PD-1, n = 3, P.vulgatus or YB328, n = 4) and H-2Kb (a marker for MHCI) (m, n = 6) by CD11c+MHCII+ DCs in MC38 tumours. np, Tumour growth curves (n, n = 5–7 mice per group), TCR Vβ repertoire (o) and numbers of skewed TCR Vβ clones (>10% of each clone) (p) among PD-1+CD8+ T cells (n = 5 mice per group). For b and d, each dot indicates one patient, and the data are presented as the median. For f (left), g (left) and n, the average tumour sizes of the groups on a certain day are shown as dots and are presented as the mean ± s.d. For hm and p, each dot in the summary graphs indicates one mouse. Data are presented as the mean ± s.d. (hm) or median (p). Significance was assessed using two-sided Mann—Whitney U-test (b,d,p), two-sided log-rank test (c, right, e, right), two-way analysis of variance (ANOVA) with the Tukey—Kramer method (f,g,n) or one-way ANOVA with Bonferroni correction (hm). Source Data
Fig. 3
Fig. 3. YB328-stimulated BMDCs reduce the activation threshold of CD8+ T cells to induce PD-1 expression.
ad, BMDCs were stimulated with YB328 or P.vulgatus. MFI summaries of the maturation markers CD86 (a, n = 6 wells per group) and H-2Kb (b, n = 5 wells per group), IL-12p70 production (c, n = 5 wells per group) and chemokine (CXCL9 and CXCL10) expression (d, n = 8 wells per group) in BMDCs are shown. e,f, Dynamic imaging of CD8+ T cells and BMDCs stimulated with YB328 or P.vulgatus. e, Contact events were evaluated at 10-min intervals (right), and a representative trajectory of the indicated cell (left) was extracted from Supplementary Video 1. f, Images showing the interaction between DCs and CD8+ T cells. The elapsed time is shown in minutes and seconds. n = 4 cells per group. Scale bars, 10 μm. gm, OT-I CD8+ T cells were cultured with bacteria-treated BMDCs pulsed with the indicated concentrations of antigen peptides. g,i, Expression levels of TCR signalling molecules by CD8+ T cells induced by N4 peptide (g) or Q4H7 peptide (i). NS, not significant. h, Representative confocal images of NFATC1 nuclear translocation (left) and MFI summary (right) Scale bars, 20 µm (first and third columns) and 10 µm (second and fourth columns). jm, The frequency of expression of the effector molecules PD-1 (j,l) and CD62L and CD44 (k,m) in CD8+ T cells induced by treatment with N4 peptide (j,k) or Q4H7 peptide (l,m). Each dot in the summary graphs indicates a well (ad,gm), and the data are presented as the mean ± s.d. (af,h,jm) or the mean (g,i). Significance was assessed using one-way ANOVA with Bonferroni correction (ad) or two-sided unpaired t-test (em). Source Data
Fig. 4
Fig. 4. YB328 increases IRF8 expression to promote CD103+CD11b cDC generation through TLR signalling to augment antitumour immunity.
ae, DCs were treated with P.vulgatus, YB328 or vehicle. Comprehensive gene expression was examined (a), as was the expression of Batf3 (b, n = 6), IRF8 (c, n = 5), IRF4 (e, n = 3) and changes in the progeny of the CD103+CD11b cDCs (d, n = 3). f, IRF8 expression by CDPs treated with bacteria and Flt3L as indicated, n = 3–4. gj, BMDCs were treated with the indicated stimuli, and expression of pS6K (g), pSTAT3 (h) and IRF8 (i) and changes in the progeny of CD103+CD11b cDCs (j) were examined (n = 4–6). k, Tumour growth curves of wild-type (WT) and Batf3−/− mice (n = 6–9) treated as indicated. l, Gene expression signatures of BMDCs stimulated with YB328 were extracted. Red text indicates TLR proteins that were highly expressed in the YB328-specific signature. TPM, transcripts per million. m, Changes in the progeny of CD103+CD11b cDCs (n = 3–4). n, Tumour growth curves of WT and Myd88−/− mice (n = 5–6) treated as indicated. o, Representative confocal images of the engulfment of YB328 by BMDCs. Scale bars, 5 μm. p,q, The expression of MHCI (p; gated on CD11c+MHCII+ cells) and the changes in the progeny of CD103+CD11b cDCs (q) (n = 6). Max, maximum. r, Frequency of PD-1 expression in CD8+ T cells (n = 4–6). s, Tumour growth curves of WT and Tlr7−/Tlr9−/− mice (n = 5–6) treated as indicated. t, Experimental scheme (top) and tumour growth curves (bottom). The number of mice showing a complete response (CR) in n = 4–6 mice is shown in parentheses. u, Changes in the progeny of CD103+CD11b cDCs (n = 7–9). v, Experimental scheme (top) and tumour growth curves (bottom). n = 4–6 mice. Each dot in the summary graphs indicates a well (bj,m,pr,u). The average tumour size of the groups on a certain day is shown as a dot (k,n,s,t,v). The data are presented as the mean ± s.d. Significance was assessed using one-way ANOVA with Bonferroni’s correction (bj,pr,u), two-way ANOVA with the Tukey—Kramer method (k,n,s,v) or two-sided unpaired Student’s t-test (m). Source Data
Fig. 5
Fig. 5. YB328 treatment promotes the differentiation and migration of CD103+CD11b cDCs to the distant TME and primes and activates CD8+ T cells.
af, ATB-SPF mice were subcutaneously injected with MC38 cells and treated with the indicated bacteria. The phenotype and frequency (representative staining (left) and frequency (right)) of DC populations in lamina propria (gated on CD11c+MHCII+ cells) (a), Peyer’s patch (gated on CD11c+MHCII+ cells) (b), dLNs (gated on live CD45+ cells) (c) and tumour (gated on CD11c+MHCII+ cells) (d). Expression (representative staining (left) and MFI summary (right)) of CCR7 by CD103+CD11b cDCs in the MLNs (e, n = 3). Expression (representative staining (left) and MFI summary (right)) of Ki67 by PD-1+CD8+ T cells in dLNs and MLNs (f, n = 5; gated on PD-1+CD8+CD3+ cells). g, Representative image (left) and staining (right) of KikG-expressing or KikR-expressing intestinal cells (gated on CD45+ cells). h, A representative image of the localization of migrated intestinal cells after the indicated bacterial treatment. i, The frequency of KikR+CD103+CD11b cDCs in CD45+ cells in dLNs and NdLNs. j, KikR+CD103+ DCs (representative staining (left) and number summary (right)) in tumours (per mg) (gated on CD45+ cells). k, The KikR/KikR+ ratio of PD-1+CD8+ T cells (representative staining (left) and ratio summary (right)) in tumours. Cells were gated on PD-1+CD8+CD3+ cells. l, The TCR Vβ repertoire in CD8+ T cells in the indicated organs. For i–l, n = 3–6 mice per group. For al, each dot in the summary graphs indicates one mouse. The data are presented as the mean ± s.d. mq, Assays in human samples. m, Representative multiplex immunohistochemical staining of tumours from patients with GC. Scale bars, 200 μm. n,o, Correlation between the YB328 abundance in the faeces of patients and the density of PD-1+CD8+ T cells (n) or CLEC9A+IRF8+ cells (o). n = 20 patients. p,q, Correlation between PD-1+CD8+ T cells and CLEC9A+IRF8+ cells (p) and correlation coefficients between PD-1+CD8+ T cells and other immune cells (q). n = 24 patients. For np, each dot indicates one patient, and the relative correlation was assessed by two-sided Pearson’s correlation. Significance was assessed using two-sided unpaired Student’s t-test (ac,e,f,jk), one-way ANOVA with Bonferroni correction (d,i) or ANOSIM with one-tailed significance using 999 permutations (l). Source Data
Extended Data Fig. 1
Extended Data Fig. 1. The microbiota significantly impacts the clinical outcome of PD-1 blockade therapy.
a-i, Stacked bar plot of the bacterial abundance aggregated at the family-level. Only families with an abundance of >0.1% are shown. (a, n = 50 patients). Shannon diversity of the faecal microbiota in responder (Resp) and non-responder (N-Resp) patients (b, n = 15 patients; f, n = 35 patients). High/low Shannon diversity of the gut microbiota in patients was stratified by ROC analysis (left) Kaplan–Meier curves (right) for PFS of patients with high/low Shannon diversity of the gut microbiota (c, g). In NSCLC patients, the median PFS was 266 days (95% CI, 0 to 696) for those with high diversity, and 23 days (95% CI, 20 to 25) for those with low diversity. In patients with GC, the median PFS was 92 days (95% CI, 17 to 166) for those with high diversity, and 31 days (95% CI, 15 to 47) for those with low diversity (c, g). PCoA of the composition of the faecal microbiota based on unweighted Unifrac distances (d, h). Bar plots of the LDA scores of differentially abundant taxa in the Resp and N-Resp groups as determined by LEfSe analysis (e, i). j-l, Abundances of selected bacterial taxa. (j: family enriched in Resp/N-Resp represented in Fig. 1f; l: bacterial genera previously associated with response to immunotherapy). The ROC analysis (left) and Kaplan–Meier curves for PFS (right) for the enriched bacterial families in Fig. 1f were examined. High/low abundances of the indicated bacterial families in patients were stratified by ROC analysis (k). n = 50 patients. m, Kaplan–Meier curves for the PFS of patients stratified by the median cut-off for each indicated factor. n = 50 patients. n, The correlations between bacteria that were significantly correlated with the clinical course and PD-1 expression by CD8+ T cells are shown. n = 26 patients. (c, g, k, m) Kaplan–Meier curves were analysed by the two-sided log-rank test. (b, f) Two-sided unpaired t test, and data are presented as the median. (j, l) Two-sided Mann–Whitney U test, and data are presented as the median. (d, h) ANOSIM, with one-tailed significance computed by permutation (n = 999 permutations). (n) The correlation was evaluated by two-sided Pearson’s correlation analysis.
Extended Data Fig. 2
Extended Data Fig. 2. FMT from patients influences the diversity and composition of the gut microbiota.
a-g, GF mice transplanted with faeces from Resps or N-Resps were subcutaneously injected with MC38 tumour cells. Experimental scheme (a). Tumour growth curves (b, left: summary, right: each mouse). n = 4–8 mice per group. c-g, The faecal samples were subjected to 16S rRNA gene sequencing to analyse the bacterial composition. The alpha diversity of the gut microbiota was scored by the Shannon index (c). Stacked bar plot of the family-level taxonomic composition of the faeces of Resp-FMT/N-Resp FMT mice. Only families with an abundance of >0.1% are shown (d). Differentially abundant taxa were analysed by LEfSe, the symbol sizes are scaled by relative abundance (e). The bar plot showed the LDA scores of differentially abundant taxa between the Resp and N-Resp groups (f). The relative abundance of Ruminococcaceae (left) and Bacteroidaceae (right)(g). n = 14 mice per group. (b, left), The average tumour sizes of the groups on a certain day of the experiment are shown as dots and are presented as the mean ± SD, two-way ANOVA with the Tukey—Kramer method. Each dot indicates one mouse, and the data are presented as the median (c, g). (c, g) Two-sided unpaired t test. Source Data
Extended Data Fig. 3
Extended Data Fig. 3. Faecal transplantation from patients who responded to PD-1 blockade therapy inhibits tumour progression and augments antitumour immunity.
a-l, ATB-SPF mice were transplanted with faeces from Resp or N-Resp mice following the subcutaneous injection of tumour cells. Experimental scheme (a). Tumour growth curves of MC38 (b, left: summary, right: each mouse) and EMT6 (c, left: summary, right: each mouse) tumour models. n = 5–6 mice per group. d-f, The frequency [representative staining (left) and % summary (right)] of effector molecule expression [PD-1 (d, n = 10) and CD62L/CD44 (e, n = 12)] and cytokine (IFN-γ/TNFα) production (f, n = 12) by CD8+ T cells. g-i, TCR Vβ repertoire of PD-1+CD8+ T cells (g, h). Numbers of skewed TCR Vβ clones (percentages of clones >10%) of PD-1+CD8+ T cells (i). n = 12 mice per group. j-l, The expression [representative staining (left) and MFI summary (right)] of maturation markers [CD86 (j), CD40 (k) and CD80 (l)] by DCs. n = 6 mice per group. (b, left; c, left), The average tumour sizes of the groups on a certain day of the experiment are shown as dots and are presented as the mean ± SD. (d-l) Each dot indicates one mouse, and the data are presented as the mean (i) or mean ± SD (d-f, h, j-l). (b, c) Two-way ANOVA with the Tukey—Kramer method. (d-f, j-l), One-way ANOVA with Bonferroni correction. (i) Two-sided Mann—Whitney U test. Source Data
Extended Data Fig. 4
Extended Data Fig. 4. A bacterium identified from the faeces of Resps is classified as the novel strain YB328.
a, Genome-based phylogenetic tree showing the position of strain YB328 in the family “Acutalibacteriaceae” in the GTDB v220. Species names, strain identifiers and genome sequence accession numbers are presented in the tip labels, if applicable. Scale bar represents 10% amino-acid substitutions per site. b, Abundance of the YB328-related bacteria in: (upper panel) healthy Japanese individuals based on publicly available 16S rRNA gene sequencing data of two cohorts (MORINAGA cohort: n = 704 patients; NIBIOHN cohort: n = 1280 patients), and (lower panel) individuals from 21 countries across the world based on shotgun metagenomics data. For the upper panel, each symbol represents a different dataset. For the lower panel, abundances were calculated as the percentage of metagenomic reads assigned to the YB328 reference genome in our custom GTDB-based database. Text labels on the y-axis indicate the country of origin, and in parentheses the BioProject and the number of datasets included in the analysis. For the box plots, the thick line within each box shows the median, the boxes represent the interquartile range (IQR), and the whiskers extend to the furthest data point within 1.5 times the IQR of the box. c, Faecal samples from patients, excluding MSI-H patients (NSCLC: n = 15; GC: n = 32), were subjected to shotgun metagenomic sequencing. Analyses of the relative abundances of the YB328 using Kraken2+Bracken with a custom version of the GTDB (left panel). High/low bacterial abundance was stratified by a ROC curve analysis (middle panel). Kaplan–Meier curves (right panel) of the PFS of patients with high/low faecal bacterial abundance are shown. d, High/low bacterial abundance of all GC/NSCLC patients (NSCLC: n = 22; GC: n = 49), stratified by the median cut-off value, was used to plot Kaplan–Meier curves of the PFS of patients. e, Experimental scheme (left) and tumour growth curves (middle: summary, right: each mouse). Average tumour sizes of the groups on a certain day of the experiment are shown as dots and are presented as the mean ± SD. n = 4 mice per group. f, YB328 colonisation detected in faecal sample by qPCR, n = 3 mice per group. g, The tumour growth curves are shown. Each line represents one mouse. n = 5–6 mice per group. (c, left panel) Two-sided Mann—Whitney U test and data are presented as the median. (c, right panel; d) Two-sided log-rank test. Source Data
Extended Data Fig. 5
Extended Data Fig. 5. YB328 administration changes the immunological landscape of the TME.
a-g, Experimental scheme (a). The frequency [representative staining (left) and % summary (right)] of effector molecule [perforin (b) and granzyme B (c)] production by CD8+ T cells. The frequency [representative staining (left) and % summary (right)] of Foxp3+ cells in CD4+ T cells (d) and PD-1 expression by Foxp3+CD4+ T cells (e). Expression [representative staining (left) and MFI summary (right)] of the maturation marker CD80 (f) by CD11c+MHCII+ DCs. n = 5–12 mice per group. g, Shannon diversity of microbiota after the administration of the indicated treatment. n = 4–6 mice per group. h-k, Experimental scheme (h). Tumour growth curves (i, n = 5–7 mice per group). Profile of the TCR Vβ repertoire in PD-1+CD8+ T cells (j, n = 5 mice per group). Changes in the Shannon index of microbiota diversity (k, n = 11–12 mice per group). l, The correlation between the abundance of YB328 and the Shannon index of microbiota diversity in all GC/NSCLC patients (NSCLC: n = 22; GC: n = 49) in this study. m, The experimental scheme is shown (left panel). Tumour growth curves (middle panel: summary; right panel: each mouse). n = 3–5 mice per group. n-o, ATB-SPF or N-Resp-FMT recipient mice received the indicated bacterial treatment. Bacterial engraftment was assessed. n = 3–4 mice per group. (b-g, j, k, n-o) Each dot in the summary graphs indicates one mouse in the in vivo experiment. (b-g, j, o) The data are presented as the means ± SD. (m, middle) The average tumour size of the groups on a certain day is shown as a dot. (i, m left panel) Each line indicates one mouse for the in vivo experiment. (l) Each dot indicates one patient. (b-g) One-way ANOVA with Bonferroni’s correction. (k) Two-sided paired t test. (l) The correlation coefficient was evaluated by two-sided Pearson’s correlation analysis. (m) Two-way ANOVA with the Tukey—Kramer method. (o) Two-sided unpaired t test. Source Data
Extended Data Fig. 6
Extended Data Fig. 6. YB328-stimulated BMDCs differentiate into mature CD103+CD11b cDCs and produce CXCL10 to attract CD8+ T cells.
a, BMDCs were stimulated with P. vulgatus or YB328. The expression [representative staining (left) and MFI summary (right)] of the maturation marker CD80. n = 6 wells per group. b, The complexity and size of DCs (n = 30 in each group from Supplementary Video 1) stimulated with YB328 or P. vulgatus were evaluated. A representative correlation model for DCs is shown in the binary image. Scale bar: 10 μm. c, Chemokine production by YB328-, P. vulgatus- or vehicle-treated BMDCs was examined with a proteome profiler chemokine antibody array. Representative data (left) and quantified as fold changes (right) are shown. n = 2 technical replicates. (a) One-way ANOVA with Bonferroni correction. Each dot in the summary graphs indicates one well, and the data are presented as the mean ± SD. (b) Each dot indicates one cell. (c) Data are presented as the mean. Source Data
Extended Data Fig. 7
Extended Data Fig. 7. YB328-stimulated BMDCs deliver robust TCR signals to activate CD8+ T cells.
a-h, OT-I CD8+ T cells were cocultured with bacteria-treated BMDCs pulsed with the indicated antigen peptides (a-d, N4 peptide; e-h, Q4H7 peptide). (a, e), Representative data showing the expression of TCR signalling molecules (p-ZAP70, p-JNK, p-Erk1/2, p-Akt and p-S6K) by CD8+ T cells after stimulation with DCs pulsed with the indicated concentrations of peptides. (b, f), Representative data of PD-1 expression by CD8+ T cells after stimulation with DCs pulsed with the indicated concentrations of peptides. (c, g), Representative data of CD62L/CD44 expression by CD8+ T cells after stimulation with DCs pulsed with the indicated concentrations of peptides. (d, h), Cytokine (IFN-γ and TNFα) production [representative staining (left) and % summary (right)] by CD8+ T cells after stimulation with DCs pulsed with the indicated concentrations of peptides. n = 3–4 wells per group. The data were analysed by a two-sided unpaired t test and presented as the mean ± SD. Source Data
Extended Data Fig. 8
Extended Data Fig. 8. YB328 treatment induces CD103+CD11b cDC generation to augment antitumour immunity of anti-PD-1 mAb.
a, A representative gating strategy for evaluating the progeny of CD103+CD11b cDCs in BMDCs stimulated with YB328, P. vulgatus, or vehicle, corresponding to Fig. 4d. b-c, Representative staining (b) of the phenotype of CD103+CD11b cDCs (% summary: c, left panel) or CD103+ DCs (% summary: c, right panel) in the indicated organs of WT or Batf3−/− MC38 tumour-bearing mice (n = 3). d, Tumour growth curves (n = 6–9). e-f, ATB-SPF mice were subcutaneously injected with MC38 cells and administered an anti-PD-1 mAb, anti-CSF1R mAb or control Ab with/without YB328 treatment. Changes in the immunological landscape are shown (e, n = 3). The experimental scheme (f, upper panel) and tumour growth curves (f, lower-left: summary, lower-right: each mouse) (f, n = 4–7). g, OT-I CD8+ T cells were cocultured with bacteria-treated BMDCs (DC) or BMDMs (MF) pulsed with antigen peptides. The frequency of PD-1 expression [representative staining (left) and % summary (right)] by OT-I CD8+ T cells is shown (n = 5 biologically replicates). (d; f, lower-right) Each line indicates one mouse for the in vivo experiment. The average tumour size of the groups on a certain day is shown as a dot and are presented as the mean ± SD (f, lower-left). Each dot in the summary graphs indicates one mouse in the in vivo experiment, and the data are presented as the mean ± SD (c, e). Each dot in the summary graphs indicates a well, and the data are presented as the mean ± SD (g). (c, e), Two-sided unpaired t test. (f) Two-way ANOVA with the Tukey—Kramer method. (g) One-way ANOVA with Bonferroni’s correction. Source Data
Extended Data Fig. 9
Extended Data Fig. 9. YB328 treatment induces CD103+CD11b cDC generation and sensitises DCs to multiple TLR ligands via MyD88 signalling.
a, The expression of TLRs (TLR1—TLR9) by GALT-isolated DCs was examined (upper panel, experimental scheme). The diversity of the expression of TLRs by DCs was calculated by the Shannon index (lower panel), n = 3–4. IEL: Intraepithelial lymphocyte. b, Tumour growth curves of each mouse in Fig. 4n are shown, n = 5–6. c, The frequency of CD103+CD11b cDCs [representative staining (left panel) and % summary (right panel)] in the indicated organs of WT or MyD88−/− mice (n = 3). d, Assessment of IRF signalling (upper panel) and NF-ĸB activity (lower panel) in TLR reporter THP-1 cells treated with/without YB328 (n = 3–4). e, Tumour growth curves of each mouse in Fig. 4s are shown. (n = 5–6). f, BMDCs were stimulated with YB328 or P. vulgatus at an MOI of 25 and then treated with flagellin. OT-I CD8+ T cells were cocultured with the stimulated BMDCs pulsed with 1 nM N4 peptides. PD-1 expression by CD8+ T cells [representative staining (left panel) and % summary (right panel)] is shown, n = 5. g. Tumour growth curves of each mouse in Fig. 4t. are shown. n = 4–6 mice per group. h, BMDCs were treated with the indicated TLR ligands. The levels [representative staining (left panel) and MFI summary (right panel)] of p-S6K, p-STAT3 and IRF8 are shown (n = 4). i, Tumour growth curves (n = 3–4). j, Tumour growth curves of each mouse in Fig. 4v. is shown. n = 4–6. (b, e, g, i-j) Each line indicates one mouse for the in vivo experiment. (a, c) Each dot in the summary graphs indicates one mouse in the in vivo experiment, and the data are presented as the mean ± SD. (d, f, h) Each dot in the summary graphs indicates a well, and the data are presented as the mean ± SD. (a, c-d), Two-sided unpaired t test. (f, h) One-way ANOVA with Bonferroni’s correction. Source Data
Extended Data Fig. 10
Extended Data Fig. 10. Specific genomic traits and phenotypic features of YB328 are involved in antitumour effects and their responsible factors.
a, BMDCs were stimulated with bacterial strains that were isolated from Resps or were genomically similar to YB328. OT-I CD8+ T cells were cocultured with bacteria-treated BMDCs pulsed with N4 peptides (10 nM). The frequency [representative staining (left) and % summary (right)] of PD-1 expression by CD8+ T cells. n = 3 wells per group. b, Tumour growth curves (left: summary, right: each mouse). n = 3–4 mice per group. c-f, Comparative genomics of YB328 and other six strains (referred to as “Reference strains”) Venn diagram indicating the number of genes unique to YB328 (c). Bar plots of the distribution of genes annotated to different categories according to COG (d), KEGG (e), and VFDB (f). Values were calculated for all genes of YB328 (red bars), genes unique to YB328 (green bars), and the other six strains (blue bars show the mean ± SD). g, BMDCs were treated with each of four cell culture fractions of YB328 [G1: cytoplasm, G2: cell membrane, G3: culture supernatant (without membrane vesicle) or G4: membrane vesicle] and cocultured with OT-I CD8+ T cells stimulated with N4 peptide-pulsed DCs. The expression of the indicated proteins was measured by flow cytometry (n = 3) and normalized between samples. cDC1: CD103+CD11b cDCs. h, Tumour growth curves (upper: summary, lower: each mouse). n = 4–6 mice per group. i-m, BMDCs were stimulated with the indicated bacterial strains. OT-I CD8+ T cells were cocultured with bacteria-treated BMDCs pulsed with N4 peptides (10 nM). Changes in the progeny of the CD103+CD11b population (i). The frequency [% summary (left) and representative staining (right)] of PD-1 expression by CD8+ T cells (j). The expression of IRF8 (k), p-S6K (l) and p-STAT3 (m) in BMDCs. The MFI summary (left) and representative staining (right) are shown. n = 3–4 wells per group. (a, i-m) Each dot indicates one well for the in vitro experiment in the summary data. (b, left; h, upper) The average tumour sizes of the groups on the day of the experiment are shown as dots and are presented as the mean ± SD. (b, right; h, bottom) Each line represents one mouse. (a, i-m) Data are presented as the mean ± SD. (i-m) One-way ANOVA with Bonferroni correction. (h) Two-way ANOVA with the Tukey–Kramer method. Source Data
Extended Data Fig. 11
Extended Data Fig. 11. YB328 treatment increases CD103+CD11b cDCs in tumour-related tissues to activate CD8+ T cells.
a-c, ATB-SPF mice were subcutaneously injected with MC38 cells and treated with the indicated bacteria. The phenotype and frequency [representative staining (left) and % summary (right)] of DC populations in the indicated organs were examined: NdLNs (a) and SPs (b). n = 4–6 mice per group. TCF-1 expression by PD-1+CD8+ T cells in the indicated organs after the indicated treatment. Representative staining (upper) and % summary (lower) (c). d-g, KikGR mice pretreated with ATB were injected subcutaneously with MC38 cells and treated with the indicated bacteria. Before bacterial treatment, KikGR mice were surgically photoconverted. Migratory intestinal cells that expressed KikR+ were profiled in the indicated organs. The frequency [representative staining (left) and % summary (right)] of KikR+CD103+CD11b DCs (d), KikR+PD-1+CD8+ T cells (e), KikR+Foxp3+ T cells (f) and KikR+CD11b+ cells (g) among CD45+ cells. n = 3–6 mice per group. h, WT GF mice were subcutaneously injected with MC38 cells and were administered an anti-PD-1 mAb with YB328 treatment. Faeces were collected after the 24 h of the first administration of YB328. Tumour were collected at days 20. The presence of YB328 was examined. n.d., not detected. n = 7 mice per group. Each dot in the summary graphs indicates one mouse. All the data are presented as the mean ± SD. (a, b, d-g) Two-sided unpaired Student’s t test. Source Data
Extended Data Fig. 12
Extended Data Fig. 12. The abundance of YB328 is associated with the response to anti-PD-1 therapy in human cancers.
a-c, Representative images of multiplex immunohistochemical staining of tumours from GC patients (a) and the calculated density of immune cells. Correlations between the relative abundance of YB328 in the gut microbiota and the density of CD206+ cells (left) or CD14+ cells (right) (b, n = 20). Correlations between PD-1+CD8+ T cells and CD206+ cells (left panel) or CD14+ cells (right panel) infiltration (c, n = 24). The correlation coefficient was evaluated by two-sided Pearson’s correlation. Scale bar: 200 μm. d, YB328 abundance in faeces from patients in the validation cohort (n = 21; NSCLC:7; GC:14). e, High/low YB328 abundance was stratified by a ROC curve analysis (left panel) Kaplan—Meier curves for the PFS of patients with high/low YB328 abundance in the validation cohort (right panel). f, Relative abundance of the YB328 phylotype in the HNSCC cohort (n = 16). g, h, Relative abundance of the YB328 phylotype (g, h), and Akkermansia (g) in faecal samples across datasets from multiple cohorts. [g: MONSTAR cohort (MM n = 16; RCC n = 44; GC n = 32; EC n = 29), h: Routy et al. (n = 20)]. A pseudocount was added for visualization purposes, and the boxplots denote the median with a interquartile range, and the whiskers extend to the furthest data point within 1.5 times the interquartile range (g). i, ATB-SPF mice were subcutaneously injected with B16F10-OVA cells, and OT-I CD8+ T cells were transferred with/without YB328 treatment. Experimental scheme (upper). Tumour growth curves (lower left: summary, mean ± SD; lower right: each mouse). The graph shows representative data from two independent experiments. n = 3–4 mice per group. j, k, Graphical summaries of the mechanism by which the gut microbiota augments the antitumour efficacy of PD-1 blockade therapy. (k) was created using BioRender (https://www.biorender.com). Data are presented as the median (d) or mean ± SD (f). (b-d, f-h) Each dot indicates one patient. (d, f, g) Two-sided Mann–Whitney test. (e, right) Two-sided log-rank test. (h) Two-sided paired t test. (i) Two-way ANOVA with the Tukey–Kramer method. Source Data

References

    1. Routy, B. et al. Gut microbiome influences efficacy of PD-1-based immunotherapy against epithelial tumors. Science359, 91–97 (2018). - PubMed
    1. Gopalakrishnan, V. et al. Gut microbiome modulates response to anti-PD-1 immunotherapy in melanoma patients. Science359, 97–103 (2018). - PMC - PubMed
    1. Matson, V. et al. The commensal microbiome is associated with anti-PD-1 efficacy in metastatic melanoma patients. Science359, 104–108 (2018). - PMC - PubMed
    1. Sivan, A. et al. Commensal Bifidobacterium promotes antitumor immunity and facilitates anti-PD-L1 efficacy. Science350, 1084–1089 (2015). - PMC - PubMed
    1. Vetizou, M. et al. Anticancer immunotherapy by CTLA-4 blockade relies on the gut microbiota. Science350, 1079–1084 (2015). - PMC - PubMed

MeSH terms