. 2025 Jul 15;15(1):25454.
doi: 10.1038/s41598-025-11164-x.

Identification of host cell surface proteins inhibiting furin dependent proteolytic processing of viral glycoproteins

Affiliations

Identification of host cell surface proteins inhibiting furin dependent proteolytic processing of viral glycoproteins

Nathalia Williams et al. Sci Rep. .

Abstract

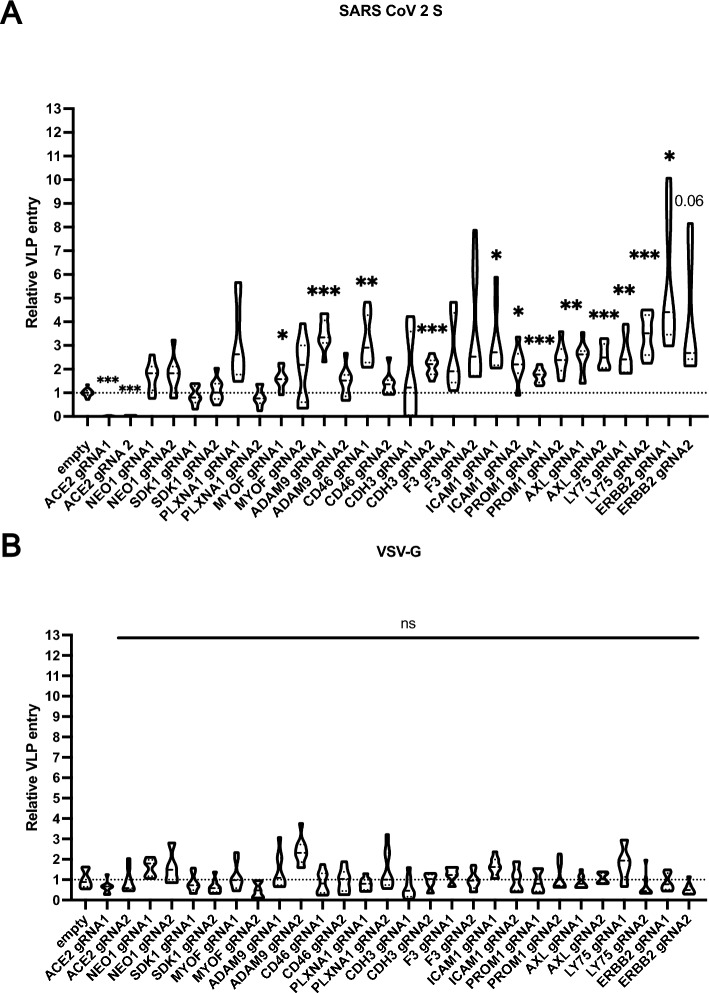
Proteolytic cleavage by furin-like proteases is a crucial first step in the posttranslational modification of various glycoproteins found in enveloped emerging viruses, such as SARS-CoV-2 and highly pathogenic avian influenza A viruses (IAV). Here, we explored the capacity of host cell proteins identified by cell surface proximity ligation to limit the proteolytic cleavage of the SARS-CoV-2 spike and the IAV H5N1 hemagglutinin (HA). When co-expressed with recombinant SARS-CoV-2 spike protein, Prom1, Axl, and Ly75 suppress its proteolytic cleavage, whereas cleavage of HA was only reduced by Prom1. Co-immunoprecipitation assays suggest that Axl and Prom1 may form a complex with furin. Alteration of Prom1, Axl and Ly75 expression levels in Calu3 cells affected entry of SARS-CoV-2 S pseudotyped VLP and to a lesser extent, SARS-CoV-2 virions. In contrast, Prom1 levels did not affect entry of H5N1 VLPs or H5N1 virions. Our data highlight the differential capacity of SARS-CoV-2 and IAV H5N1 to cope with newly identified host restriction factors of furin activity.


Figures

Fig. 1
Fig. 1
Cell surface proximity ligation. (A) Biotinylated proteins were pulled down with streptavidin beads on Calu3 cells post cell surface proximity ligation. Proteins were probed with a streptavidin-HRP. (B) Venn diagram indicating number of proteins found in the individual and the overlap between the two Calu3 mass spectrometry experiments. (C) GO cluster of the identified proteins to indicate their function in viral receptor and entry. Count refers to the number of proteins annotated in a particular network over the total number of proteins in this network. Strength (indicator of enrichment) indicates the ratio of proteins from the network assigned to a term over the expected number of proteins assigned to a random network of equal size. (D) String network of the 36 proteins found in the two mass spectrometry experiments.
Fig. 2
Fig. 2
SARS-CoV-2 S and VSV-G pseudotyped VLP entry into Calu3 KO cells. (A) SARS-CoV-2 pseudotyped VLP entry in Calu3 cells transduced with lentiviral CRISPR/Cas9 guide RNAs (2 per target). ACE2 was used as a positive control. (B) VSV-G pseudotyped VLP entry in Calu3 cells transduced with lentiviral CRISPR/Cas9 guide RNAs (2 per target). The results are shown in fold change to control in relative light units. P values were calculated with Brown Forsythe and Welch ANOVA (* < 0.05, ** < 0.01, *** < 0.001).
Fig. 3
Fig. 3
Effect of target proteins on spike cleavage. Cell lysates were separated by SDS-PAGE and analyzed by western blot depicting the expression of target proteins and SARS-CoV-2 S (both the full-length spike, S and the cleaved spike subunit, S2). The lysates were obtained post-transfection of a spike plasmid (pTwist-EF1α-nCoV2019-S-2xStrep) and the cDNA plasmids of the target proteins in HEK 293T cells depicted from A–D. The blots are indicated for the presence and absence of the different plasmids by – and + signs. Co-transfection experiments with AXL, LY75, PROM1, ERBB2 and ICAM1 are shown with one representative out of three experiments. Equal loading was confirmed by probing for beta actin.
Fig. 4
Fig. 4
Effect of target proteins on H5N1 HA cleavage. (A) Cell lysates of transfected HEK 293T cells were separated by SDS-PAGE and analyzed by western blot for HA0 (uncleaved) and HA2 (cleaved) via a C-terminal flag epitope tag. A HA variant with monobasic or multibasic cleavage site were co-expressed with indicated host proteins in HEK 293T cells. One representative blot out of three experiments is shown. Equal loading was confirmed by probing for beta actin. (B) Western blot control for overexpression of the 4 restriction factors tested in panel (A). (C) Quantification of band intensity from three independent coexpression experiments as depicted in panel A. Values are normalized to the respective control condition for HA with monobasic (left) or multibasic (right) cleavage site. Statistical significance was determined by multiple one-way ANOVA testing. P values for indicated sample pairs are provided.
Fig. 5
Fig. 5
Co-immunoprecipitation of furin with the target proteins. Cell lysates were obtained post co-transfection of the human furin plasmid with the cDNAs of AXL, LY75 or PROM1 in 293T cells (Whole cell lysate, WCL) and also post immunoprecipitation with flag beads that bind to the human furin plasmid to pull down interacting partners (IP). The lysates were separated on SDS-PAGE and analyzed by western blot depicting the expression of target proteins and human furin. Beta-actin was used as a loading control for the WCL. One representative of three experiments is shown for AXL, LY75 and PROM1.
Fig. 6
Fig. 6
Bimolecular fluorescence complementation assay (BiFC) to study syncytium formation. (A) Schematic representation of the BiFC assay. VeroE6 cells expressing spike protein in the presence of a monomer of the GST and on the other side Vero E6 cells expressing TMPRSS2 and ACE2 proteins with the other monomer of the GST protein. These cells combined will result in the formation of multi-nucleated cells referred to as syncytia which can be visualized by GFP signal using ImageXpress microscope. (B) The BiFC experiment was performed with cells expressing AXL, along with the spike protein or with the TMPRSS2 and ACE2 (shown in Table 1). Two biological replicates are shown with triplicates per biological replicate. One-way ANOVA was performed as a statistical test. (C) The BiFC experiment was performed with cells expressing PROM1, along with the spike protein or with the TMPRSS2 and ACE2 (shown in Table 1). Two biological replicates are shown with triplicates per biological replicate. One-way ANOVA was performed as a statistical test.
Fig. 7
Fig. 7
Interferon and SARS-CoV-2 infection regulate target protein expression. (A) Wild-type Calu3 cells were treated with Interferon α and γ at different concentrations (100 U/ml and 1000 U/ml), for 24h and cell lysates were separated by SDS-PAGE and analyzed by western blot. The target protein expressions are depicted PROM1 and AXL. Beta-actin was probed as a loading control. Phosphorylation of STAT1 (pSTAT1) is also indicated to verify interferon activity. (B) Cell lysates were separated by SDS-PAGE and analyzed by western blot to show the expression of the target proteins 24 h post infection with Wuhan B.1 or Omicron BA.1 at an MOI of 1. The SARS-CoV-2 N protein was probed to verify infection and beta-actin was probed for loading control. A representative of three experiments is shown. (C) Quantification of target proteins as shown in (A) in Calu3 cells treated with Interferon α and γ at different concentrations for 24 h. Three biological replicates are shown in the graph. One-Way ANOVA statistical test was performed to compare the Calu3 control cells with the target proteins. (D) Quantification of target proteins as shown in (B) in Calu3 cells infected with Wuhan B.1 and Omicron BA.1 at an MOI of 1 for 24 h. Three biological replicates are shown in the graph. One-Way ANOVA statistical test was performed to compare the Calu3 control cells with the target proteins.
Fig. 8
Fig. 8
Omicron BA.1 virus replication in Calu3 KO cells. (A) Plaque assay results between the Control and the AXL KO cells 72 h post infection with Omicron BA.1 at an MOI of 1 are shown. (B) Plaque assay results between the Control and the PROM1 KO cells 72 h post infection with Omicron BA.1 at an MOI of 1 are shown. A paired t-test was performed as a statistical test.

Similar articles

References

    1. Desai, N. et al. Temporal and spatial heterogeneity of host response to SARS-CoV-2 pulmonary infection. Nat. Commun.11, 6319. 10.1038/s41467-020-20139-7 (2020). - PMC - PubMed
    1. Hoffmann, M. et al. SARS-CoV-2 cell entry depends on ACE2 and TMPRSS2 and is blocked by a clinically proven protease inhibitor. Cell181, 271–280. 10.1016/j.cell.2020.02.052 (2020). - PMC - PubMed
    1. Thomas, G. Furin at the cutting edge: From protein traffic to embryogenesis and disease. Nat. Rev. Mol. Cell Biol.3, 753–766. 10.1038/nrm934 (2002). - PMC - PubMed
    1. Crits-Christoph, A. et al. Genetic tracing of market wildlife and viruses at the epicenter of the COVID-19 pandemic. Cell187, 5468–5482. 10.1016/j.cell.2024.08.010 (2024). - PMC - PubMed
    1. WHO COVID-19 dashboard (2024).

MeSH terms

LinkOut - more resources