. 2025 Jul 14;15(1):25429.
doi: 10.1038/s41598-025-10850-0.

Long-term benefits of TUDCA supplement in ARSACS zebrafish model

Affiliations

Long-term benefits of TUDCA supplement in ARSACS zebrafish model

Valentina Naef et al. Sci Rep. .

Abstract

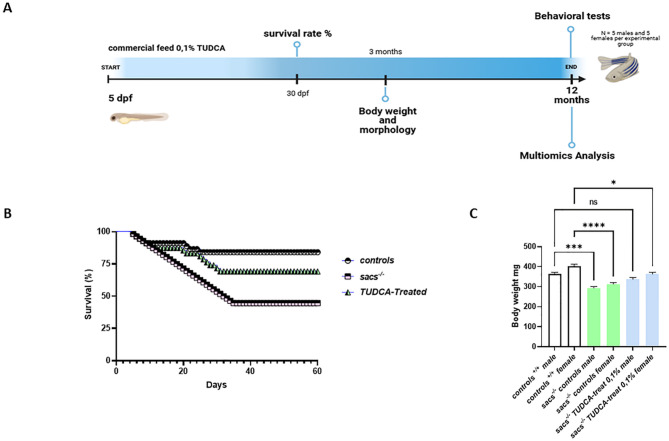
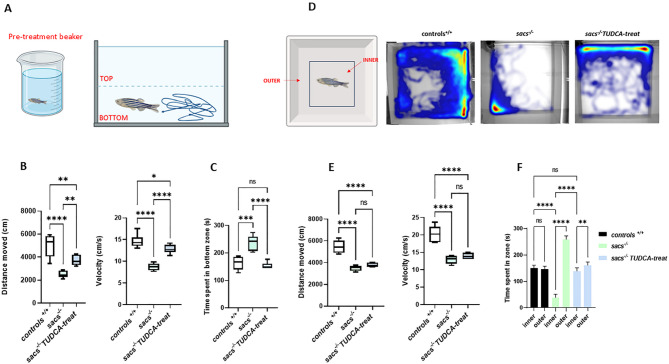
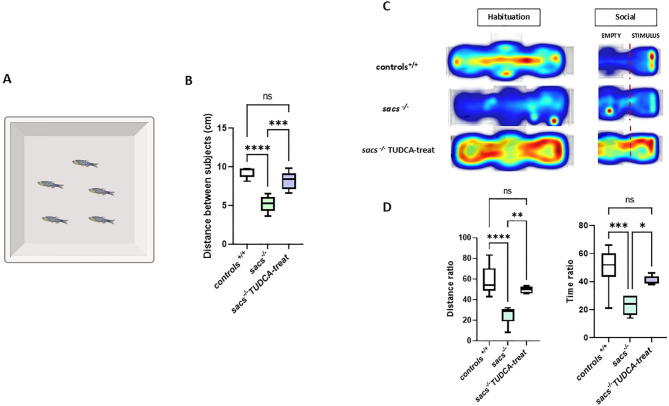
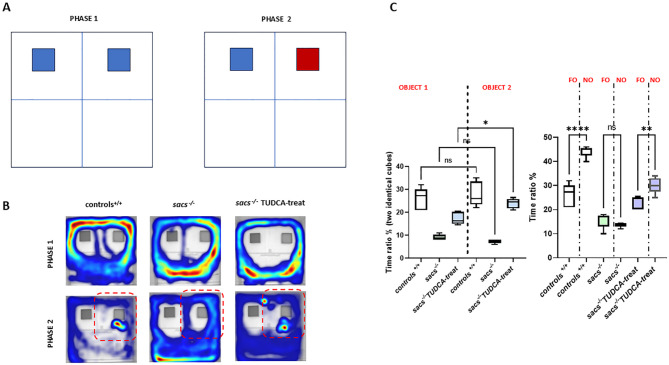
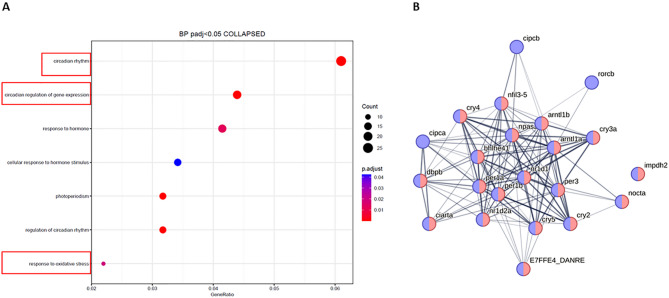
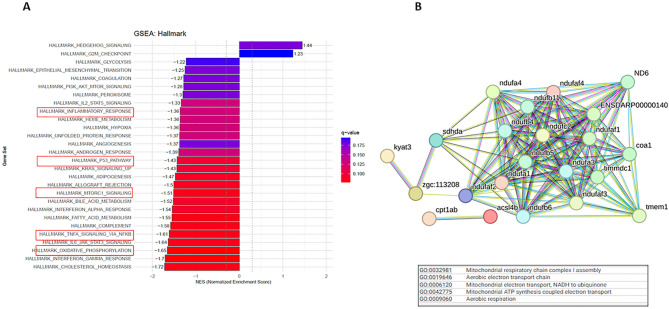
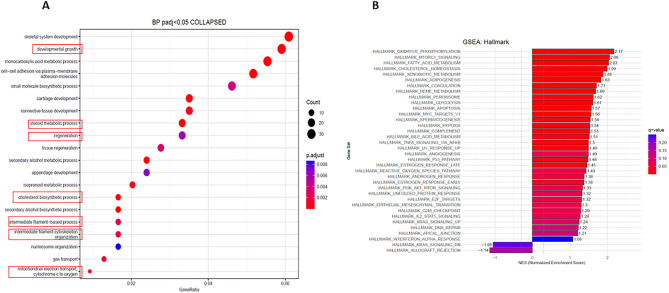
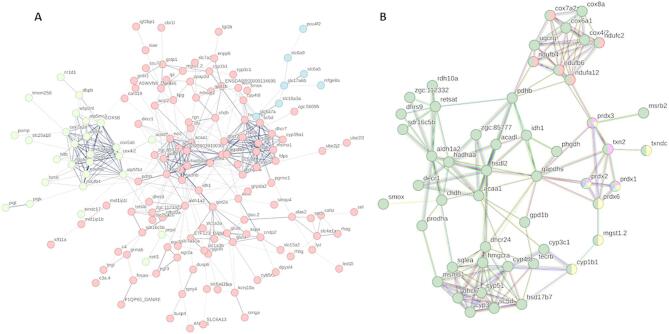
Autosomal recessive spastic ataxia of Charlevoix-Saguenay (ARSACS) is an early-onset neurodevelopmental and neurodegenerative disorder characterized by ataxia, spasticity, and peripheral neuropathy. However, several studies have highlighted that some patients also experience cognitive, emotional and social deficits, suggesting a more complex clinical picture that extends beyond motor symptoms. Building on these findings, this study aimed to: (i) investigate locomotor, social and cognitive deficits in adult sacs-/- zebrafish versus wild-type (WT) controls through behavioural tests; (ii) identify molecular patterns associated with the adult disease phenotype using transcriptomic and proteomic analyses of sacs-/- and WT brains; (iii) evaluate the effectiveness of long-term treatment with tauroursodeoxycholic acid (TUDCA) on behavioural outcomes and omics profiles in the zebrafish sacs-/- model. Our findings indicate impairments in cognitive, social, and emotional behaviors in aged sacs-/- zebrafish, which resemble some deficits observed in human patients. Transcriptomic and proteomic analyses of adult brains identified alterations in genes related to circadian rhythms and neuroinflammation. Notably, disruptions in sleep and circadian rhythms are frequently reported in individuals with cerebellar ataxia and may contribute to cognitive and behavioral changes. Long-term treatment with TUDCA, a neuroprotective molecule, was associated with partial improvements in social and cognitive behaviors and modifications in omics profiles in the zebrafish model. These results support the potential of further exploring TUDCA in future preclinical and clinical studies, while also emphasizing the need for additional investigations to better understand its mechanisms of action.

Keywords: ARSACS; Ataxia; Neurodegeneration; TUDCA; Zebrafish.


Conflict of interest statement

Declarations. Competing interests: The authors declare no competing interests. Ethics approval: This study does not include human samples. All animal procedures were authorized by the University of Pisa Animal Ethics Committee and the Italian Ministry of Health (n° 620/2024-PR). The study is reported in accordance with ARRIVE guidelines.

Figures

Fig. 1
Fig. 1
(A) Experimental timeline. Images were created using BioRender, a scientific image and illustration software. Effects of the TUDCA-supplemented diet treatment on the survival rate and growth of juvenile and adult zebrafish modelling ARSACS. (B) Kaplan-Meier survival comparison among groups, showing a significant effect of TUDCA in sacs−/− treated fish (log-rank (Mantel-Cox) test) ***p < 0.001. (C) Data are presented as mean ± S.E.M. (N = 5 males and 5 females per experimental group). Statistical significance was determined using one-way ANOVA followed by Tukey’s multiple comparison test: ns (not significant), *p < 0.05, ***p < 0.001, **** p < 0.0001.
Fig. 2
Fig. 2
(A) Zebrafish locomotor activity and anxiety-like behaviour during a 5-minute novel tank test. (B) Total distance travelled (cm) and average speed while moving (cm/s). (C) Time (s) spent in the bottom half of the tank (below dotted line). (D) Schematic diagram of the open-field test and thigmotaxis test in adult zebrafish and heat maps. In the analysis of thigmotaxis test, the area of the peripheral zone is equal to the central zone. Single adult fish were placed in an open-field apparatus for 5 min, to quantify their exploration and analyse its pattern. (E) Total distance travelled (cm) and average speed while moving (cm/s). Data are presented as box plots, where the central line represents the median, the box indicates the interquartile range (IQR), and the whiskers extend to 1.5 times the IQR. (F) Average time spent in zones. Data are presented as mean ± S.E.M. *p < 0.05, **p < 0.01, ***p < 0.001, and ****p < 0.0001 were calculated by ANOVA followed by Tukey’s multiple comparison test. ns, no significant difference. Images were created using BioRender, a scientific image and illustration software. (N = 5 males and 5 females per experimental group)
Fig. 3
Fig. 3
(A) Shoaling test. The test involves placing a group of conspecific fish in a novel tank for 5 min, after an acclimatization time. (B) The shoal is video recorded for behavioural analysis, and to quantify social cohesion, which is measured by the average mean distance between members of the group. (C) The heat maps show that control zebrafish exhibited a significantly higher frequency of proximity to a group of zebrafish compared with sacs−/− zebrafish. Furthermore, pretreatment with TUDCA improved the sociability of sacs-deficient fish compared with untreated mutant fish. (D) [(Distance Ratio% = distance travelled in the conspecific sector /by the total distance travelled) ×100] and [(Time Ratio %=Time spent in conspecific sector/ total time observed) ​ ×100]. Data are presented as box plots, where the central line represents the median, the box indicates the interquartile range (IQR), and the whiskers extend to 1.5 times the IQR. (N = 5 males and 5 females per experimental group). *p < 0.05, **p < 0.01, ***p < 0.001 and ****p < 0.0001 were calculated by ANOVA followed by Tukey’s multiple comparison test. ns, no significant difference. Images were created using BioRender, a scientific image and illustration software.
Fig. 4
Fig. 4
(A) Schematic diagram of the novel object recognition test. (B) The heat map shows that adult sacs−/− zebrafish fed with TUDCA exhibited a significant preference for exploration of the novel object, similar to adult controls. Instead, untreated adult sacs−/− zebrafish did not show a preference between the familiar and novel object. (C) The exploration time of each object (%) was analyzed during training between two identical objects 1 and 2 and between the new object (NO) and the familiar object (FO) in the test session. Data are presented as box plots, where the central line represents the median, the box indicates the interquartile range (IQR), and the whiskers extend to 1.5 times the IQR. (N = 5 males and 5 females per experimental group). ns, no significant difference, *p < 0.05, **p < 0.01, ***p < 0.001 and ****p < 0.0001 were calculated by ANOVA followed by Tukey’s multiple comparison test.
Fig. 5
Fig. 5
(A) The top 20 enriched GO biological process categories were plotted. (B) Protein-protein interaction analysis using the STRING bioinformatic suite (https://string-db.org/) revealed an enrichment of genes associated with circadian rhythms. Network nodes represent proteins involved in rhythmic processes (blue) and circadian rhythms (red). The edges represent protein-protein associations, with thickness indicating the strength of data support. PPI enrichment p-value:< 1.0e-16.
Fig. 6
Fig. 6
(A). GSEA in adult sacs−/− zebrafish brains compared with WT. (B) Protein-protein interaction analysis using the STRING bioinformatic suite (https://string-db.org/) revealed an enrichment of down-regulated genes associated with mitochondrial function. Network nodes represent proteins and each node represents all the proteins produced by a single, protein-coding gene locus. The edges represent protein-protein associations, with thickness and colors indicating the strength of data support. PPI enrichment p-value:< 1.0e-16.
Fig. 7
Fig. 7
(A) The top 20 enriched GO biological process categories were plotted. (B). GSEA in the brains of TUDCA-treated sacs vs. WT adult sacs−/− zebrafish.
Fig. 8
Fig. 8
Protein-protein interaction analysis using the STRING bioinformatic suite (https://string-db.org/) in the brains of treated vs. untreated adult sacs−/− zebrafish. (A) “Lipid Metabolism” (highlighted in red), “Oxidative Phosphorylation” (highlighted in green) and “Neurotransmitter and Synaptic Transmission” (highlighted in blue). (B) “Oxidative activity/removal of superoxide radical” (highlighted in green), “cell redox homeostasis” (highlighted in pink/yellow), “mitochondrion organization” (highlighted in red). Network nodes represent proteins and each node represents all the proteins produced by a single, protein-coding gene locus. The edges represent protein-protein associations, with thickness indicating the strength of data support. PPI enrichment p-value:< 1.0e-16.

Similar articles

References

    1. Bouhlal, Y., Amouri, R., Euch-Fayeche, E., Hentati, F. & G. & Autosomal recessive spastic ataxia of Charlevoix–Saguenay: An overview. Parkinsonism Relat. Disord. 17, 418–422 (2011). - PubMed
    1. Engert, J. C. et al. ARSACS, a spastic ataxia common in Northeastern québec, is caused by mutations in a new gene encoding an 11.5-kb ORF. Nat. Genet.24, 120–125 (2000). - PubMed
    1. Anderson, J. F., Siller, E. & Barral, J. M. The neurodegenerative-disease-related protein sacsin is a molecular chaperone. J. Mol. Biol.411, 870–880 (2011). - PubMed
    1. Anderson, J. F., Siller, E. & Barral, J. M. The Sacsin repeating region (SRR): A novel Hsp90-Related Supra-Domain associated with neurodegeneration. J. Mol. Biol.400, 665–674 (2010). - PubMed
    1. Ali, Z. et al. Novel SACS mutations associated with intellectual disability, epilepsy and widespread supratentorial abnormalities. J. Neurol. Sci.371, 105–111 (2016). - PubMed

MeSH terms

Substances

LinkOut - more resources