. 2025 Aug;28(8):1598-1609.
doi: 10.1038/s41593-025-01987-2. Epub 2025 Jul 14.

An expanded subventricular zone supports postnatal cortical interneuron migration in gyrencephalic brains

Affiliations

An expanded subventricular zone supports postnatal cortical interneuron migration in gyrencephalic brains

JaeYeon Kim et al. Nat Neurosci. 2025 Aug.

Abstract

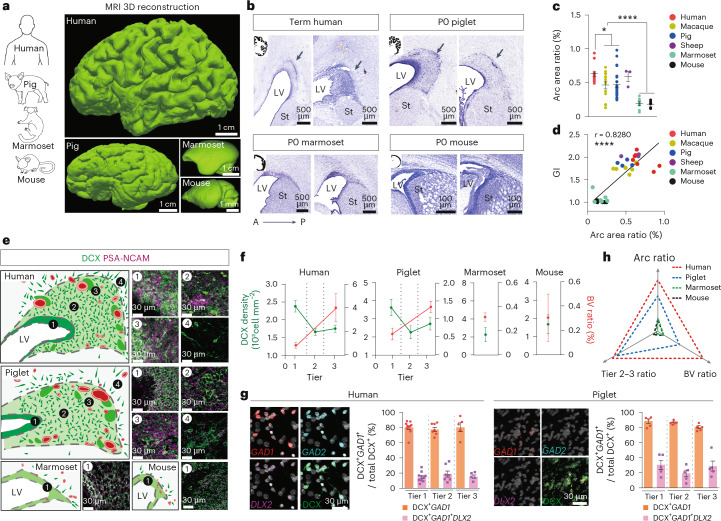
Cortical GABAergic interneurons generated in the ventral developing brain travel long distances to their final destinations. While there are examples of interneuron migration in the neonatal human brain, the extent of postnatal migration across species and how it contributes to cortical interneuron composition remains unknown. Here we demonstrate that neonatal gyrencephalic brains, including humans, nonhuman primates and piglets, harbor an elaborate subventricular zone, termed the Arc, due to its curved morphology and expanded neuroblast populations. The Arc is absent in lissencephalic marmoset and mouse brains. Transcriptomic and histological approaches revealed that Arc neurons are diverse interneurons from the medial and caudal ganglionic eminences that migrate into the frontal, cingulate and temporal cortex. Arc-cortical targets exhibit an increase in VIP+ neuronal density compared to other regions. Our findings reveal that the Arc is a developmental structure that supports the expansion of postnatal neuronal migration for cortical interneuron patterning in gyrencephalic brains.


Conflict of interest statement

Competing interests: The authors declare no competing interests.

Figures

Fig. 1
Fig. 1. Arc structure is identified in neonatal gyrencephalic brains.
a, MRI 3D reconstruction of the postnatal human, pig, marmoset and mouse brains. Two gyrencephalic brains (human at birth (term) and P0-aged piglet) and two lissencephalic brains (marmoset at 4.5 years of age and mouse at birth). b, Nissl-stained serial sections across species taken at birth. Black arrows indicate a cell-dense region extending dorsally from the lateral ventricle. c, Quantification of Arc area relative to total brain area (Arc area ratio, %) by Nissl staining at birth. Two-tailed unpaired t test (*P = 0.0268, ****P < 00001). The data are presented as mean ± s.e.m. Sample size is provided as source data. d, Correlation (Pearson’s r) between GI with the Arc area ratio across species (r = 0.8291, ****P < 0.0001). e, Arrangement of DCX+ cells (green) near the ventricular wall across species. Insets 1–4 (right of schematic) show confocal images of DCX+-enriched regions. Blood vessels are shown in red; dark green clusters correspond to DCX+ cellular densities. f, Quantification of DCX+ cells near the ventricular wall (green line). Quantification of BV areas, labeled by alpha smooth muscle actin (α-SMA), relative to total Arc area (BV ratio, %, red line) across species. The data are presented as mean ± s.e.m. Human (n = 4), piglet (n = 3), marmoset and mice (each n = 2). g, Left, confocal microscopy of single molecule fluorescence in situ hybridization (smFISH) for RNA expression of GABAergic-neuron markers (GAD1, GAD2 and DLX2) in the neonatal human and piglet brain. DCX protein expression was codetected. Right, quantification of DCX+ GAD1+ cells of all DCX+ cells across tiers. Data means ± s.e.m., n = 2 individuals (each species) in three independent experiments. Sample size is provided as source data. h, Triangle plot showing a comparison of core Arc features across species. All values are normalized to humans (raw values are shown as source data), and two-way MANOVA analysis is shown in Supplementary Table 2. Red dotted line (human), blue dotted line (piglet), green dotted line (marmoset) and black dotted line (mouse). LV, lateral ventricle; St: striatum; BV, blood vessel. Source data
Fig. 2
Fig. 2. Diverse immature GABAergic neurons within the Arc.
a, Schematic representation of snRNA-seq analysis from the human Arc at GW 30–39. b, Clustering of individual nuclei and visualized by UMAP. Annotation of 15 cell types based on gene expressions (see source data for details). c, The gene expression profile of well-known marker genes is visualized via UMAP. Cells are colored according to gene expression levels (purple, high; gray, low). d, Schematic representations of the dissected regions of the human brain across the trimesters. The primary sites of interneuron generation, MGE, LGE and CGE in the first trimester. The VZ and neocortical regions in the second trimester. The Arc and neocortical regions in the third trimester. e, The cells of human ganglionic eminences (GEs), inhibitory cells of the developing VZ including Arc and developing neocortex are integrated and visualized by UMAP. f, The proportion of the nuclei from cell types across regions (top) and ages (down). g, Sankey diagram illustrating the origins and fates of the immature interneurons in the Arc. h, Left, the pseudotime of interneurons visualized by UMAP. Right, MGE-cortical trajectories (top) and CGE-cortical trajectories (bottom) are inferred from Monocle3. i,j, Left, subpopulations of DCX+ cells in the neonatal human (i) and piglet (j) Arc express different TF enriched in ventral telencephalic origins, immunostained with NKX2.1, LHX6, COUP-TFII and SP8. Right, quantification of DCX+ cells expressing the selected TFs. Two-way unpaired t test (**P = 0.0027, ****P < 0.0001). The data mean ± s.e.m. of counts performed on three individual cases (n = 3) in five independent experiments. Sample size and P values are provided as source data. k, Heatmap of distribution of DCX+ cells expressing different TFs across tiers. The color gradient represents TF expression levels from high (red) to low (blue), as quantified from the counts performed on each species. m, Schematic representation of the spatial distribution of molecularly distinct DCX+ cells in the neonatal human and piglet Arc. TF, transcription factors. Source data
Fig. 3
Fig. 3. The Arc provides dorsal and ventral cortical streams of migratory neurons.
a, Three-dimensional reconstruction of light sheeting imaging of a clarified P0 piglet brain with a 2.3 mm thickness (13 × 16 × 2.3 mm). b, Two-dimensional image is a z projection of the 3D image from a. The green signal is DCX immunolabeling. The arrows indicate multiple streams of DCX+ cells from the Arc. c, Left, schematic of coronal section of the P0 piglet brain. Right, DCX+PSA-NCAM+ neurons as individual neurons in the dorsal Arc (i) and as cell clumps in the ventral Arc (ii). d, Experimental design for time-lapse imaging of the P0 piglet brain. e, Left, sequential images of time-lapse confocal microscopy showing GFP+ cells in the dorsal region (top) and the ventral region (bottom) of the piglet Arc. White arrows highlight GFP+ cells near the Arc. Right, confocal image of GFP+DCX+ cells after 72 h of imaging. f, Distribution of mean migratory speeds measured for the two populations of GFP+ cells from the dorsal region (n = 21 cells; gray) and ventral region (n = 20 cells, blue). n = 3 individuals (e,f) in three independent experiments. gi, Mapping of DCX+ cells (green) in the P0 piglet brain (g), the term human coronal sections (h), at a plane that corresponds to (iv in g), and the P0 marmoset brain (i). j, Experimental design of extended time-lapse imaging performed on P0 pig brain slices. k, Confocal images of GFP+DCX+ cells in the dorsal (top) and ventral (bottom) regions at 12 and 21 DIV. White arrows indicate GFP+DCX+ cells. (i) and (ii) indicate dorsal and ventral regions, respectively, in d and j. l, Quantification of GFP+DCX+ cell density in the dorsal and ventral regions at 12 and 21 DIV. Two-way unpaired t test (*P = 0.0234). Data means ± s.e.m. of counts performed on n = 3 cases in three independent experiments. m, Quantification of DCX+ cell density in dorsal and ventral regions across different postnatal ages of the pig, equivalent to regions analyzed in j. This experiment has been repeated three times (ac and e).
Fig. 4
Fig. 4. Regionally distinct gene expression patterns for migratory neurons in postnatal cortical streams.
a, Left, schematic representation indicating the postnatal migratory streams analyzed for profiling cellular subtypes in the P2 piglet brain—dorsal migratory streams into the anterior and posterior CC from the Arc (i), ventral streams into the PirC from the Arc (ii) and ventral streams into the TC from the Arc (iii). Right, schematic representation showing the experimental design for P2 piglet spatial transcriptomics. b, Left, smFISH confocal images of each stream showing examples of DCX+ cells expressing GAD1, NKX2.1, LHX6, MAF1, PROX1, COUP-TFII, SCGN, SP8 and PAX6, which are associated with GE. Right, smFISH confocal images of each cortical region showing examples of heterogeneous interneuron types expressing GAD1, CALB2, VIP, SST and CXCR4. Scale bars, 25 µm. c, UMAP projections colored by cell identity. n = 1,992 DCX+ cells (see source data for details). d, Topographic mapping of migratory neuron subtypes in each stream. From bottom to top shows the migratory stream from the Arc to their final cortical region, that is, CC (left), PirC (middle) and TC (right). e, Nearest neighbor analysis in dorsal and ventral migratory streams. The gray line indicates a significant interaction between cell subtypes. The line thickness is correlated with the distance between the cell subtypes. Colored circles represent each cell subtype. A larger circle size indicates a higher number of cells within the cell subtype. The ventral streams show a higher interaction between cell subtypes. f, Dot plot illustrating gene expression pattern for receptors for neuronal migration across subtypes. g, Dot plot illustrating gene expression pattern for receptors across individual and clump migrating cells. h, Coronal images of a human 39 GW showing dorsal and ventral migratory streams of, primarily, COUP-TFII+SP8+DCX+ migratory neurons from the Arc. i, White arrows indicate COUP-TFII+SP8+ clumps in the ventral stream expressing VLDLR. White arrows indicate individually migratory cells expressing LHX6, SST and CXCR4 in the dorsal stream. This experiment has been repeated three times (hj). Source data
Fig. 5
Fig. 5. VIP+ cortical interneurons are expanded in the adult cingulate and temporal cortex.
a, The integration of the datasets of human Arc at GW 30–39, human neocortex at GW 17–41 and human adult neocortex and visualization by UMAP. The dotted lines indicate the adult cortical interneuron subtypes. b, Sankey diagram illustrating the average fate probabilities of the immature MGE- and CGE-associated interneurons in the Arc. c, SST+LHX6+ neurons in the neonatal human CC WM and VIP+COUP-TFII+ neurons in the developing human STG. This experiment has been repeated three times. d, Schematic representation of the coronal section of the adult human brain, ranging from 15 to 25 years old. Red dot-boxed areas indicate the cortical layers of the CC and STG, a part of the TC. e, The distribution of interneuron subtypes within the cortical layers visualized by immunostaining. f, The density of each population across the cortex. Two-tailed unpaired t test (VIP, **P = 0.0027; ****P < 0.0001. PV, CC vs OC, *P = 0.0128; STG vs OC: *P = 0.0226. SST, **P = 0.0050; ****P < 0.0001). The data are presented as mean ± s.e.m. of counts performed on n = 1 cases in five independent experiments. Sample size and P values are provided as source data. g, Schematic representation of serial coronal sections of the 1-year-old pig brain. Red dot-boxed areas indicate the cortical layers of the CC, TC and OC analyzed in h and i. h, The distribution of the density of each population across cortical layers. i, The density of each population across the cortex. Two-tailed unpaired t test (VIP, **P = 0.0084; ****P < 0.0001. CALB2, **P = 0.0082. PV and SST, ***P = 0.0001). The data are presented as mean ± s.e.m. of counts performed on n = 2 cases in three independent experiments Sample size and P values are provided as source data. NS, not significant. Source data
Extended Data Fig. 1
Extended Data Fig. 1. Comparative analysis of ventricular wall structure across species.
a, Developmental changes in cortical folding as measured by gyrification index (GI) across species. Sample size is provided as source data. b, Nissl-stained serial coronal brain sections from different species collected at perinatal ages. The enlarged SVZ, termed the Arc, is present in humans, chimpanzees, macaques, and piglets at birth, embryonic day 135 (E135; gestational period = 150 days), sheep brains, but not in marmoset and mouse brains at birth. Arrows indicate the Arc. The macaque dataset is from the public open source (NIH Blueprint NHP Atlas). Scale bars, 500 µm (human, chimpanzee, macaque, pigletand marmoset); 1 mm (sheep); 100 µm (mouse). Lateral ventricle (LV); striatum (St). c, Quantification of Arc area (mm2) from Nissl-stained sections of different species. Two-tailed unpaired t test, ****p < 0.0001. n = 4 individuals (human); n = 1individuals (macaque and sheep); n = 3 individuals (piglet); n = 2 individuals (chimpanzees, marmoset and mouse). Data are presented as mean ± s.e.m. of counts performed on each individual case in three independent experiments. Sample size is provided as source data. d, Confocal images show robust expression of the migratory neuron marker DCX (in green) and an abundance of blood vessels expressing α-SMA (in red) in the perinatal human, chimpanzee, piglet, and sheep Arc. Scale bars, 500 µm; 100 µm (higher magnification images). e, Coronalsection of postnatal day 0 (P0) marmoset and mouse brains. Migratory neural populations expressing DCX (in green) and PSA-NCAM (in magenta) do not form a tiered structure, and vascular areas (α-SMA, red) are sparse in the ventricular wall of P0 marmoset and mouse brains. Scale bars, 500 µm; 100 µm (higher magnification images). Lateral ventricle (LV); striatum (St). This experiment has been repeated three times (b,d,e). Source data
Extended Data Fig. 2
Extended Data Fig. 2. Cytoarchitectural changes in the human Arc during perinatal stages.
a, Confocal images of Arc structural changes during the perinatal stages of humans. The higher magnification of the yellow boxed area is to the left of 22 GW. Scale bars, 1 mm (22 GW; left), 500 µm (22 GW; right, 30 GW and 39 GW). This experiment has been repeated four times. Lateral ventricle (LV); ganglionic eminence (GE); caudate nucleus (Cd). b, Top: confocal image of DCX+ expression (green) in a coronal section of human Arc from 30 GW to postnatal stages. The yellow and white dashed lines highlight the boundary between tiers 1–2 and tiers 3–4, respectively; arrows indicate blood vessels. Scale bars, 500 µm. Bottom: quantification of DCX expression pixel intensity across tiers. Data are presented as mean ± s.e.m. The serial slides from three individuals were taken for quantification. Sample size is provided as source data. c, Confocal images of tier 1 structural and cellular composition change from 39 GW to 2 years after birth. DCX+ neuroblasts (green) are densely populated with GFAP+ fibers (red) in tier 1 at 39 GW. Scale bars, 30 µm. This experiment has been repeated three times. d, Confocal images of DCX+ expression (green) near a-SMA+ blood vessels (red) in tier 3 of the human Arc across postnatal stages. Scale bars, 30 µm. eg, Quantification of the BV size located in tier 3 (e), the total number of DCX+ cells in contact with the BV (f) and the density of DCX+ cells contacting with BV (w BV) and without BV (w/o BV) across ages (g). Two-tailed unpaired t-test, ***p = 0.0006 (f) and ****p < 0.0001 (g). Data are presented as mean ± s.e.m. of counts performed on different individual cases (n = 4, term; n = 1, 7 months) in three independent experiments. Sample size is provided as source data. Source data
Extended Data Fig. 3
Extended Data Fig. 3. Structural changes in the piglet Arc during perinatal stages.
a, Schematic comparing the stages of human and pig development,. PCD, post-conception day. b, Nissl stain of coronal section from piglet brains across ages. Scale bars, 3 mm. c, Schematic of the P0 piglet brain. The LV of the left hemisphere is highlighted in gray (left) and the Arc in green. Lateral ventricle (LV). d, The 3D volume of the Arc was measured from Nissl-stained piglet serial sections. e, Top: schematic showing piglet Arc subregions at coronal planes. Down: quantification of Arc area at each plane across ages. Two-tailed unpaired t test and data are presented as the mean ± s.e.m. (n = 3 cases). Olfactory ventricle (OV); anterior Arc (A-Arc); posterior Arc (P-Arc). Sample size is provided as source data. f, Confocal images of core Arc structural changes across ages. The yellow line highlights the boundary between tiers 1 and 2; the white line between tiers 3 and 4. Scale bars, 500 µm. This experiment has been repeated five times. g, Top: confocal image of DCX+ expression in developing piglet Arc. Arrows indicate blood vessels. Scale bars, 500 µm. Bottom: quantification of DCX expression pixel intensity across tiers. Data are presented as the mean ± s.e.m. (n = 3 cases). Sample size is provided as source data. h, Quantification of tier thickness in developing piglet brains. Scale bar, 500 µm. Two-tailed unpaired t tests and data as the means ± s.e.m. il, Confocal images of DCX+ cells near α-SMA+ blood vessels (BV) in tier 3 of the piglet Arc across ages. Scale bar, 30 µm. Quantification of the BV size (j), the total number of DCX+ cells in contact with the BV (k) and the density of DCX+ cells contacting with (w) and without (w/o) BV across ages (l). Two-tailed unpaired t tests and data as mean ± s.e.m. (n = 3 cases). Sample size and P values are provided as source data. m, Schematic showing Arc features age-matched between humans and piglets (blue lines) and the period when the tiered Arc structure is present in human and piglet brains (yellow lines). Source data
Extended Data Fig. 4
Extended Data Fig. 4. Transcriptomic profiles of neonatal human Arc cells.
a, Quality control for the snRNA-seq dataset of human Arc samples. Arc samples were collected at GW 30 and GW 39 (GW 39-1 and GW 39-2). Each dot represents a single nucleus. Nuclei with mitochondrial gene fractions above 2% were discarded in the following analysis. The GW 39-1 sample represents the more anterior level dissected at GW 39, and the GW 39-2 sample comes from the more posterior level of Arc, which is equivalent to the dissected region at GW 30. b, The distribution of the nuclei across samples visualized in UMAP space. c, The proportion of 15 clusters from three samples is shown individually. d, The gene expression profile of well-known marker genes visualized via UMAP. SOX6 and SOX11, markers of immature cells; GAD1 and DLX2, markers of GABAergic inhibitory neurons; TBR1 and SATB2, markers of excitatory neurons; OLIG2, BCAS1 and PDGFRA, markers of oligodendrocytes; SPP1 and RUNX, markers of microglia; GFAP and APOE, markers of astrocytes; PBX3, a marker of LGE-derived interneurons; HOPX, a marker for radial glia cells; CLDN5, a marker for endothelial cells; HBB, a marker for red blood cells; ERBB4 and CXCR4 are guidance receptors for the tangential migration of interneurons from the ganglionic eminence. e, Treemap showing the proportion of 15 subclusters based on gene expression. In total, 71% of nuclei express GE-associated TFs, indicating that Arc primarily harbors inhibitory populations. The dotted line includes inhibitory populations. f, Heatmap illustrating the differential gene expressions among 15 subclusters from 500 sampled cells. Radial glia cells with astrocyte characteristics (RG/AC); astrocyte (AC); glial intermediate progenitor cells (gIPC); IPC committed to inhibitory neuronal lineage (In-IPC); oligodendrocyte progenitor cells (OPC); microglia (MG); endothelial cells (Endo); immature excitatory neurons (EN); blood vessel cell (BVC); choroid plexus (CP); immature medial ganglionic eminence (Imm-MGE); caudal/lateral ganglionic eminence (CGE/LGE).
Extended Data Fig. 5
Extended Data Fig. 5. Arc is an intermediate structure in interneuron development, connecting the fetal GEs and cortical regions.
a, Schematics of the age and dissected region of the human brain used in the dataset integration to study developmental features of Arc. It includes single-cell RNA sequencing datasets of human MGE, CGE and LGE from GW 9–18 (ref. ), snRNA-seq datasets of the human germinal region near the LV and cortical plate from GW 17–41 (ref. ), as well as our snRNA-seq datasets of the human Arc at GW 30–39. b, CCA integration of all cell types from human fetal GEs and term Arc, highlighting their inhibitory interneuron population similarity. c, Number of nuclei from cell types in each dataset. d, Sankey diagram derived from b shows the relationship between cells (nuclei) from the fetal GEs and the Arc. Flow thickness indicates the percentage of co-clustering between fetal GE populations and Arc populations. e, Clustering of individual cells (nuclei) from the different ages (left, top), different regions (left, bottom) and different datasets (right), visualized by UMAP. f, The gene expression profile of well-known marker genes visualized via UMAP. g, Fate probabilities inference of immature (Imm)-interneuron clusters from the Arc, highlighting that immature CGE neurons from the Arc primarily committed to cortical fate, while immature MGE neurons committed to cortical and striatal fates, and immature LGE neurons committed to olfactory bulb (OB) interneuron fate.
Extended Data Fig. 6
Extended Data Fig. 6. Diverse GABAergic-neuron subtypes within the piglet Arc.
a, Widefield images of the P0 piglet Arc, immunostained with antibodies against GE-associated transcription factors. The yellow dashed line highlights the boundary between tiers 1–2; the white dashed line between tiers 3–4 (outer) or between tier 1 and the lateral ventricle (inner). Scale bars, 100 µm. b, High magnification images of the Arc expressing DCX and transcription factors (TF). Yellow arrows indicate DCX+ cells expressing TFs. Scale bars, 20 µm. c, RNA-scope images showing a subset of DC+LHX+SST+ and DC+COUP-TFI+VIP+ within the piglet Arc. Yellow arrows indicate DCX+ cells co-expressing other markers. Scale bars, 30 µm. d, High magnification images of the P0 piglet Arc, immunostained with antibodies against additional TFs enriched in the GE. Scale bars, 15 µm. e, Quantification of subpopulations of DCX+ cells in the P0 piglet Arc expressing different TFs enriched in GE. Data mean ± s.e.m. of counts performed on three cases (n = 3). f, Heatmap depicting the spatial distribution of DCX+ cells expressing different TFs across the tiers of the P0 piglet Arc. The color gradient represents TF expression levels from low (blue) to high (red). Medial GE (MGE). g,h, Quantification of the subpopulations of DCX+ cells across anterior–posterior divisions of the Arc in the P0 piglet brain (f) and corresponding heatmap (g). Data mean ± s.e.m. of counts performed on three cases (n = 3). For eh, sample size is provided as source data. i, Left: widefield image (by DAPI) showing the early Arc at E100. Right: immunostaining with NKX2.1 and COUP-TFII antibodies. The dashed white boxes (i1–i4) are magnified. The early Arc at E100 is more populated by COUP-TFII+ cells than NKX2.1+ cells. Scale bars, 500 µm (widefield images), 30 µm (higher magnification images). This experiment has been repeated three times (ac,i). Lateral ventricle (LV). Source data
Extended Data Fig. 7
Extended Data Fig. 7. Dorsal and ventral migratory streams from the Arc target distinct cortical regions in neonatal human and piglet brains.
a, Coronal section of the P0 piglet brain, at the level of the anterior Arc (A-Arc; refer to Extended Data Fig. 3e), immunostained for DCX. (a–d) High magnification images of the boxed areas in a (left) show that DCX+ cells migrate out from the Arc to the cingulate cortex (CC (a)), superior frontal gyrus (SFG (b)) and ventral cortex (piriform cortex (PirC) and insula (d)) but less so to the middle frontal gyrus (MFG (c)). Arrows indicate DCX+ cells with elongated, migratory morphology. Scale bars, 2 mm (a, left), 100 µm (a,d) and 50 µm (b,c,d1,d2). Gray matter (GM); layer (L); white matter (WM). b, Coronal section of the P0 piglet brain, at the level of the posterior Arc (P-Arc; refer to Extended Data Fig. 6e), immunostained for DCX. (a–c) High magnification images of the boxed areas in b (left). DCX+ cells migrate into the posterior CC (a) and temporal cortex (TC (c)). Arrows indicate DCX+ cells with elongated, migratory morphology. Scale bars, 2 mm (b, left), 100 µm (a–c) and 25 µm (c1,c2). Caudate nucleus (Cd). c, Coronal section of a term human brain, immunostained for DCX at a plane equivalent to the P-Arc plane of the P0 piglet brain illustrated in b. (a,b) DCX+ cells appear individually with an elongated morphology (arrows), migrate into the posterior CC (a) and are densely packed in the dorsal white matter (b). (c) DCX+ cells near the ventral Cd exist in clumps. Scale bars, 1 mm (c, left), 50 µm (a–c). d, Spatial mapping of DCX+ cells (in green) in serial coronal sections of P0 and a preterm marmoset brain; few DCX+ cells (arrows) are present in the dorsal (a) and ventral side (b) of the ventricular wall. Scale bars, 1 mm (map), 30 µm (confocal images). This experiment has been repeated five times (ad).
Extended Data Fig. 8
Extended Data Fig. 8. Spatial transcriptomic imagings on P2 piglet brain uncover CGE-associated subpopulations across postnatal cortical streams.
a, Heatmap depicting expression patterns of major cell-type marker genes across the 1,992 DCX+ cells analyzed by HiPlex from P2 piglet brain. Migratory neurons cluster into SATB2-expressing excitatory (Ex, blue box) and GE marker-expressing inhibitory identities (red box). b, Confocal images showing DCX+GAD1+ migratory neurons (left; yellow dashed line) and DC+SATB2+ migratory excitatory neurons (right; yellow dashed line). Scale bars, 50 µm. This experiment has been repeated three times. c, Feature plots of 32 genes associated with interneuron versus excitatory neuron identity and neuronal migration (Supplementary Table 5). d, Feature plots illustrating degrees of gene co-expression. The yellow signal indicates that two genes are co-expressed. COUP-TFII is largely co-expressed with SP8 and only partially with TBR1 and CALB2. The population co-expressing SP8 and PAX6, associated with dorsal lateral ganglionic eminence (dLGE), is small. e, UMAP projection by different regions. Each migratory stream (MS) has an abundant COUP-TFII/SP8 cluster. COUP-TFII/TBR1 cluster is specified in the ventral MS, especially in the temporal cortex (TC). A small population of NKX2.1/Maf1 is populated in the dorsal stream into the posterior cingulate cortex (pCC). Anterior CC (aCC); piriform cortex (PirC). f, Pie chart showing the proportion of clusters grouped by association with ganglionic eminence region. Over 70% of cells express CGE-associated COUP-TFII, and 8.2% express MGE-associated NKX2.1 and LHX6. Others express SATB2, indicating excitatory neuron identity. g, Quantification of cluster proportions in the migratory streams and their targeted cortical regions. The proportion of the COUP-TFII/SP8 cluster decreases along all migratory trajectories. h, Dot plot illustrating the expression pattern of selected 32 genes across the different regions.
Extended Data Fig. 9
Extended Data Fig. 9. Regional distribution of cortical interneuron subtypes in adult human brain.
a, The cortical regions of a 25-year-old human temporal cortex (TC). Superior temporal gyrus (STG) is a part of the TC. Left: PV (green)/VIP (red) immunostained neocortical section from the STG. Right: SST (green)/CALB2 (red) immunostained neocortical section from the STG. The white dotted line delineates the border of cell-dense regions of the cortical layer 2. Scale bars, 100 µm. b, High magnification images of the 25-year-old human STG immunostained with anti-PV, SST, VIP and CALB2 antibodies. Some interneurons in the adult human STG co-express SST and CALB2 markers. Scale bars, 50 µm. This experiment has been repeated three times. c, High magnification images of the 15-year-old human cingulate cortex (CC) labeled with the same antibodies. Scale bars, 50 µm. d, High magnification images of the 25-year-old human occipital cortex (OC) labeled with the same antibodies. Scale bars, 50 µm. e, Co-detection of protein and mRNA of VIP molecules in the human brain. Scale bars, 25 µm. This experiment has been repeated three times. f, The density of each population is measured across cortical layers. Subpopulation expressing VIP is abundant in the Arc-associated cortical regions, including CC and TC, but not OC. The data are presented as mean ± s.e.m. of counts performed on n = 1 case in five independent experiments. g, The distribution of the density of each population across cortical layers. Whiskers extend to the minimum and maximum values of the data. Two-tailed unpaired t test (****p < 0.0001). The data are presented as mean ± s.e.m. of counts performed on n = 1 case in five independent experiments. Sample size and P values are provided as source data. Source data
Extended Data Fig. 10
Extended Data Fig. 10. Regional distribution of cortical interneuron subtypes in adult pig brain.
a, Schematic illustrating anterior and posterior coronal sections of a 1-year-old pig brain. Red boxed areas indicate cingulate cortex (CC), temporal cortex (TC) and occipital cortex (OC). CC and TC are the main destinations of Arc-derived migratory neurons, while OC is less associated with Arc-derived migratory streams. b, The cortical regions of the 1-year-old pig brain immunostained for interneuron markers. Left: PV (green)/VIP (red) double-immunostained neocortical section from the temporal cortex (TC). Right: SST (green)/CALB2 (red) double-immunostained neocortical section from the TC. The white dotted line delineates the border of cell-dense regions of the cortical layer 2. Scale bars, 100 µm. This experiment has been repeated three times. ce. High magnification images of each cortical area in a show that VIP+ interneurons are abundant, most notably in cortical layers 2–3 of the cingulate cortex (CC) and temporal cortex (TC). Some interneurons in the adult pig TC co-express SST and CALB2 markers. Scale bars, 50 µm. f, The density of each population is measured across cortical layers. Subpopulation expressing VIP is abundant in the Arc-associated cortical regions, including CC and TC, but not OC. The data are presented as mean ± s.e.m. of counts performed on n = 2 cases in three independent experiments. g, The distribution of the density of each population across cortical layers. Whiskers extend to the minimum and maximum values of the data. Two-tailed unpaired t test. The data are presented as mean ± s.e.m. of counts performed on n = 2 cases in three independent experiments. Sample size and p values are provided as source data. Source data

References

    1. Ayala, R., Shu, T. & Tsai, L. H. Trekking across the brain: the journey of neuronal migration. Cell128, 29–43 (2007). - PubMed
    1. Buchsbaum, I. Y. & Cappello, S. Neuronal migration in the CNS during development and disease: insights from in vivo and in vitro models. Development146, dev163766 (2019). - PubMed
    1. Lim, L., Mi, D., Llorca, A. & Marin, O. Development and functional diversification of cortical interneurons. Neuron100, 294–313 (2018). - PMC - PubMed
    1. Morshead, C. M. et al. Neural stem cells in the adult mammalian forebrain: a relatively quiescent subpopulation of subependymal cells. Neuron13, 1071–1082 (1994). - PubMed
    1. Gage, F. H. Mammalian neural stem cells. Science287, 1433–1438 (2000). - PubMed

LinkOut - more resources