. 2025 Jul;27(7):1175-1185.
doi: 10.1038/s41556-025-01696-9. Epub 2025 Jul 14.

Atlas of amnion development during the first trimester of human pregnancy

Affiliations

Atlas of amnion development during the first trimester of human pregnancy

Wenqi Hu et al. Nat Cell Biol. 2025 Jul.

Abstract

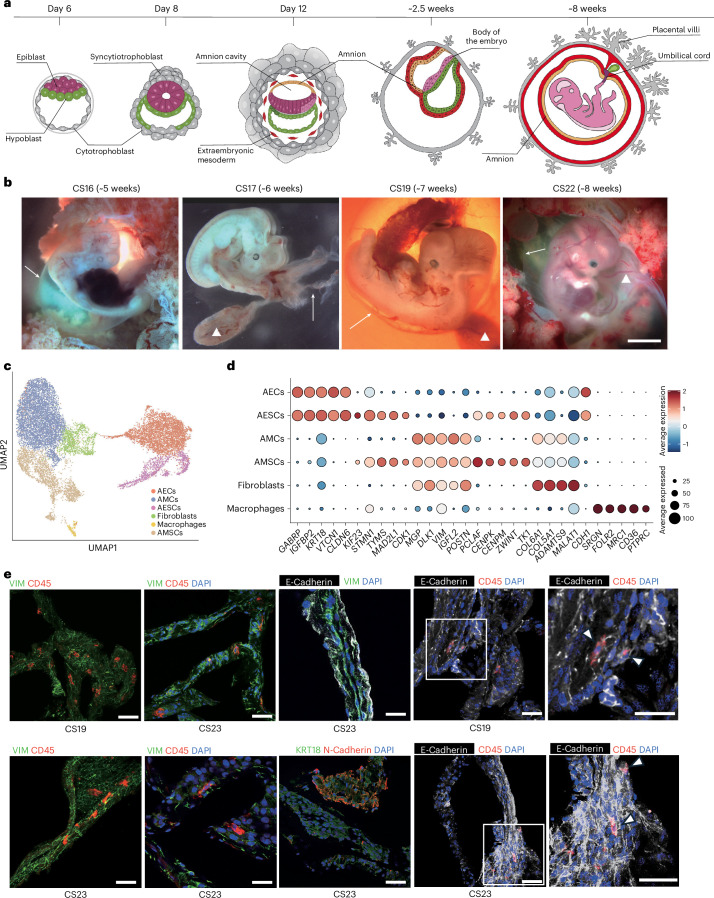
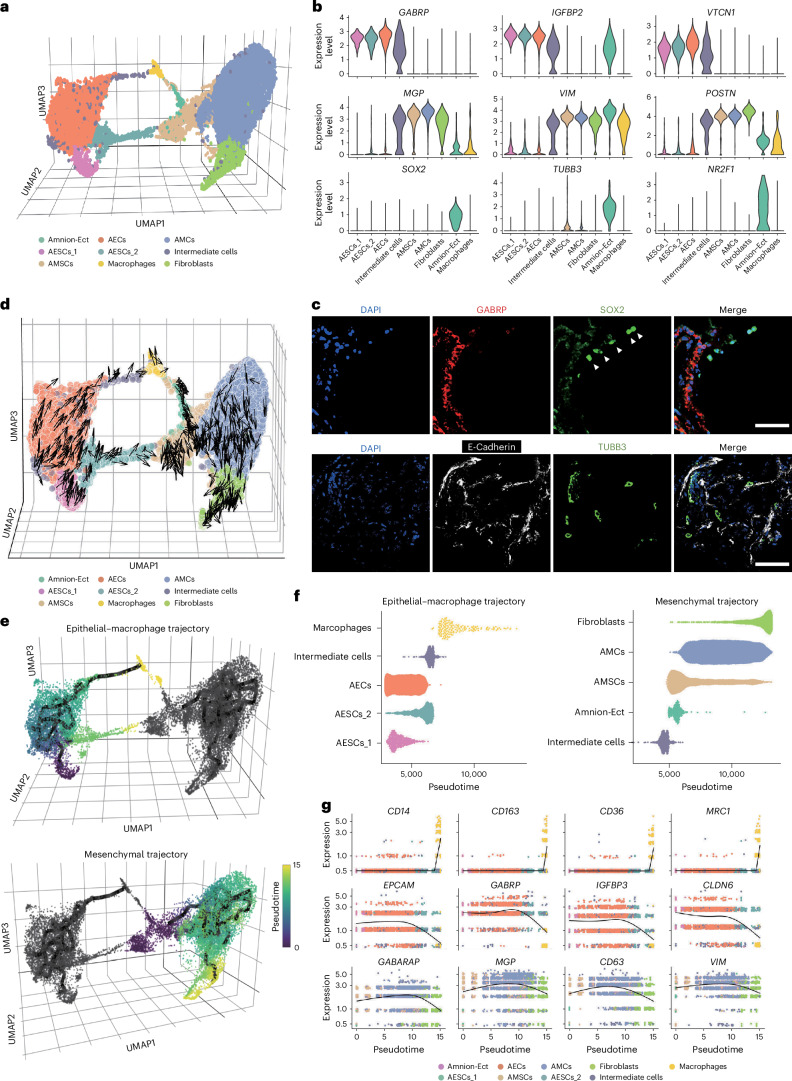
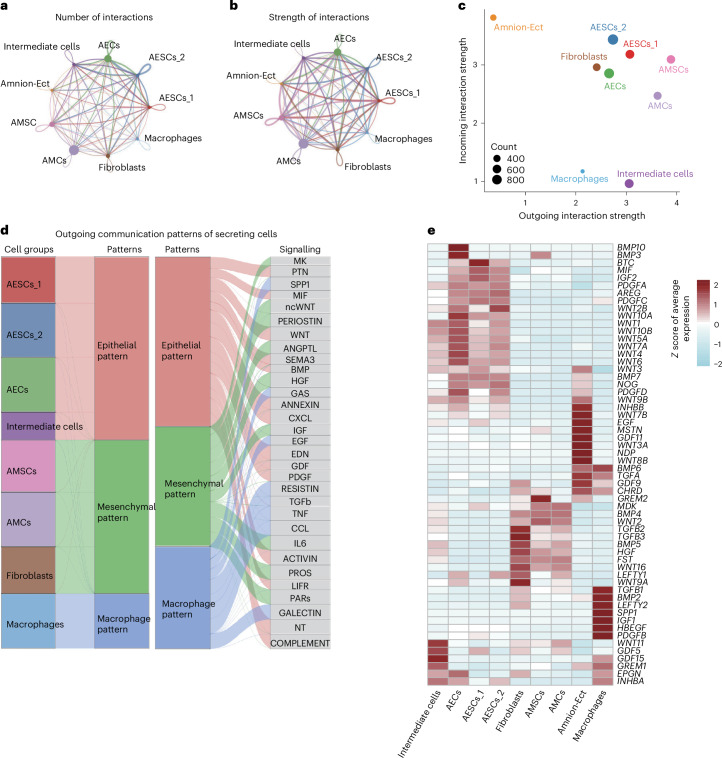
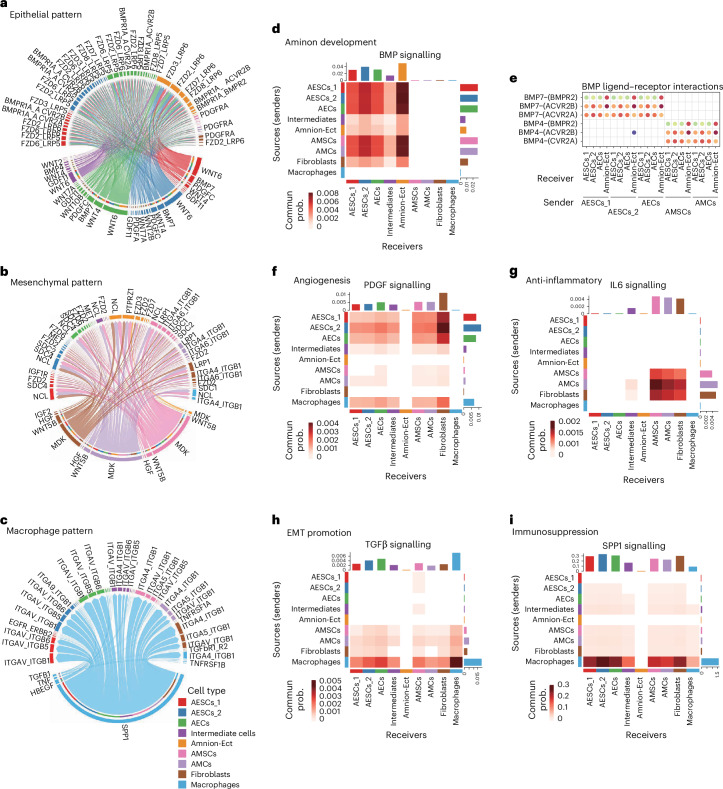
The amnion is a critical extra-embryonic structure that supports foetal development, yet its ontogeny remains poorly defined. Here, using single-cell transcriptomics, we identified major cell types and subtypes in the human amnion across the first trimester of pregnancy, broadly categorized into epithelial, mesenchymal and macrophage lineages. We uncovered epithelial-mesenchymal and epithelial-immune transitions, highlighting dynamic remodelling during early pregnancy. Our results further revealed key intercellular communication pathways, including BMP4 signalling from mesenchymal to epithelial cells and TGF-β signalling from macrophages to mesenchymal cells, suggesting coordinated interactions that drive amnion morphogenesis. In addition, integrative comparisons across humans, non-human primates and in vitro stem cell-based models reveal that stem cell-based models recapitulate various stages of amnion development, emphasizing the need for careful selection of model systems to accurately recapitulate in vivo amnion formation. Collectively, our findings provide a detailed view of amnion cellular composition and interactions, advancing our understanding of its developmental role and regenerative potential.


Conflict of interest statement

Competing interests: The authors declare no competing interests.

Figures

Fig. 1
Fig. 1. scRNA-seq analysis of human amnion during the first trimester.
a, A diagram illustrating the development of the human amnion. Trophectoderm is marked in grey, amnion in orange, extra-embryonic mesoderm in red, hypoblast or yolk sac endoderm in green, epiblast/embryo body in burgundy or pink and umbilical cord in purple. b, Images of human embryos representing different stages. CS16–CS19 were the collected sample, and CS22 is a representative image taken from the same centre. Arrows point to the amniotic membrane, and triangles mark the yolk sac. Scale bar, 0.5 cm. c, UMAP displaying the identified cell types within the analysed samples. d, A bubble plot showing selected top marker gene expression across cell types. e, Immunofluorescence (IF) staining of amnion sections, with protein markers labelled at the top of the image and amnion stages labelled at the bottom. Different fluorescent markers highlight the localization of the proteins in the tissue. The region inside the white box is magnified on the right. White arrows indicate double-positive cells. Scale bars, 50 µm. CD45–VIM co-staining is representative of four independent experiments that yielded similar results. CD45–E-Cadherin co-staining is representative of two independent experiments. VIM–E-Cadherin and N-Cadherin–KRT18 are representative of one experiment. scRNA-seq analyses depicted in this figure are generated from human amnion samples of the following developmental stages: CS16 (n = 1), CS17 (n = 1), CS19 (n = 1) and CS22 (n = 1). Source data
Fig. 2
Fig. 2. Cell subtypes and lineage trajectories in human amnion.
a, A 3D UMAP representation showing different cell subtypes in the amnion. b, A violin plot showing marker gene expression across subtypes. c, Top: immunostaining of GABRP and SOX2 in the CS16 amnion section, with triangles marking the ectodermal cells. Representative image from two independent experiments. Bottom: immunostaining of E-Cadherin and TUBB3 in the CS19 amnion section. Scale bars, 50 µm. Representative image from four independent experiments. d, RNA velocity analysis indicating development tendencies of epithelial and mesenchymal cells, based on the integrated analysis of four independent biological samples. e, Pseudotime and trajectory plots showing the epithelial–macrophage trajectory (top) and mesenchymal trajectory (bottom). f, Cell subtypes arranged along the Destiny pseudotime in two trajectories: epithelial–macrophage lineage (left) and mesenchymal lineage (right). g, The expression of selected differentially expressed genes (DEGs) during lineage progression in amnion: macrophage (top), epithelial (middle) and mesenchymal (bottom). scRNA-seq analyses depicted in this figure are generated from human amnion samples of the following developmental stages: CS16 (n = 1), CS17 (n = 1), CS19 (n = 1) and CS22 (n = 1). Source data
Fig. 3
Fig. 3. Cellular communication and secretion patterns within the amnion.
a, The total number of inferred signalling interactions among different cell types. b, Overall interaction strength representing the cumulative communication probability between cell types. c, Cell roles in secreting and receiving signals. d, Classification of cells into three distinct secretion patterns based on gene expression profiles. e, A heatmap showing the expression of ligands across different cell types. scRNA-seq analyses depicted in this figure are generated from human amnion samples of the following developmental stages: CS16 (n = 1), CS17 (n = 1), CS19 (n = 1) and CS22 (n = 1). Source data
Fig. 4
Fig. 4. Key signalling pathways in distinct amnion cell patterns.
ac, A chord diagram showing ligand–receptor interactions in epithelial (a), mesenchymal (b) and macrophage (c) patterns. Distinct cell types are represented by different colours. d, A heatmap showing interactions in the BMP signalling pathway. Commun prob., communication probability. e, A bubble plot showing the significant interactions in the BMP signalling pathway. fi, Heatmaps showing interactions in PDGF (f), IL6 (g), TGF-β (h) and SPP1 (i) signalling pathways. scRNA-seq analyses depicted in this figure are generated from human amnion samples of the following developmental stages: CS16 (n = 1), CS17 (n = 1), CS19 (n = 1) and CS22 (n = 1).
Fig. 5
Fig. 5. Combined analysis of amnion data from human, monkey and in vitro stem cell-derived embryo models.
a, Combined UMAP of amnion data from human, monkey and in vitro stem cell-derived models. NNE, non-neural ectoderm; AM, amnion; ExE.Meso, extra-embryonic mesoderm; ECT, ectoderm; EPI, epiblast; Mes, mesenchyme; SE1, surface ectoderm1; SE2, surface ectoderm2; VE, visceral endoderm; ESC, embryonic stem cell; AMLC, amnion-like cell; MeLC, mesoderm-like cell; PGCLC, primordial germ cell-like cell. Data were merged from the scRNA-seq data generated in this study and five published datasets. b, A diffusion map illustrating the distribution of various amnion and amnion-like cell populations based on the integrated dataset comprising our data and five published datasets. Arrows indicate the developmental process. AME-E, amnion early like cell; AME-L, amnion late-like cell; AP3, hPS cells that were primed for 3 days; AP8, hPS cells that were primed for 8 days. c, Pseudotime plots of amnion and amnion-like cells derived from this study and five published datasets, with dataset origins indicated on the side. Pseudotime_dm; pseudotime computed using diffusion maps (dm). d, A heatmap showing the expression of each gene module across amnion and amnion-like cells from our data and five published datasets. Gene module numbers are shown on the left. Specific markers and transcription factors (TFs) are shown on the right. eg, GO enrichment analysis of early amnion (e), AMCs (f) and AECs (g). Data sources include previously published datasets from human CS7 (ref. ), monkey CS8–11 (ref. ), and three sets of in vitro-derived amnion-like cells,,. Source data
Extended Data Fig. 1
Extended Data Fig. 1. Quality control of single-cell RNA-seq data.
(a) UMAP visualization depicting Seurat-defined clusters using pre-QC data. (b) Overlay of Souporcell-defined genotypes on the pre-QC UMAP. Cells clustering by the same genotype were regarded as maternal cells. (c) Distribution of cell type scores on the pre-QC UMAP. (d) Histogram presenting the number of cells across different scoring categories. scRNA-seq analyses depicted in this figure are generated from human amnion samples of the following developmental stages: CS16 (n = 1), CS17 (n = 1), CS19 (n = 1), CS22 (n = 1).
Extended Data Fig. 2
Extended Data Fig. 2. Seurat clusters and marker genes on UMAP.
(a) UMAP showing Seurat clusters after quality control (b) Marker genes of epithelial, mesenchymal, and progenitor cells were shown on UMAP. scRNA-seq analyses depicted in this figure are generated from human amnion samples of the following developmental stages: CS16 (n = 1), CS17 (n = 1), CS19 (n = 1), CS22 (n = 1).
Extended Data Fig. 3
Extended Data Fig. 3. Immunostainings of amnion sections in CS19 and CS23.
(a) Immunostaining of CD45 and VIM in the human amnion section. left panel: CS19; right panel: CS23. Scale bar = 50μm. Representative image from 2 independent experiments. (b) Immunostaining of CD45 and VIM in the human amnion section. top panel: CS19; bottom panel: CS23, Scale bar = 50μm. Representative image from 2 independent experiments. (c) Immunostaining of CD45 and E-Cadherin in the human amnion section. top panel: CS19; bottom panel: CS23, Scale bar=50μm. Representative image from 1 independent experiments. (d) Immunostaining of E-Cadherin and VIM in the human CS23 amnion section. Scale bar = 50μm. Representative image from 1 independent experiment. (e) Immunostaining of N-Cadherin and KRT18 in the human CS23 amnion section. Scale bar = 50μm. Representative image from 1 independent experiment.
Extended Data Fig. 4
Extended Data Fig. 4. Cell subtype identification in human amnion.
(a) Seurat clusters on 3D UMAP. (b) Heatmap of the top 50 epithelial (top) and mesenchymal marker genes (bottom) across cell subtypes. (c) SOX2-positive cells were shown on UMAP. (d) Bar plot showing the expression of neural-related genes in 9, 16-18 and 22 weeks of human amnion samples (bulk data from Roost, 2015). The samples at 9 weeks and 22 weeks each have two biological replicates, while the samples from 16-18 weeks have three biological replicates. Each data point represents an individual sample, and bars indicate the mean expression value. (e) Umap showing the expression of neural-related genes in amnion cells. (f) Umap showing the Co-expression of SOX2 (yellow) and neural markers(blue). Double-positive cells are colored in purple. Cell proportions are list on the legend. (g) Immunostaining of SOX2 and TUBB3 in the human CS19 amnion section. Scale bar=50μm. White frame region is magnified and shown on the right. Top panel shows TUBB3 positive cells, bottom panel shows TUBB3, SOX2 double-positive cells. Representative image from 4 independent experiments. scRNA-seq analyses depicted in (a), (b) and (c) are generated from human amnion samples of the following developmental stages: CS16 (n = 1), CS17 (n = 1), CS19 (n = 1), CS22 (n = 1). Analyses depicted in (e) and (f) are based on amnion cells from monkey CS8-11 dataset. Source data
Extended Data Fig. 5
Extended Data Fig. 5. The expression of EMT-related TFs.
(a) Violin plots showing the expression of EMT-related TFs across different cell subtypes. (b) SNAI1-positive cells were shown on UMAP, with an enlarged section on the right. scRNA-seq analyses depicted in this figure are generated from human amnion samples of the following developmental stages: CS16 (n = 1), CS17 (n = 1), CS19 (n = 1), CS22 (n = 1). Source data
Extended Data Fig. 6
Extended Data Fig. 6. Cell-cell communication network between any two cell groups.
(a) Circle plots showing cell-cell interactions. Line weights indicating the total interaction strength. scRNA-seq analyses depicted in this figure are generated from human amnion samples of the following developmental stages: CS16 (n = 1), CS17 (n = 1), CS19 (n = 1), CS22 (n = 1).
Extended Data Fig. 7
Extended Data Fig. 7. Ligand/receptor interactions and gene expression.
(a) Circle plots depicting BMP ligand-receptor interactions. Upper panel: BMP4; Lower panel: BMP7. (b) Violin plots showing the expression of BMP ligands and their receptors across different cell types. (c, e) Heatmaps displaying the cell-cell interactions in the MDK (c) and WNT (e) signaling pathways. (d, f) Bubble plots showing MDK (d) and WNT (f) ligand-receptor interactions across different cell types. Inter-cells, short for intermediate cells. scRNA-seq analyses depicted in this figure are generated from human amnion samples of the following developmental stages: CS16 (n = 1), CS17 (n = 1), CS19 (n = 1), CS22 (n = 1).
Extended Data Fig. 8
Extended Data Fig. 8. BMP4 induction and Immunosuppressive factors expression in amnion.
(a) In vitro stem cell experiment design (left) and qPCR results (right) of cytokines-treated iPSCs. Relative gene expression was calculated using the ΔΔCt method, with GAPDH as the internal control. Each data point represents an individual sample, and bars indicate the mean expression value. The untreated medium was used as the control group, while groups treated with BMP4, RA, and MDK were the experimental groups. Each group, except for the BMP4-treated group, has two biological replicates. (b, c) Circle plots showing MIF (b) and SPP1 (c) interactions across different cell types. Analyses are generated from human amnion samples of the following developmental stages: CS16 (n = 1), CS17 (n = 1), CS19 (n = 1), CS22 (n = 1). (d) Immunostaining showing the expression of SPP1, MIF and CD44 in the CS16 amnion section, Scale bar = 50 μm. Representative image from 3 independent experiments. Source data
Extended Data Fig. 9
Extended Data Fig. 9. Single-cell RNA-seq datasets of amnion and amnion models.
(a) UMAP of single-cell RNA-seq data from the human CS7 amnion. (b) UMAP of single-cell RNA-seq data from the monkey CS8-11 amnion. (c–e) UMAPs of single-cell RNA-seq data from in vitro amnion models. Data were obtained from previously published studies (see Methods for details).

References

    1. Mole, M. A., Weberling, A. & Zernicka-Goetz, M. Comparative analysis of human and mouse development: from zygote to pre-gastrulation. Curr. Top. Dev. Biol.136, 113–138 (2020). - PubMed
    1. Stirparo, G. G. et al. Integrated analysis of single-cell embryo data yields a unified transcriptome signature for the human pre-implantation epiblast. Development10.1242/dev.158501 (2018). - PMC - PubMed
    1. Shahbazi, M. N. et al. Pluripotent state transitions coordinate morphogenesis in mouse and human embryos. Nature552, 239–243 (2017). - PMC - PubMed
    1. Chuva de Sousa Lopes, S. M., Roelen, B. A. J., Lawson, K. A. & Zwijsen, A. The development of the amnion in mice and other amniotes. Philos. Trans. R. Soc. Lond. B377, 20210258 (2022). - PMC - PubMed
    1. Bedzhov, I. & Zernicka-Goetz, M. Self-organizing properties of mouse pluripotent cells initiate morphogenesis upon implantation. Cell156, 1032–1044 (2014). - PMC - PubMed

MeSH terms

Substances

LinkOut - more resources