. 2025 Sep;22(9):1061-1076.
doi: 10.1038/s41423-025-01311-9. Epub 2025 Jul 14.

CD8+GZMK+CD27+CCR7+ T cells mobilized by splenic sympathetic nerves aggravate brain ischemia‒reperfusion injury via CCL19-positive endothelial cells

Affiliations

CD8+GZMK+CD27+CCR7+ T cells mobilized by splenic sympathetic nerves aggravate brain ischemia‒reperfusion injury via CCL19-positive endothelial cells

Ying Bai et al. Cell Mol Immunol. 2025 Sep.

Abstract

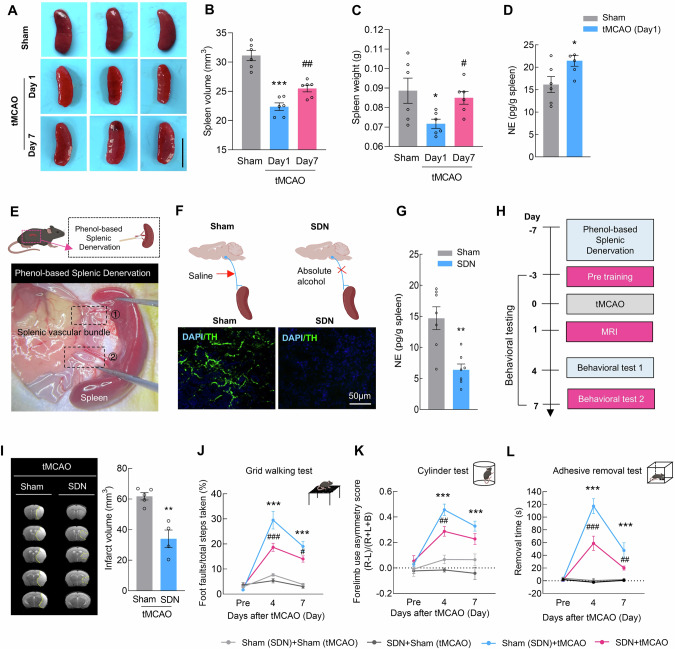
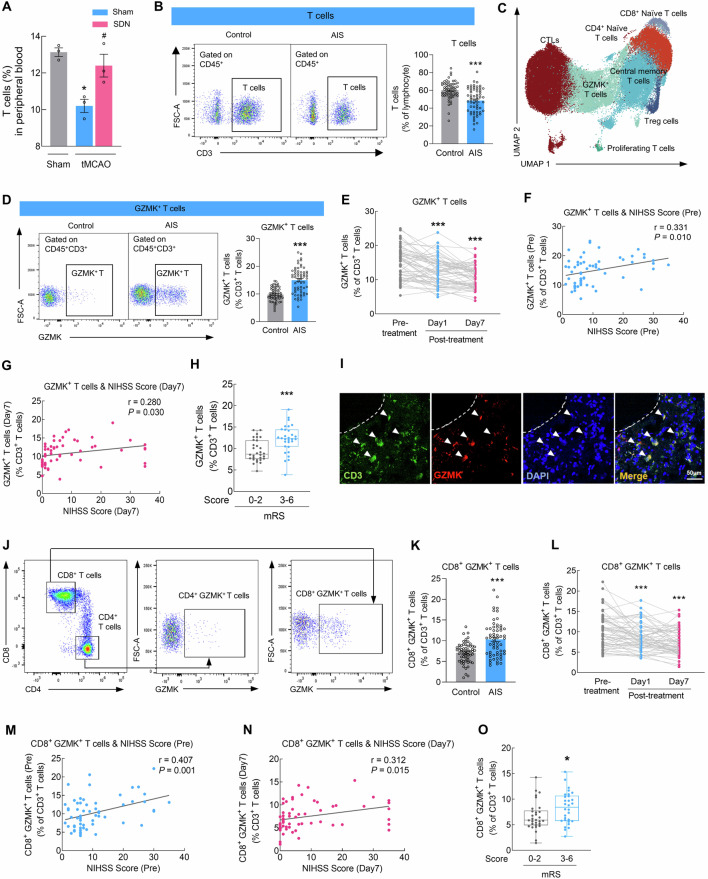
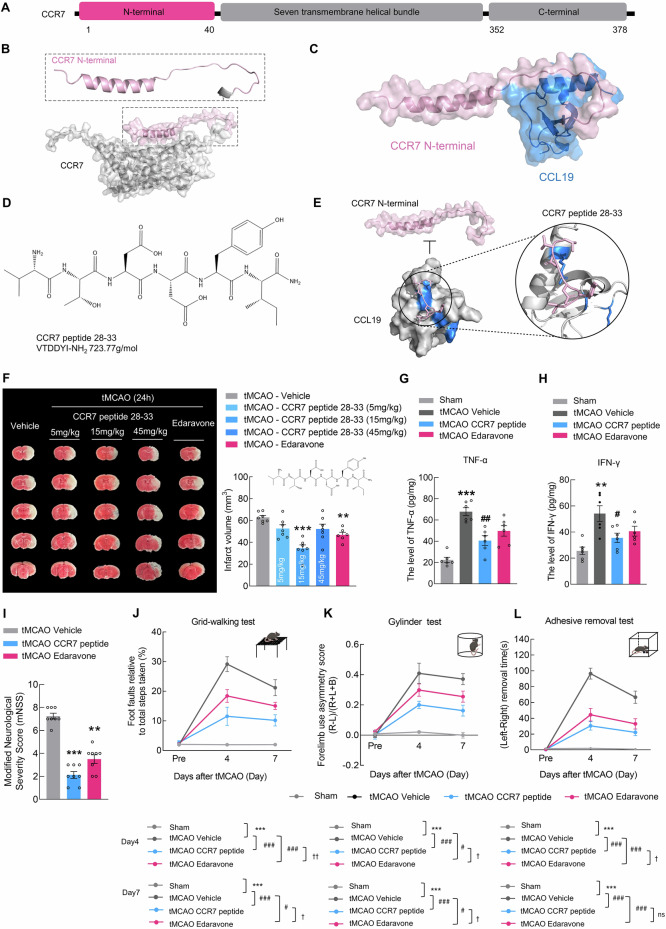
Splenic sympathetic activity critically modulates peripheral immunity after ischemic stroke, thus intervention in spleen sympathetic activity represents a promising therapeutic strategy for stroke. However, the mechanisms underlying spleen-brain-immune axis communication remain poorly understood. Here, we utilized a surgical denervation protocol to perform splenic sympathetic denervation (SDN), which significantly attenuated brain injury following stroke. Through single-cell RNA sequencing, we identified a novel GZMK+CD8+CD27+CCR7+ T-cell subset in patients with acute ischemic stroke (AIS), which we designated stroke-associated T (Tsa) cells. The expansion of Tsa cells was positively correlated with the severity of clinical symptoms and was driven by the splenic sympathetic nervous system. Stroke-induced sympathetic activation triggers the release of splenic norepinephrine (NE), which preferentially signals through ADRB2 on Tsa cells to promote their mobilization. Additionally, ischemic injury induces endothelial cell-specific expression of CCL19, which chemoattracts Tsa cells into the brain parenchyma via their cognate CCR7 receptor, exacerbating neuroinflammatory injury and neurological deficits in a transient middle cerebral artery occlusion (tMCAO) mouse model. We developed a CCR7-targeting peptide to disrupt this chemotactic axis and reduce T-cell infiltration, thereby mitigating brain injury. Our findings highlight SDN as a promising therapeutic strategy to attenuate ischemia‒reperfusion injury and suggest its potential as an adjunctive therapy for reperfusion treatment in AIS patients.

Keywords: Acute ischemic stroke; CCL19; CCR7; Functional recovery; Splenic sympathetic denervation; Stroke-associated T cells.


Conflict of interest statement

Competing interests: The authors declare no competing interests.

Figures

Fig. 1
Fig. 1
Sympathetic denervation of the spleen reduces brain injury after ischemia‒reperfusion. A Spleen images of the sham and tMCAO models during the early (day 1) and late (day 7) stages. The scale bar represents 1 cm. B Spleen volume in the sham and tMCAO models during the early (day 1) and late (day 7) stages. n = 6/group. C Spleen weight in the sham and tMCAO models during the early (day 1) and late (day 7) stages. n = 6/group. D ELISA-based measurement of splenic norepinephrine (NE) levels at 24 h post tMCAO. n = 6/group. E Schematic illustration of the splenic sympathetic denervation (SDN) experiment. F Representative images of spleen sections from sham-operated or denervated mice 1 week after surgery. Green, tyrosine hydroxylase (TH) staining; blue, DAPI. Scale bar = 50 μm. G. NE concentrations in splenic tissue from sham-operated and denervated mice. n = 7/group. H Schematic of tMCAO, infarction examination, and behavioral tests in SDN mice. I Representative T2-weighted MR images of the tMCAO (sham) and tMCAO (SDN) groups 1 day after tMCAO, followed by analysis of the infarct volume. The dashed line denotes the infarct area. n = 5 in the tMCAO (Sham) group, n = 4 in the tMCAO (SDN) group. Functional recovery in SDN mice was assessed by the grid walking test (J), cylinder test (K), and adhesive removal test (L) at baseline and on days 4 and 7 after tMCAO. n = 6/group. The data are presented as the means ± SEMs. *P < 0.05; **P < 0.01; ***P < 0.001; #P < 0.05; ##P < 0.01; ###P < 0.001
Fig. 2
Fig. 2
Cell subset-specific analysis identifies homeostatic and stroke-associated GZMK+ CD8+ T cells. A Proportions of T cells in peripheral PBMCs after SDN in sham and tMCAO mice. B Proportions of T cells in non-stroke controls and AIS patients. n = 60/group. C UMAP visualization showing 7 transcriptionally distinct T-cell subsets. D Proportions of GZMK+ T cells in non-stroke controls and AIS patients. n = 60/group. E Proportions of GZMK+ T cells in AIS patients before treatment, on day 1, and on day 7 after treatment. n = 60/group. F Spearman correlation between GZMK+ T-cell proportions and National Institutes of Health Stroke Scale (NIHSS) scores (pre-treatment). G Spearman correlation between GZMK+ T-cell proportions and NIHSS scores (day 7 post-treatment). H Proportions of GZMK+ T cells in patients with good outcomes (mRS 0–2) versus poor outcomes (mRS 3–6) post-treatment; n = 30 in the good outcome group and n = 30 in the poor outcome group. I Representative images showing immunostaining for CD3 (green) and GZMK (red) in the brains of AIS patients. J Gating strategy for determining the abundance of CD4+ GZMK+ T cells and CD8+ GZMK+ T cells via flow cytometry. K Proportions of CD8+ GZMK+ T cells in non-stroke controls and AIS patients. n = 60/group. L Proportions of CD8+ GZMK+ T cells in AIS patients before treatment, on day 1, and on day 7 after treatment. n = 60/group. M Spearman correlation between CD8+ GZMK+ T-cell proportions and National Institutes of Health Stroke Scale (NIHSS) scores (pre-treatment). N Spearman correlation between CD8+ GZMK+ T-cell proportions and NIHSS scores (day 7 post-treatment). O Proportions of CD8+ GZMK+ T cells in patients with good outcomes (mRS 0–2) versus poor outcomes (mRS 3–6) post-treatment; n = 30 in the good outcome group and n = 30 in the poor outcome group. The data are presented as the means ± SEMs. *P < 0.05; ***P < 0.001
Fig. 3
Fig. 3
CCR7-specific CD8+ GZMK+ T cells are associated with clinical symptoms in AIS patients. A UMAP visualization showing four transcriptionally distinct CD8+ GZMK+ T-cell subsets. B Dot plot showing the expression of the five selected genes in each subtype. C Feature plots showing the gene expression of representative markers across four subsets. D Gating strategy for determining the abundance of four CD8+ GZMK+ T-cell sub-populations via flow cytometry. E Proportions of CD8+ GZMK+ C04 T cells in non-stroke controls and AIS patients. n = 60/group. F Proportions of CD8+ GZMK+ C04 T cells in AIS patients before treatment, on day 1, and on day 7 after treatment. n = 60/group. G Spearman correlation between CD8+ GZMK+ C04 T-cell proportions and National Institutes of Health Stroke Scale (NIHSS) scores (pre-treatment). H Spearman correlation between CD8+ GZMK+ C04 T-cell proportions and NIHSS scores (day 7 post-treatment). I Spearman correlation between CD8+ GZMK+ C04 T-cell proportions and BI scores (pre-treatment). J Spearman correlation between CD8+ GZMK+ C04 T-cell proportions and BI scores (day 7 post-treatment). K Proportions of CD8+ GZMK+ C04 T cells in patients with good outcomes (mRS 0–2) versus poor outcomes (mRS 3–6) before treatment; n = 30 in the good outcome group and n = 30 in the poor outcome group. L Quantification of TNF in non-stroke controls and AIS patients. n = 60/group. M Quantification of IFN-γ in non-stroke controls and AIS patients. n = 60/group. The data are presented as the means ± SEMs. **P < 0.01; ***P < 0.001
Fig. 4
Fig. 4
Adrenergic innervation promotes splenic generation of Tsa cells after reperfusion in stroke mice. A Proportions of Tsa cells in the spleen, blood, and brain after SDN in sham and tMCAO mice. The proportions of Tsa cells were determined by flow cytometry 24 h after reperfusion. n = 6/group. B Proportions of Tsa cells in the spleen, blood, and brain 24 h after tMCAO in the vehicle and propranolol groups. C Isolation and adoptive transfer strategy for Tsa cells from WT and Gzmk Cas9-KO mice. D Modified neurological severity score of Rag1em1Cd/Gpt mice that received Tsa cells isolated from WT mice and those that received Tsa cells isolated from Gzmk Cas9-KO mice at 24 h after stroke. n = 11/group. E Infarct volume of Rag1 em1Cd/Gpt mice that received Tsa cells isolated from WT mice and those that received Tsa cells isolated from Gzmk Cas9-KO mice at 24 h after stroke. n = 5/group. F, G The levels of the inflammatory factors TNF-α and IFN-γ in the peri-infarct area of Rag1 em1Cd/Gpt mice that received Tsa cells isolated from WT mice and the group that received Tsa cells isolated from Gzmk Cas9-KO mice at 24 h after stroke. n = 6/group. H, I In vitro endothelial barrier permeability assay using Tsa cells from WT and Gzmk-KO mice. n = 3/group. The data are presented as the means ± SEMs. *P < 0.05; **P < 0.01; ***P < 0.001; ###P < 0.001
Fig. 5
Fig. 5
Identification of the stroke-associated endothelial cell subset that mediates Tsa cell infiltration. A UMAP of the 15 major cell populations identified in the peri-infarct cortex in the stroke group and the corresponding regions in the sham group. Left: Integration of data from the sham and stroke groups. Top middle: the sham group. Bottom middle: The stroke group. Right: Stacked bar graphs showing the proportions of different cells in the sham and stroke groups. B Cell type annotation was performed on the basis of the expression of well-established marker genes. The color of the dots indicates the expression level. The dot size represents the proportion of cells expressing the indicated markers. C Feature plot of Ccl19 expression in all cells. D Schematic of endothelial cells, microglia, astrocytes, and neurons isolated from the brains of tMCAO stroke model mice. E Relative expression of Ccl19 in the sorted cells as determined by qPCR in the sham and tMCAO mice. n = 3 samples for each group; each sample was pooled from 3 animals. F UMAP of the 10 cell populations identified by endothelial cell clustering. Left: Integration of data from the sham and stroke groups. Top right: the sham group. Bottom right: The stroke group. G Dot plot showing the expression of Ccl19 in endothelial cell subsets. H Bar graph showing the percentages of the various endothelial cell subtypes identified in (F) in both the sham and stroke groups. Dot plot showing the expression of Ccl19 in the endo-7 subset in both the sham and stroke groups. I Relative expression of CCL19 in the brains of non-stroke controls and AIS patients, as determined by qPCR. n = 6/group. J CCL19 expression in the brains of non-stroke controls and AIS patients was measured via western blotting. n = 6/group. The data are presented as the means ± SEMs. *P < 0.05; **P < 0.01; ***P < 0.001
Fig. 6
Fig. 6
CCL19-CCR7 coordinates endothelial cell-Tsa cell cross-talk. A Schematic diagram of Ccl19 lentiviral construction, AAV injection, tMCAO, flow cytometry, infarction examination, ELISA, neurological deficit assessment, and behavioral studies. B Endothelial cells were sorted from the brain tissues of C57BL/6J mice after AAV-TIE2-siRNA-Ccl19 injection. The relative expression of Ccl19 in the sorted cells was determined by qPCR. n = 6/group. C Flow cytometry analysis of the proportion of Tsa cells in the peri-infarct area of stroke mice with downregulated Ccl19. D The levels of the inflammatory factors TNF-α and IFN-γ in the peri-infarct area of tMCAO + AAV-TIE2-siRNA-NC– and tMCAO+AAV-TIE2-siRNA-Ccl19–injected mice were measured via ELISA 24 h after stroke. n = 6/group. E Representative TTC-stained sections from tMCAO+AAV-TIE2-siRNA-NC– and tMCAO+AAV-TIE2-siRNA-Ccl19–injected mice at 24 h after stroke, followed by analysis of infarct volume. n = 10/group. F Neurological deficit scores of AAV-TIE2-siRNA-NC– and AAV-TIE2-siRNA-Ccl19–injected mice 24 h  after stroke. n = 10/group. Effects of Ccl19 knockdown on behavioral recovery at different time points after stroke, as measured by the grid walking test (G), cylinder test (H), and adhesive removal test (I). n = 10/group. The data are presented as the means ± SEMs. **P < 0.01; ***P < 0.001; #P < 0.05; ##P < 0.01; ###P < 0.001
Fig. 7
Fig. 7
A CCR7 peptide designed to disrupt the CCL19‒CCR7 axis reduces IRI. A Schematic representation of CCR7. B Prediction of the structure of the CCR7 N-terminus via AlphaFold2. C Predicted binding conformation of the CCL19-CCR7 N-terminal heterodimer. D Potential peptide fragments of the CCR7 peptide 28–33. E Prediction of the binding site for the CCR7 peptide 28–33. F Representative TTC-stained sections 24 h after tMCAO in the vehicle, three different dosages of the CCR7 peptide 28–33 (5, 15, and 45 mg/kg), and edaravone groups, followed by an analysis of infarct volume. n = 7 animals in the sham group, three different dosages of CCR7 peptide 28-33 (5 mg/kg, 15mg/kg, and 45 mg/kg) group; n = 6 animals in the edaravone group. G, H The levels of the inflammatory factors TNF-α and IFN-γ in the peri-infarct area 24 h after tMCAO in the vehicle, CCR7 peptide 28–33 (15 mg/kg) and edaravone groups. n = 6/group. I Modified neurological severity scores of the vehicle, CCR7 peptide 28–33 (15 mg/kg), and edaravone groups at 24 h after stroke. n = 8/group. J‒L Functional recovery in the vehicle, CCR7 peptide 28–33 (15 mg/kg), and edaravone groups was assessed by the grid walking test (J), cylinder test (K), and adhesive removal test (L) at baseline and on day 4 and 7 after tMCAO. n = 7/group. The data are presented as the means ± SEMs. **P < 0.01; ***P < 0.001; #P < 0.05; ##P < 0.01; ###P < 0.001, P < 0.05; ††P < 0.01

References

    1. Soto-Tinoco E, Guerrero-Vargas NN, Buijs RM. Interaction between the hypothalamus and the immune system. Exp Physiol. 2016;101:1463–71. - PubMed
    1. Pavlov VA, Tracey KJ. Neural regulation of immunity: molecular mechanisms and clinical translation. Nat Neurosci. 2017;20:156–66. - PubMed
    1. Vahidy FS, Parsha KN, Rahbar MH, Lee M, Bui TT, Nguyen C, et al. Acute splenic responses in patients with ischemic stroke and intracerebral hemorrhage. J Cereb Blood Flow Metab. 2016;36:1012–21. - PMC - PubMed
    1. Chiu NL, Kaiser B, Nguyen YV, Welbourne S, Lall C, Cramer SC. The volume of the spleen and its correlates after acute stroke. J Stroke Cerebrovasc Dis. 2016;25:2958–61. - PMC - PubMed
    1. Udit S, Blake K, Chiu IM. Somatosensory and autonomic neuronal regulation of the immune response. Nat Rev Neurosci. 2022;23:157–71. - PMC - PubMed

MeSH terms

LinkOut - more resources