. 2025 Sep;5(9):1790-1809.
doi: 10.1038/s43587-025-00918-x. Epub 2025 Jul 14.

Extracellular vesicles from antler blastema progenitor cells reverse bone loss and mitigate aging-related phenotypes in mice and macaques

Affiliations

Extracellular vesicles from antler blastema progenitor cells reverse bone loss and mitigate aging-related phenotypes in mice and macaques

Yiming Hao et al. Nat Aging. 2025 Sep.

Abstract

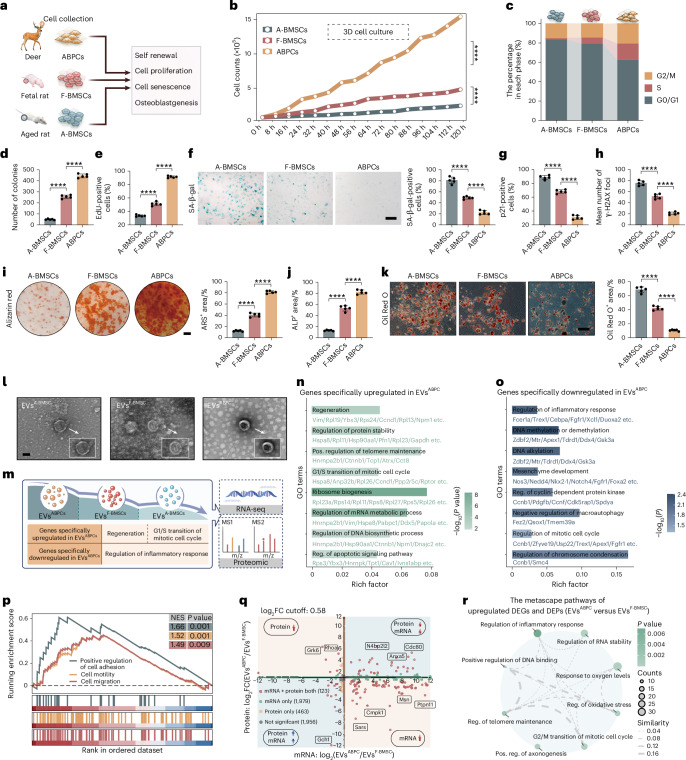
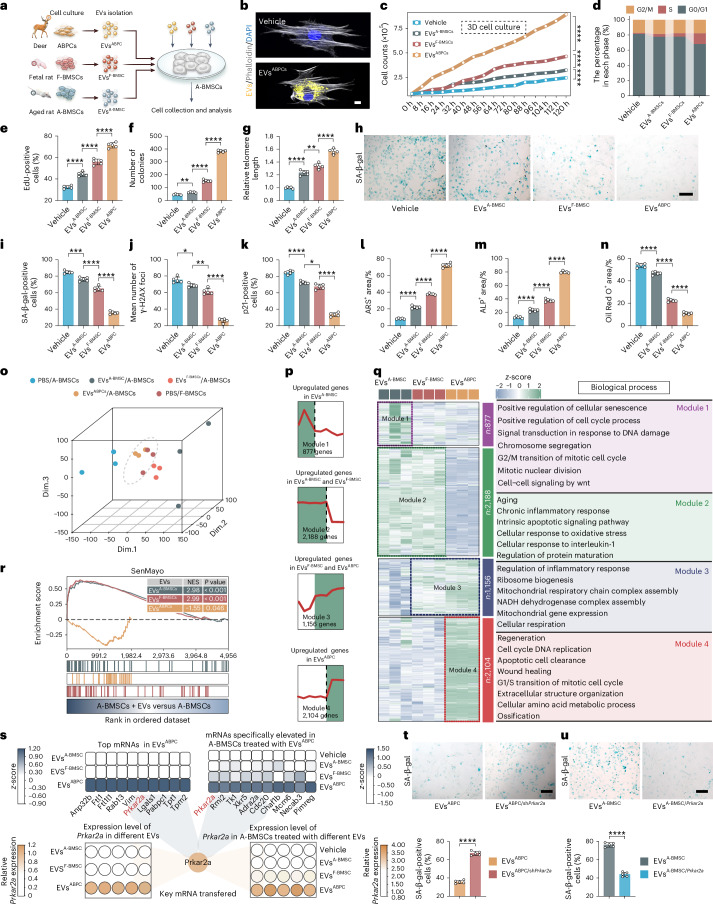
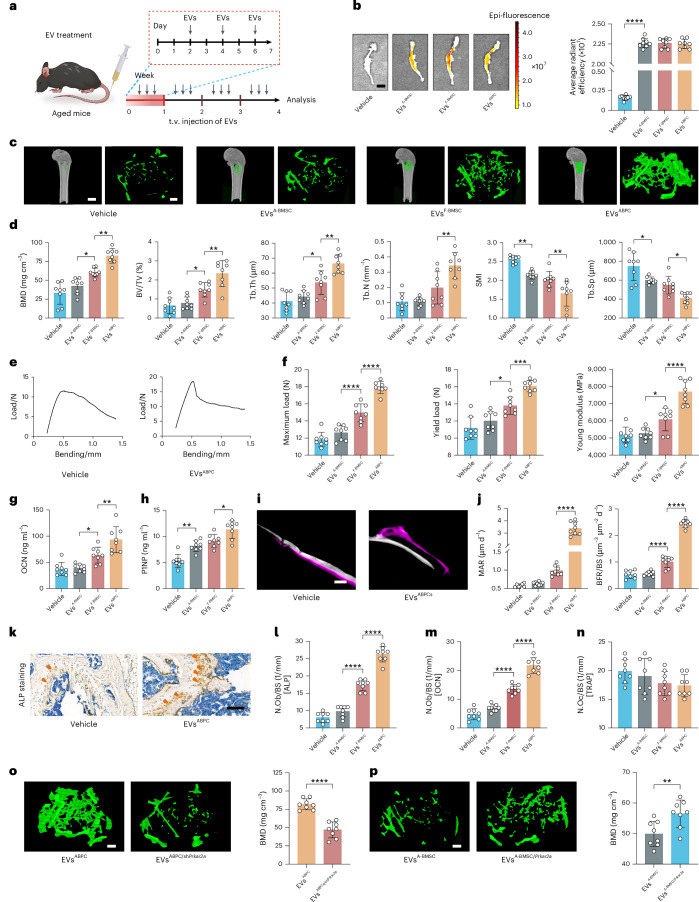
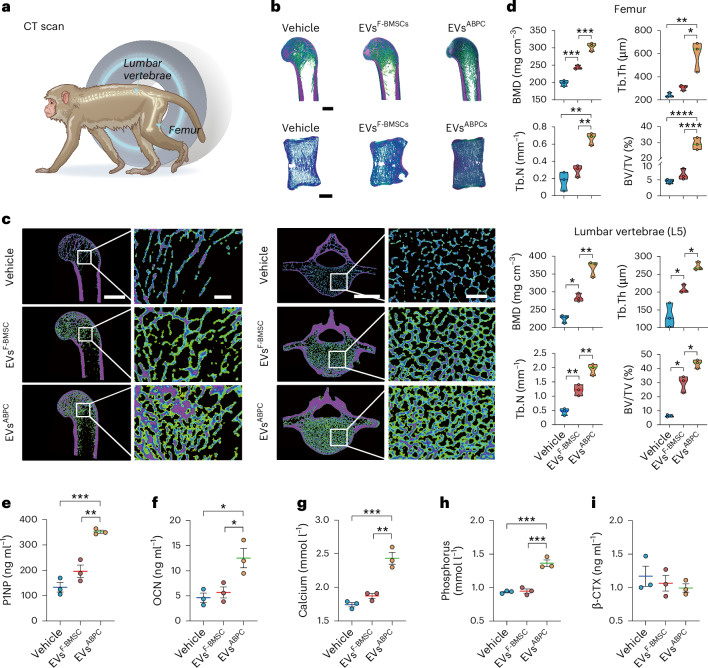
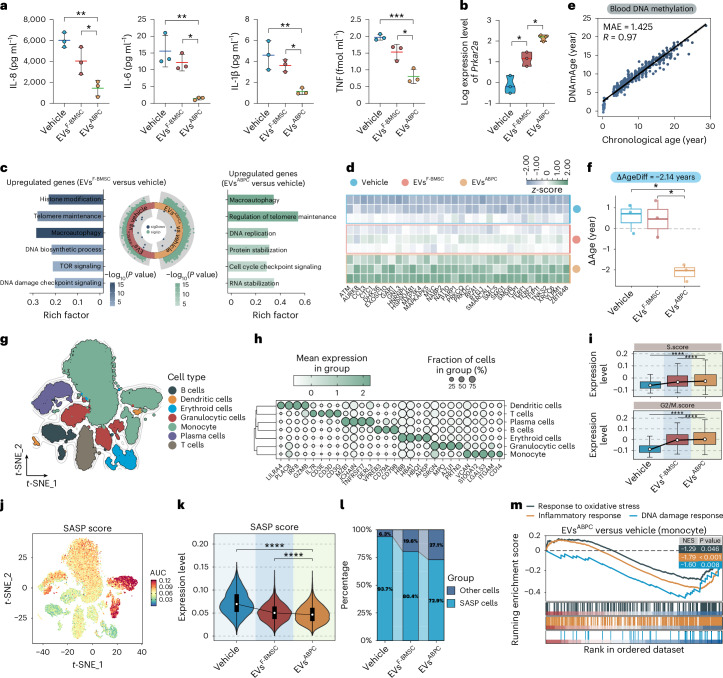
Antler blastema progenitor cells (ABPCs) are a distinct population of skeletal mesenchymal stem cells found in regenerating deer antlers, with strong stemness and renewal capacity in vitro. Stem cell-derived extracellular vesicles (EVs) are emerging as potential therapeutic candidates that can mediate donor cells' beneficial effects. Here, we tested the effects of ABPC-derived EVs (EVsABPC) on aging in mice and rhesus macaques (Macaca mulatta). We identified a variety of unique factors in EVsABPC and showed that in vitro, EVsABPC attenuated phenotypes of senescence in bone marrow stem cells. In aged mice and macaques, EVsABPC substantially increased femoral bone mineral density. Further, intravenous EVsABPC improved physical performance, enhanced cognitive function and reduced systemic inflammation in aged mice, while reversing epigenetic age by over 3 months. In macaques, EVABPC treatment was also neuroprotective, reduced inflammation, improved locomotor function and reduced epigenetic age by over 2 years. Our findings position ABPCs as an emerging and practical source of EVs with translational value for healthy aging interventions.


Conflict of interest statement

Competing interests: The authors declare no competing interests.

Figures

Fig. 1
Fig. 1. Biological properties of ABPCs and EVsABPC.
a, The schematic diagram for the procedures of cell collection and functional characterization of ABPCs, F-BMSCs and A-BMSCs. b, Growth curves for cells over a 120-h period of culture. Cell counts were measured every 8 h. c, The proportion of cells in different cell-cycle phase at 72 h after culture using flow cytometry. d,e, CFU-F ability (d) and the ratios of EdU-positive cells (e) after culture of different cells (n = 5). f, Representative images of SA-β-gal staining in the three groups (left) and quantitative analysis (right) (n = 5). Scale bar, 200 μm. g, Quantification of p21 positive cells in the three groups (n = 5). h, Number of γ-H2AX foci in 4,6-diamidino-2-phenylindole (DAPI)-stained nuclei of cells (n = 5). i, Representative images of Alizarin Red staining (ARS) (left) and its quantitative analysis (right) (n = 5). Scale bar, 3 mm. j, Quantitative analysis of ALP-positive staining area (n = 5). k, Representative images of Oil Red O staining (left) and its quantitative analysis (right) (n = 5). Scale bar, 100 μm. l, Morphology of EVs detected by transmission electron microscopy. Scale bar, 100 nm. m, Schematic diagram shows the transcriptomic and proteomic analysis of EVsA-BMSC, EVsF-BMSC, and EVsABPC. n,o, GO term enrichment analysis of specifically upregulated (n) and downregulated (o) DEGs in EVsABPC compared to both EVA-BMSC and EVF-BMSC groups. p, GSEA for the enrichment of gene sets in EVsABPC compared to EVsF-BMSC. q, Scatter-plot for multi-omics analysis (transcriptome and proteome) between EVsABPC and EVsF-BMSC. The x axis represents the log2(FC) at mRNA level and the y axis represents the log2(FC) at protein level. FC, fold change. r, Network diagram represented the Metascape pathways of upregulated DEGs and DEPs in EVsABPC compared to EVsF-BMSC. Each node corresponds to a specific biological process (BP) and the size of the node is proportional to the enrichment score. Statistical significance was calculated by two-way ANOVA-Bonferroni (b) or one-way ANOVA with Bonferroni’s multiple comparisons test (ck). Data are presented as mean ± s.d. ****P < 0.0001. Source data
Fig. 2
Fig. 2. EVsABPC attenuate phenotypes of senescence in BMSCs.
a, The schematic diagram for the procedure of cell culture, EVs isolation, treatment and related experiments. b, Internalization of PBS (top) and PKH26-labeled EVsABPC (bottom, yellow) in A-BMSCs stained with DAPI (blue) and phalloidin (white). Scale bar, 10 μm. c, Growth curves of A-BMSCs with different treatments for 120 h. d, Proportion of A-BMSCs in different cell-cycle phase detected after treatment with EVs for 72 h by flow cytometry. eg, EdU-positive ratios (e), CFU-F capacity (f) and telomere lengths (g) of A-BMSCs with different treatments for 72 h (n = 5). h, Representative SA-β-gal staining of A-BMSCs treated with different EVs. Scale bar, 200 μm. ik, The SA-β-gal-positive cell ratios (i), γ-H2AX foci cell number (j) and p21-positive cell ratios (k) of A-BMSCs. (n = 5). ln, The proportion of positive area for ARS (l), ALP (m) and Oil Red O (n) staining in A-BMSCs (n = 5). o, PCA of the transcriptomic characteristics in A-BMSCs treated with PBS, EVsA-BMSC, EVsF-BMSC and EVsABPC, as well as PBS-treated F-BMSCs. The EVABPC-treated A-BMSCs exhibited a similar transcript profile to PBS-treated F-BMSCs, as indicated by the dashed circle. p,q, Mufzz-based clustering of DEGs in A-BMSCs treated with different EVs. Clustering trend plots showing the expression of genes across different modules (p). Heatmap of clustered genes (modules) with associated BP (q). r, GSEA of SenMayo in A-BMSCs treated with different EVs. s, Transcriptomic analysis showed that Prkar2a is the top cargo specifically in EVsABPC and abundant in EVABPC-treated cells (top). The relative expression levels of Prkar2a in EVsABPC and EVABPC-treated cells by real–time PCR (bottom). t,u, SA-β-gal staining in A-BMSCs with EVsABPC, EVs from Prkar2a-knockdown ABPCs (EVsABPC/shPrkar2a) (t), with EVsA-BMSC, EVs from Prkar2a-overexpressing A-BMSCs (EVsA-BMSC/Prkar2a) (u) (n = 5). Scale bar, 200 μm. Statistical significance was calculated by two-way ANOVA-Bonferroni (c), one-way ANOVA with Bonferroni’s multiple comparisons test (dg and in) or two-tailed Student’s t-test (t,u). Data are presented as mean ± s.d. *P < 0.05, **P < 0.01, ***P < 0.001 and ****P < 0.0001. Source data
Fig. 3
Fig. 3. EVsABPC promote osteoblastic bone formation in aged mice.
a, The schematic for EV treatment in aged mice. Aged mice were treated with PBS (vehicle) or different EVs (40 μg per time), three times weekly for a duration of 4 weeks. b, Ex vivo fluorescence images (left) and average radiant efficiency (right) of femurs at 48 h after injection of DiR-labeled EVs (n = 8). Scale bar, 750 μm. c, Representative micro-CT reconstruction images of femurs from mice in different groups. Scale bar, 1,500 μm (left) or 300 μm (right) d, Quantitative analysis of BMD, BV/TV, Tb.Th, Tb.N, SMI and Tb.Sp in femurs after EV treatment (n = 8). e, Representative images of the mechanical strength of femurs in mice treated with PBS or EVsABPC. f, Quantification of the maximum load, yield load and Young’s modulus in the femurs after EVs treatment (n = 8). g,h, The serum concentration of OCN (g) and P1NP (h) post-EVs treatment (n = 8). i, Representative images of the newly formed trabecular bone in the femurs of mice using calcein AM (magenta) and Alizarin Red (white) staining. Scale bar, 50 μm. j, Quantitative analysis of MAR and BFR/BS in mice after EV treatment (n = 8). k, Representative images of ALP staining in the femurs of mice treated with PBS or EVsABPC, showing the increased number of ALP-positive cells in EVsABPC group (red arrows). Scale bar, 100 μm. ln, Quantification of ALP (l), OCN (m) for osteoblast surfaces and TRAP (n) for osteoclast surfaces in femurs from mice with EVs treatment (n = 8). N.Ob/BS, number of osteoblasts per bone surface; N.Oc/BS, number of osteoclasts per bone surface. o,p, Representative micro-CT analysis of femurs from aged mice treated with EVsABPC, EVsABPC/shPrkar2a (o) or EVsA-BMSC, EVsA-BMSC/Prkar2a (p) (n = 8). Scale bar, 300 μm. Statistical significance was calculated by one-way ANOVA with Bonferroni’s multiple comparisons test (b,d,fh,j,ln) or two-tailed Student’s t-test (o,p). Data are presented as mean ± s.d. *P < 0.05, **P < 0.01, ***P < 0.001 and ****P < 0.0001. Source data
Fig. 4
Fig. 4. EVsABPC mitigate multiple age-associated phenotypes and transcriptomic signature in aged mice.
a,b, Quantification of motor performance assessment by rotarod tests (a) and treadmill tests (b) (n = 8). c, SASP expression level of related inflammatory factors (IL-8, IL-6, IL-1β and TNF) in serum post-EV treatment (n = 8). d, Spearman correlation analysis was conducted to compare gene profiles in different EV-treated aged mice with ‘Young’ and ‘Old’ gene sets derived from young mice (8 weeks) and aged mice (18 months) (n = 3). Spearman’s correlation coefficient (Corr) is displayed. The fit spline (green or blue lines) and 95% confidence intervals (green or blue areas) are shown. e, Aging-related biological pathways were significantly downregulated in the EVABPC group. f, Correlation analysis of chronological age and DNAmAge for mouse blood. The Pearson’s correlation coefficient (R) is displayed (P < 0.0001). The fit spline (black line) is shown. g, The rescue of DNAmAge in aged mice after EV treatment (n = 3). Box plots display median (center line), 25th and 75th percentiles (box limits) and 1.5× interquartile range (IQR) (whiskers). h,i, Representative images of SA-β-gal staining in organs of aged mice after EVs treatment (h) and their quantitative analysis (i) (n = 8). Scale bars, 50 μm (liver, skin and brain) and 200 μm (kidney and intestine). j, Cluster analysis of upregulated DEGs specifically enriched in multi-organs with EVABPC treatment (n = 3). k,l, Spatial working memory was assessed using the Y maze as the discrimination index for the novel arm (k) and their quantitative analysis (l) (n = 8). m,n, Object recognition memory was assessed by NOR as the percentage of time exploring the novel object (m) and their quantitative analysis (n) (n = 8). o,p, Anxiety-like behavior was assessed by EPM as the percentage of open arm (o) and their quantitative analysis (p) (n = 8). Statistical significance was calculated by one-way ANOVA with Bonferroni’s multiple comparisons test (ac,g,i,l,n,p). Data are presented as mean ± s.d. *P < 0.05, **P < 0.01, ***P < 0.001 and ****P < 0.0001. Source data
Fig. 5
Fig. 5. EVsABPC enhance bone mass in aged rhesus macaques.
a, The schematic diagram of CT scans for the femur and lumbar vertebrae (L5) of aged rhesus macaques across groups. Aged rhesus macaques were treated with PBS (vehicle) or different EVs (15 mg per time) every two weeks for ten administrations. b, Representative 3D CT reconstruction images of the femur (top) and lumbar vertebrae (L5) (bottom). Scale bar, 5,000 μm. c, Representative 2D CT reconstruction images of the femur (left) and lumbar vertebrae (L5) (right). Scale bar, 5,000 μm (first and third columns of c), 500 μm (second and fourth columns of c). d, Quantitative analysis of the trabecular bone in femur and lumbar vertebrae (L5) from aged rhesus macaques in the three groups (n = 3). ei, Quantitative concentration analysis of serum biomarkers, including P1NP (e), OCN (f), calcium (g), phosphorus (h) and β-CTX (i) in aged rhesus macaques post-EV treatments (n = 3). Statistical significance was calculated by one-way ANOVA with Bonferroni’s multiple comparisons test (di). Data are presented as mean ± s.d. *P < 0.05, **P < 0.01, ***P < 0.001 and ****P < 0.0001. Source data
Fig. 6
Fig. 6. EVsABPC improve motor decline in aged rhesus macaques.
a, Recording of rhesus macaques’ movements, captured by four synchronized high-speed cameras during 35 min of free movement and resting, including a total of 14 movements. b, Five movement types (walking, turning right, turning left, looking left and head raising) exhibited significant differences in the EVABPC group compared to the other groups (n = 3). c, Location heatmaps visualize the motion trajectory of 21 body parts, with different colors distinguishing various body parts. d, Speed heatmap shows the velocity of the motion trajectory projected onto a two-dimensional plane parallel to the cage bottom. e, Motion speed for three body parts (head, back and tail root) reveals significant differences among different groups (n = 3). f, The schematic diagram shows the principle of rotating Brinkman board task (top). The task involves macaques retrieving 32 food pieces from a rotating board. The board rotates clockwise at a speed of 5 rpm. The task has four stages (1) start, begins the task; (2) research, searches for food pieces; (3) grasp, grasps a food piece; and (4) pull, pulls the food piece toward itself. g, Quantification of rotating task time (top) and success rate (bottom) among different macaque groups (n = 3). h, The schematic diagram shows two states (exercise and sleep) monitored by a noninvasive monitor neck collar for 7 consecutive days. i, Quantification of total step counts in aged rhesus macaques treated with EVs during a 7-day consecutive recording period (n = 3). Statistical significance was calculated by one-way ANOVA with Bonferroni’s multiple comparisons test (b,e,g,i). Data are presented as mean ± s.d. *P < 0.05, **P < 0.01, ***P < 0.001 and ****P < 0.0001. Source data
Fig. 7
Fig. 7. EVsABPC alleviate senescence in blood and bone marrow niche of aged rhesus macaques.
a, Serum level of inflammatory factors of aged rhesus macaques treated with EVs (n = 3). b, Relative expression level of Prkar2a in blood samples from aged rhesus macaques by RNA-seq (n = 3). c, The biological pathways of upregulated genes in EVsF-BMSC (left) and EVsABPC (right), as compared to vehicle. d, Genes related to telomere maintenance pathway in blood samples. e, Correlation analysis of chronological age and DNAmAge for rhesus macaques’ blood. The Pearson’s correlation coefficient (R) is displayed (P < 0.0001). The fit spline (black line) is shown. f, The rescue of DNAmAge in aged rhesus macaques by EVsABPC (n = 3). Boxplots display median (center line), IQR (box limits) and 1.5 × IQR (whiskers). gm, scRNA-seq analyzes the immune-lineage cells in bone marrow. A t-SNE plot shows the different cell types in bone marrow (n = 23,511 cells) (g). The expression levels of marker genes in seven immune-lineage cells (h). The S and G2/M phases scores across seven immune-lineage cells with different treatments. Boxplots display mean (white dot), IQR (box limits) and 1.5 × IQR (whiskers, from minimum to maximum). Lines connecting the medians across groups illustrate the overall trend of the data distribution (i). SASP gene expression strength across different cell types (j). The SASP gene expression scores across the whole immune-lineage cells. Violin plots depict the data distribution (kernel density), density (violin width), IQR (embedded box), mean (white dot) and mean ± s.d. (whiskers). Lines connecting the medians across groups illustrate the overall trend of the data distribution (k). The ratios of SASP-expressing cells across the whole immune-lineage cells (l). GSEA of three regulated pathways (m). Statistical significance was calculated by one-way ANOVA with Bonferroni’s multiple comparisons test (a,b,f,i,k). Data are presented as mean ± s.d. *P < 0.05, **P < 0.01, ***P < 0.001 and ****P < 0.0001. Source data
Fig. 8
Fig. 8. EVsABPC alleviate brain aging in aged rhesus macaques.
a, The schematic diagram shows using SPECT/CT to assess the situation of EVsABPC reaching the brain of aged rhesus macaques and utilizing MRI to investigate the effect of EVs on the brain structure of aged rhesus macaques. b, Biodistribution and SPECT/CT imaging of aged rhesus macaques’ brain, as indicated by dashed circles, at 1, 4 and 8 h after intravenous injection of [131I]NaI and131I-EVsABPC. c,d, Quantitative analysis of radioactive brain uptake with SUV (c) and TBR with adjacent background muscle (d) following 1, 4 and 8 h after intravenous injection of purified [131I]NaI and 131I-EVsABPC (n = 3). eg, The percentage of changes in TIV (e), GMV (f) and WMV (g) compared to baseline over a 20-week treatment period among the groups (n = 3). h,i, The spatial brain maps for the percentage of changes in GMV (h) and WMV (i) compared to baseline, with the different colors indicating the extent of the changes in the average for each group, respectively. The x, y and z coordinates represent the 3D spatial positions within the brain, utilizing a Montreal Neurological Institute coordinate system. Statistical significance was calculated by two-way ANOVA with Bonferroni’s multiple comparisons test (c,d), or nonparametric Kruskal–Wallis test with FWE correction for multiple comparison correction followed by post hoc pairwise between-group comparison conducted by one-tailed Mann–Whitney U-tests (eg). Data are presented as mean ± s.d. *PFWE < 0.05 and ****P < 0.0001. Source data
Extended Data Fig. 1
Extended Data Fig. 1. Characterization of ABPCs and EVsABPCs.
a, Flow cytometry analysis of the cell-cycle phase distribution in A-BMSCs, F-BMSCs, and ABPCs. bf, Representative images depicting staining for CFU-F (b), EdU (c), p21 (d), γ-H2AX (e) and ALP (f) staining of cells from the three cell types. Scale bar, 5 mm (b), 200 μm (c and d), 100 μm (e) or 3 mm (f). g, Representative morphological images of cells by transmission electron microscopy. Scale bar, 2 mm (top), 200 μm (bottom). h, Diameter distribution of EVs derived from different cell types by NTA. i, Mean diameters of EVs from three distinct cell sources (n = 5). j, Zeta potential of the EVs was determined by tunable resistance pulse sensing (TRPS) (n = 5). Data points are represented by circles. Boxplots display median (center line), IQR (box limits), and 1.5 × IQR (whiskers). k, CD9, CD81, and TSG101 protein levels in EVs from three distinct cell sources were determined by western blotting. l, Mean concentrations of EVs from three distinct cell sources (n = 5). m, PCA of the transcriptomic characteristics in EVsA-BMSCs, EVsF-BMSCs, and EVsABPCs. n,o, Volcano plot illustrated DEGs (n) and DEPs (o) between EVsABPCs and EVsF-BMSCs. p, Network diagram represented the metascape pathways of downregulated DEGs and DEPs in EVsABPCs compared to EVsF-BMSCs. Each node corresponds to a specific biological process, and the size of the node is proportional to the enrichment score. The similarity between pathways is indicated by the thickness of the connecting lines. Statistical significance was calculated by one-way ANOVA with Bonferroni’s multiple comparisons test (i and l). Data are presented as mean ± s.d. ****P < 0.0001. Source data
Extended Data Fig. 2
Extended Data Fig. 2. D-BMSCs and EVsD-BMSCs demonstrate similar rejuvenating capabilities compared to F-BMSCs and EVsF-BMSCs.
a, Representative images of EdU staining and the quantitative analysis of EdU-positive cells (n = 5). Scale bar, 200 μm. b, Representative images of SA-β-Gal staining and their quantitative analysis (n = 5). Scale bar, 200 μm. c, Representative images of γ-H2AX staining of cells and their quantitative analysis (n = 5). Scale bar, 100 μm. df, Representative images of ARS (d), ALP (e), and Oil Red O (f) staining of cells and their quantitative analysis (n = 5). Scale bar, 3 mm (d and e) or 100 μm (f). g, Morphology of EVs isolated from D-BMSCs (EVsD-BMSCs), Scale bar, 100 nm. h, Diameter distribution of EVsD-BMSCs as revealed by NTA. i, The zeta potential of the EVsD-BMSCs. The data points are represented by circles. Boxplots display median (center line), IQR (box limits), and 1.5 × IQR (whiskers). j, CD9, CD81, and TSG101 protein levels in EVsD-BMSCs by western blotting. k, Mean EVs concentration in different EVs groups (n = 5). l, Representative images of EdU staining of A-BMSCs treated with different EVs and their quantitative analysis (n = 5). Scale bar, 200 μm. m, Representative images of SA-β-Gal staining of A-BMSCs treated with different EVs and their quantitative analysis (n = 5). Scale bar, 200 μm. n, Representative images of γ-H2AX staining of A-BMSCs treated with different EVs and their quantitative analysis (n = 5). Scale bar, 100 μm. oq, Representative images of ARS (o), ALP (p), and Oil Red O (q) staining of A-BMSCs treated with different EVs and their quantitative analysis (n = 5). Scale bar, 3 mm (o and p) or 100 μm (q). Statistical significance was calculated by one-way ANOVA with Bonferroni’s multiple comparisons test (af and kq). Data are presented as mean ± s.d. ****P < 0.0001. Source data
Extended Data Fig. 3
Extended Data Fig. 3. Rejuvenation of A-BMSCs after EVsABPCs treatment.
a, Internalization of PKH26-labeled EVsA-BMSCs and EVsF-BMSCs (yellow) within A-BMSCs stained with DAPI (blue) and phalloidin (white), and quantification of PKH26-labeled EVs in A-BMSCs (n = 5). Scale bar, 10 μm. bd, Representative images of SA-β-Gal (b), ARS (c), and Oil Red O (d) staining in A-BMSCs following EVsABPCs treatment in a dose-dependent manner and their quantitative analysis (n = 5). Scale bar, 200 μm (b), 3 mm (c), or 100 μm (d). e, Flow cytometric analysis was performed to assess the cell-cycle phase in A-BMSCs treated with different EVs. fl, Representative images of CFU-F (f), EdU (g), γ-H2AX (h), p21 (i), ARS (j), ALP (k), and Oil red O (l) staining in A-BMSCs following different EVs treatment. Scale bar, 5 mm (f), 200 μm (g and i), 100 μm (h and l) or 3 mm (j and k). Statistical significance was calculated by one-way ANOVA with Bonferroni’s multiple comparisons test (ad). Data are presented as mean ± s.d. **P < 0.01, ***P < 0. 001, and ****P < 0.0001. Source data
Extended Data Fig. 4
Extended Data Fig. 4. EVsABPCs rejuvenate A-BMSCs in transcriptomic signature and phenotype.
ad, GSEA analysis revealed the regulation of DNA repair and maintenance (a), epigenetic alterations and telomere attrition (b), SASP (c), and chronic inflammation and stem cell exhaustion (d) in A-BMSCs following different EVs treatments. e, The relative expression levels of Prkar2a in in EVsABPCs treated and EVsABPCs/shPrkar2a treated A-BMSCs by qPCR (n = 5). f, The relative expression levels of Prkar2a in in EVsA-BMSCs treated and EVsA-BMSCs/Prkar2a treated A-BMSCs by qPCR (n = 5). g,h, Representative images of EdU (g) and ARS (h) staining in A-BMSCs treated with EVsABPCs and EVsABPCs/shPrkar2a and their quantitative analysis (n = 5). Scale bar, 200 μm (g) or 3 mm (h). i,j, Representative images of EdU (i) and ARS (j) staining in A-BMSCs treated with EVsA-BMSCs and EVsA-BMSCs/Prkar2a and their quantitative analysis (n = 5). Scale bar, 200 μm (i) or 3 mm (j). Statistical significance was calculated by two-tailed Student’s t-test (ej). Datr are presented as mean ± s.d. ****P < 0.0001. Source data
Extended Data Fig. 5
Extended Data Fig. 5. EVsABPCs mitigate age-related bone loss in aged mice.
a, Ex vivo fluorescence images and average radiant efficiency of organs at 48 h after tail vein injection of DiR-labeled EVs. From left to right: heart, liver, spleen, lung, kidney (n = 8). Scale bar, 1,000 μm. b, Representative micro-CT images of femoral cortical bone. Scale bar, 150 μm. c, Quantitative analysis of cortical bone parameters, including Ct.V, Ct.Th, Ct.Ar, and Tt.Ar from different groups (n = 8). d, Representative images of the mechanical strength of femurs from mice treated with EVsA-BMSCs or EVsF-BMSCs. e, The concentration of serum CTX-1 (n = 8). f, Representative images of newly formed trabecular bone, labeled with calcein AM (magenta) and alizarin red (white) in mice treated with EVsF-BMSCs and EVsA-BMSCs. Scale bar, 50 μm. g, A schematic diagram of immunohistochemical staining (ALP, OCN and TRAP staining) in femurs. hj. Representative images of ALP (h), OCN (i), and TRAP (j) staining in femurs from mice treated with EVs, with the ALP-, OCN-, or TRAP-positive cells presented by orange arrow. Scale bar, 100 μm. km, Representative micro-CT reconstruction images (k) and quantitative analysis of the trabecular (l) and cortical bone (m) from mice treated with EVsABPCs or EVsABPCs/shPrkar2a (n = 8). Scale bar, 1,500 μm. np, Representative micro-CT reconstruction images (n) and quantitative analysis of the trabecular (o) and cortical bone (p) in mice treated with EVsA-BMSCs or EVsA-BMSCs/Prkar2a (n = 8). Scale bar, 1,500 μm. Statistical significance was determined by one-way ANOVA with Bonferroni’s multiple comparisons test (a, c, and e), two-tailed Student’s t-test (l, m, o, and p in addition to the third plot), or nonparametric Mann–Whitney test (the third plot of p). Data are presented as mean ± s.d. *P < 0.05, **P < 0.01, ***P < 0.001, and ****P < 0.0001. Source data
Extended Data Fig. 6
Extended Data Fig. 6. The effects of EVsABPCs mitigate organ senescence in aged mice.
a,b, Representative images of Masson’s trichrome staining for liver (a) and kidney (b). Scale bar,100 μm (top of a and b) or 350 μm (bottom of a and b). c, Representative images of immunofluorescence staining of TUNEL in the kidney. Scale bar, 200 μm. d,e, Representative images of H&E (d) and Masson’s trichrome (e) staining for skin. Scale bar, 50 μm (d) or 100 μm (e). f, Representative immunofluorescence images of γ-H2AX in skin. Scale bar, 500 μm. g, Representative immunofluorescence images of γ-H2AX staining in brain. Scale bar, 100 μm. h,i, The percentage of collagen fiber area in liver (h) and kidney (i) measured by the Masson’s trichrome staining (n = 8). j, Quantitative analysis of expression level of TUNEL in kidney (n = 8). kn, Quantitative analysis of epidermal thickness (k) and number of epidermal cells per millimeter thickness (l) measured by H&E staining, as well as dermal thickness (m) and collagen content (n) measured by the Masson’s trichrome staining (n = 8). o, Quantitative analysis of expression level of γ-H2AX in skin (n = 8). p, Quantitative analysis of expression level of γ-H2AX in brain (n = 8). q, Clustering trend plots showed the numbers of DEGs across different organs. r, Cluster analysis showed the main upregulated DEGs in liver, kidney, skin, intestine, brain and pan-tissues treated with EVsABPCs. su, Representative tracking images of Y maze (s), NOR (t), and EPM (u) in EVsA-BMSCs and EVsF-BMSCs groups. v, Ex vivo fluorescence images of brains at 48 h after injection of DiR-labeled EVs by tail vein and their quantitative analysis (n = 8). Scale bar, 500 μm. Statistical significance was calculated by one-way ANOVA with Bonferroni’s multiple comparisons test (hp and v). Data were presented as mean ± s.d. ***P < 0.001, and ****P < 0.0001. Source data
Extended Data Fig. 7
Extended Data Fig. 7. EVsABPCs rescue multiple age-associated phenotypes in aged female mice.
a, Representative Micro-CT reconstruction images of femurs with different EVs treatment from female mice. Scale bar, 1,500 μm (left) or 300 μm (right). b, Quantitative analysis of trabecular bone from different groups, including BMD, BV/TV, Tb.Th, Tb.N, SMI, and Tb.Sp (n = 8). c,d, Representative images of the mechanical strength of femurs in female mice (c). Quantitative analysis of the maximum load, yield load, and Young’s modulus (n = 8) (d). e,f, Representative images (e) and quantitative analysis (f) of MAR and BFR/BS in female mice from different groups (n = 8). Scale bar, 50 μm. g, The serum concentration of OCN and P1NP in female mice from different groups (n = 8). h, Quantification of the changes in motor coordination (left) and fatigue resistance (right) tests in female mice (n = 8). i, The serum concentration of inflammatory factors (IL-8, IL-6, IL-1β and TNF) levels with EVs treatment (n = 8). j, Representative SA-β-gal staining and quantification for SA-β-Gal activity in liver, kidney, skin, and brain (from top to bottom) of aged female mice with EVs treatment (n = 8). Scale bar, 50 μm (liver, skin, and brain) or 200 μm (kidney). k, Spatial working memory was assessed using the Y maze as the discrimination index for the novel arm (n = 8). l, Object recognition memory was assessed by NOR as the percentage of time exploring the novel object (n = 8). m, Anxiety-like behavior was assessed by EPM as the percentage of open arm (n = 8). Statistical significance was calculated by one-way ANOVA with Bonferroni’s multiple comparisons test (b, d, and fm). Data are presented as mean ± s.d. *P < 0.05, **P < 0.01, ***P < 0.001, and ****P < 0.0001. Source data
Extended Data Fig. 8
Extended Data Fig. 8. EVsABPCs ameliorate bone loss and improved locomotor functions in aged rhesus macaques.
a, Representative three-dimensional CT reconstructed images of cortical bone, with regions of interest colored in purple. Scale bar, 2,500 μm. b, Quantitative analysis of cortical bone in aged rhesus macaques following EVs treatments, including Ct.V, Ct.Th, Ct.Ar, and Tt.Ar (n = 3). cf, Quantification of exercise model, including steps per minute (c), as well as sleep model, including total sleep time (d), wake after sleep onset (e), and number of awakenings (f) in aged rhesus macaques treated with EVs during the noninvasive monitor neck collar test. Data was collected daily over a consecutive 7-day recording period (n = 3). Statistical significance was calculated by one-way ANOVA with Bonferroni’s multiple comparisons test (b, c, and f), or nonparametric Kruskal–Wallis test with Dunn’s multiple comparisons test (d and e). Data were presented as mean ± s.d. ***P < 0.001. Source data
Extended Data Fig. 9
Extended Data Fig. 9. Indicators of blood examination and bone marrow scRNA-seq in aged rhesus macaques.
a, The counts of white blood cells (WBC), red blood cells (RBC), hemoglobin (HGB), and platelets (PLT) in the blood, along with serum levels of creatine kinase (CK), blood urea nitrogen (BUN), alanine aminotransferase (ALT), aspartate aminotransferase (AST), total bilirubin (TBIL), albumin (ALB), globulin (GLO), albumin-to-globulin ratio (A/G), glucose (GLU), total cholesterol (CHOL), triglycerides (TRIG), high-density lipoprotein cholesterol (HDL), low-density lipoprotein cholesterol (LDL), and creatinine (CRE2) were measured (n = 3). b, t-SNE plots were generated to depict the expression of specific genes representing seven cell populations: dendritic cells (LILRA4), T-cells (CD3E), plasma cells (MZB1), B-cells (CD79A), erythroid cells (HBA1), granulocytes (MPO), and monocytes (VCAN). c, A combined two-dimensional visualization of single-cell clusters in aged rhesus macaques with different treatments. d, A violin plot was utilized to display the scores of SASP gene expression across seven immune cell lineages (n = 3). Violin plots depict the data distribution (kernel density), density (violin width), IQR (embedded box), mean (white dot), and mean ± s.d. (whiskers). Lines connecting the medians across groups illustrate the overall trend of the data distribution. e, GSEA showed the regulated pathways in the monocyte subpopulation when comparing the EVsF-BMSCs group to the vehicle group. Statistical significance was calculated by one-way ANOVA with Bonferroni’s multiple comparisons test (a and d). Data were presented as mean ± s.d. **P < 0.01, and ****P < 0.0001. Source data
Extended Data Fig. 10
Extended Data Fig. 10. Changes related to brain aging in EVsABPCs-treated aged rhesus macaques.
a, A quantitative analysis was performed to evaluate changes in cortical thickness and surface area following EVs treatment (n = 3). b, VBM analysis showed region variations in GMV among groups, with red areas indicating significant differences in GMV. Quantitative analysis of the significantly different brain regions in GMV following different treatments (n = 3). c, The comparison of GMV between pre-treatment and post-treatment at an uncorrected P-value threshold was performed specifically for the EVsABPCs group. Quantification of GMV changes between pre-treatment and post-treatment in the EVsABPCs group was conducted without correction for multiple comparisons (n = 3). The lines connect the same individuals, showing the trend between pre- and post-treatment. d, A quantitative analysis of the changes of FA and RD following EVs treatment (n = 3). Statistical analyses were performed using the Kruskal–Wallis nonparametric test followed by post hoc pairwise comparisons followed by one-tailed Mann–Whitney U-tests with FWE correction (a and d), or not (b); one-tailed Wilcoxon matched-pairs signed rank test for within-group comparisons (c). Data were presented as mean ± s.d. Uncorrected *P < 0.05. Source data

References

    1. Prince, M. J. et al. The burden of disease in older people and implications for health policy and practice. Lancet385, 549–562 (2015). - PubMed
    1. Childs, B. G. et al. Senescent cells: an emerging target for diseases of ageing. Nat. Rev. Drug Discov.16, 718–735 (2017). - PMC - PubMed
    1. Brunet, A., Goodell, M. A. & Rando, T. A. Ageing and rejuvenation of tissue stem cells and their niches. Nat. Rev. Mol. Cell Biol.24, 45–62 (2023). - PMC - PubMed
    1. López-Otín, C., Blasco, M. A., Partridge, L., Serrano, M. & Kroemer, G. Hallmarks of aging: an expanding universe. Cell186, 243–278 (2023). - PubMed
    1. Sanz-Ros, J. et al. Small extracellular vesicles from young adipose-derived stem cells prevent frailty, improve health span, and decrease epigenetic age in old mice. Sci. Adv.8, eabq2226 (2022). - PMC - PubMed