

Global trends of chronic kidney disease from 1990 to 2021: a systematic analysis for the global burden of disease study 2021
- PMID: 40660180
- PMCID: PMC12257723
- DOI: 10.1186/s12882-025-04309-7
Global trends of chronic kidney disease from 1990 to 2021: a systematic analysis for the global burden of disease study 2021
Abstract
Background: Chronic kidney disease (CKD) is a significant global public health issue. However, the burden of CKD by etiology and trends over time remains inadequately studied.
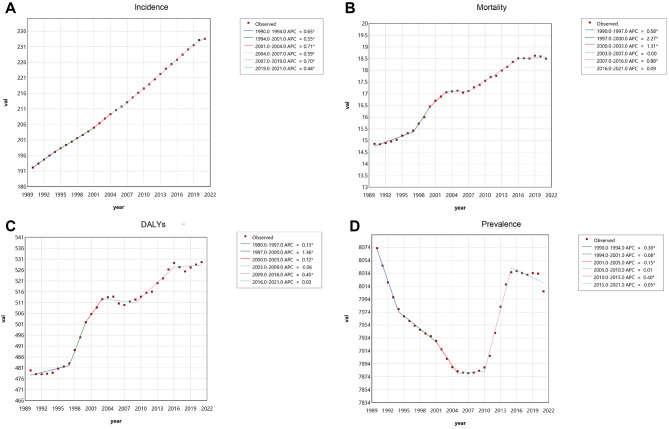
Methods: Data from the Global Burden of Disease Study 2021 (GBD 2021) were analyzed, including cases by region, etiology, age, and sex. Metrics included age-standardized incidence rate (ASIR), age-standardized mortality rate (ASMR), age-standardized prevalence rate (ASPR), disability-adjusted life years (DALYs), and age-standardized DALYs rate (ASDR) between 1990 and 2021. The Joinpoint regression analysis was used to calculate the average annual percentage change (AAPC), and age-period-cohort (APC) analysis was performed to assess trends.
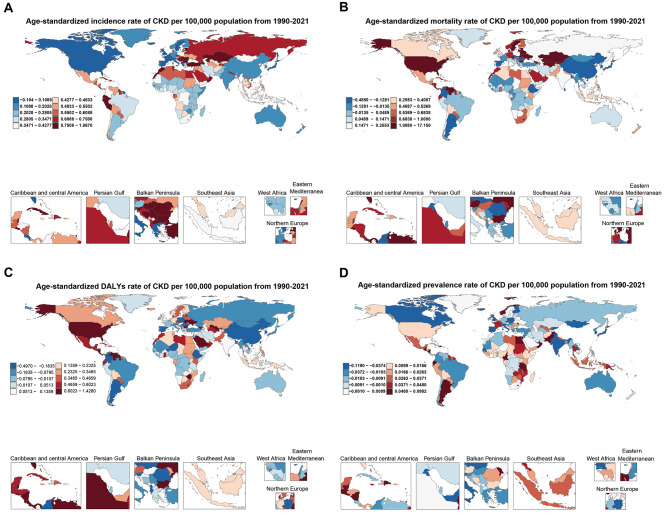
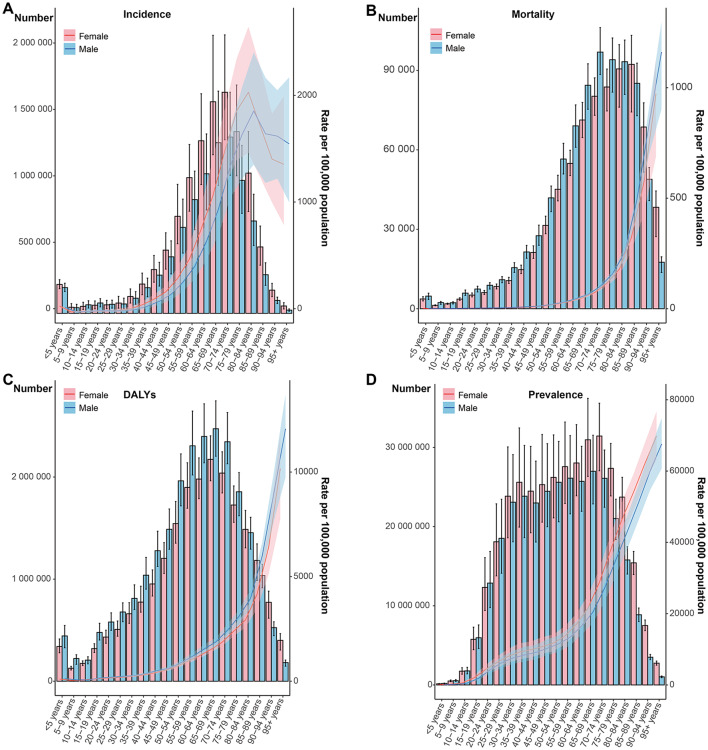
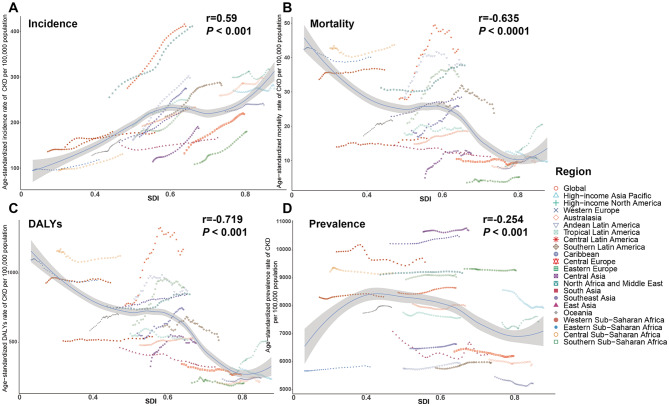
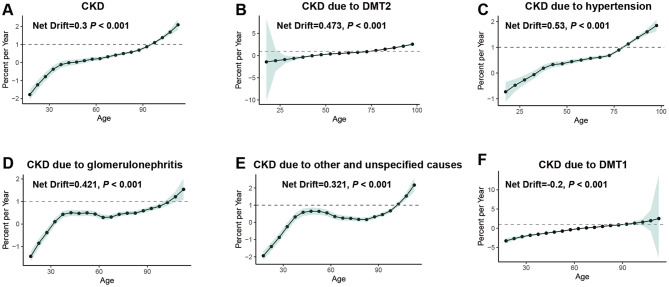
Results: In 2021, CKD posed a substantial global burden, with 673,722,703 cases and 19,935,038 new cases. The incidence rate was 233.6 with an AAPC of 0.634. CKD caused 1,527,639 deaths, corresponding to a mortality rate of 18.5 and an AAPC of 0.745. DALYs associated with CKD totaled 44,453,684, with an AAPC of 0.322. CKD burden was primarily attributed to diabetes mellitus type 2 (DMT2), hypertension, and unspecified causes, affecting individuals aged 50 years and older. ASIR and ASPR were higher among females, while males had higher ASMR and ASDR. At regional and national levels, the incidence of CKD was positively correlated with the socio-demographic index (SDI), while mortality, DALYs, and prevalence negatively correlated with SDI. APC analysis revealed an elevated mortality risk (Net Drift = 0.3), increasing with age and over successive periods. Birth cohort analysis indicated higher mortality risks among individuals born after 1992.
Conclusion: The global burden of CKD continued to rise due to aging populations, increasing risk factors, and improved detection. While some regions showed success in reducing CKD mortality, widening disparities demanded urgent attention. Early-stage disease and modifiable risks offered prevention opportunities, but realizing this required sustained healthcare investment, especially in resource-limited settings. Therefore, coordinated efforts addressing both risk factors and disease management would be essential to reduce its growing burden.
Keywords: Age-period-cohort analysis; Average annual percentage change; Chronic kidney disease; Global disease burden; Joinpoint regression analysis.
© 2025. The Author(s).
Conflict of interest statement
Declarations. Ethics approval and consent to participate: Not applicable. Consent for publication: Not applicable. Competing interests: The authors declare no competing interests.
Figures

Similar articles
-
Global burden of chronic kidney disease due to hypertension (1990-2021): a systematic analysis of epidemiological trends, risk factors, and projections to 2036 from the GBD 2021 study.BMC Nephrol. 2025 Aug 9;26(1):448. doi: 10.1186/s12882-025-04386-8. BMC Nephrol. 2025. PMID: 40783694 Free PMC article.
-
Burden of knee osteoarthritis in China and globally: 1990-2045.BMC Musculoskelet Disord. 2025 Jul 1;26(1):582. doi: 10.1186/s12891-025-08858-8. BMC Musculoskelet Disord. 2025. PMID: 40598022 Free PMC article.
-
Hepatoblastoma regional trends: dynamic SDI & joinpoint regression analysis.BMC Cancer. 2025 Jul 5;25(1):1148. doi: 10.1186/s12885-025-14566-2. BMC Cancer. 2025. PMID: 40618033 Free PMC article.
-
National and subnational burden of brain and central nervous system cancers in China and global from 1990 to 2021: results from the global burden of disease study 2021.Arch Public Health. 2025 Jul 28;83(1):195. doi: 10.1186/s13690-025-01683-4. Arch Public Health. 2025. PMID: 40722045 Free PMC article.
-
Temporal trends in the incidence of intracerebral hemorrhage from 1992 to 2021: An age-period-cohort analysis based on the global burden of disease study 2021.Ageing Res Rev. 2025 Aug;110:102789. doi: 10.1016/j.arr.2025.102789. Epub 2025 Jun 2. Ageing Res Rev. 2025. PMID: 40466777 Review.
References
-
- GBD Chronic Kidney Disease Collaboration. Global, regional, and national burden of chronic kidney disease, 1990–2017: a systematic analysis for the Global Burden of Disease Study 2017. Lancet [Internet]. 2020 Feb 29 [cited 2024 Dec 6];395(10225):709–33. Available from: http://www.ncbi.nlm.nih.gov/pubmed/32061315 - PMC - PubMed
-
- Ying M, Shao X, Qin H, Yin P, Lin Y, Wu J et al. Disease Burden and Epidemiological Trends of Chronic Kidney Disease at the Global, Regional, National Levels from 1990 to 2019. Nephron [Internet]. 2024 [cited 2025 Apr 20];148(2):113–23. Available from: http://www.ncbi.nlm.nih.gov/pubmed/37717572 - PMC - PubMed
-
- Romagnani P, Remuzzi G, Glassock R, Levin A, Jager KJ, Tonelli M et al. Chronic kidney disease. Nat Rev Dis Primers [Internet]. 2017 Nov 23 [cited 2024 Dec6];3:17088. Available from: http://www.ncbi.nlm.nih.gov/pubmed/29168475 - PubMed
-
- GBD 2021 Causes of Death Collaborators. Global burden of 288 causes of death and life expectancy decomposition in 204 countries and territories and 811 subnational locations, 1990–2021: a systematic analysis for the Global Burden of Disease Study 2021. Lancet [Internet]. 2024 May 18 [cited 2024 Dec 6];403(10440):2100–32. Available from: http://www.ncbi.nlm.nih.gov/pubmed/38582094 - PMC - PubMed
-
- Yang CW, Harris DCH, Luyckx VA, Nangaku M, Hou FF, Garcia Garcia G et al. Global case studies for chronic kidney disease/end-stage kidney disease care. Kidney Int Suppl (2011) [Internet]. 2020 Mar [cited 2024 Dec 6];10(1):e24–48. Available from: http://www.ncbi.nlm.nih.gov/pubmed/32149007 - PMC - PubMed
MeSH terms
Grants and funding
LinkOut - more resources
Full Text Sources
Medical
