. 2025 Jul 14;23(1):507.
doi: 10.1186/s12951-025-03484-x.

Hyaluronic acid-tailored prodrug nanoplatforms for efficiently overcoming colorectal cancer chemoresistance and recurrence by synergistic inhibition of cancer cell stemness

Affiliations

Hyaluronic acid-tailored prodrug nanoplatforms for efficiently overcoming colorectal cancer chemoresistance and recurrence by synergistic inhibition of cancer cell stemness

Xirui Duan et al. J Nanobiotechnology. .

Abstract

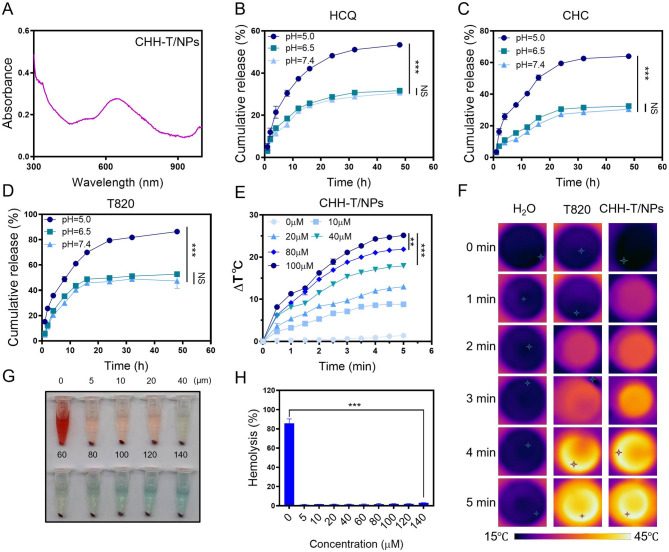
A subset of residual colorectal cancer (CRC) cells with stemness features exhibits a transient adaptive resistance after chemotherapy, limiting durable therapeutic benefits and even accelerating tumor recurrence. To tackle this problem, we have developed a targeted polymer prodrug nanoplatform (CHH-T/NPs) capable of synergistically inhibiting cancer cell stemness by modulating intracellular metabolism and inhibiting protective autophagy. Hyaluronic acid (HA) acts as a tumor-targeting molecular backbone, α-cyanohydroxycinnamic acid (CHC) is an inhibitor of monocarboxylic acid transporter 1 (MCT1), and hydroxychloroquine sulfate (HCQ) is an inhibitor of autophagy. These compounds were loaded on the HA backbone to form a polymeric prodrug, CHH, with pH-responsive ester bonds. CHH was self-assembled with mitochondria-targeting IR820 (T820), resulting in the formation of CHH-T/NPs. CHC and T820 disrupted cellular metabolism by inducing mitochondrial dysfunction and inhibiting lactate transport, leading to a synergistic inhibition of cancer cell stemness. Simultaneously, HCQ effectively inhibited autophagy to disrupt the self-protection mechanism of CRC cells. As anticipated, CHH-T/NPs effectively suppressed the chemoresistance and postoperative recurrence of CRC in subcutaneous and in situ tumors models. Taken together, this approach presents a promising strategy for overcoming CRC chemoresistance and recurrence through the synergistic inhibition of cancer cell stemness.

Keywords: Chemoresistance; Colorectal cancer; Recurrence; Site-specific polymer prodrug; Stem maintenance.


Conflict of interest statement

Declarations. Ethics approval and consent to participate: Animal protocols were approved by the Administration Committee of Experimental Animals in Sichuan Province and the Ethics Committee of Sichuan Provincial People’s Hospital (SYXK, Sichuan, 2018-058). Consent for publication: All authors of this study agreed to publish. Competing interests: The authors declare no competing interests.

Figures

Fig. 1
Fig. 1
Illustration of the potential mechanism by which CHH-T/NPs inhibit cancer recurrence. (a) Synthesis process of CHH. (b) Synthesis of T820. (c) Self-assembly of CHH and T820 to form CHH-T/NPs
Fig. 2
Fig. 2
Synthesis and characteristics of CHH-T/NPs. (A, B) Proton nuclear magnetic resonance spectrum (¹H NMR) of T820 and CHH. (C) TEM imaging of CHH-T/NPs. Scale = 200 nm. (D) Particle size distribution of CHH-T/NPs. (E) Zeta potential of T820, CHH-T/NPs and CHH-T/NPs HAase (n = 3). (F) Size distribution and zeta potential of CHH-T/NPs after seven days of storage (n = 3). Data are means ± SD of three separate runs. *P < 0.05; **P < 0.01; ***P < 0.001; NS, non-significant
Fig. 3
Fig. 3
Synthesis and characteristics of CHH-T/NPs. (A) UV–vis spectrum of CHH-T/NPs. (B-D) Release of HCQ (B), CHC (C), and T820 (D) at pH 5.0, 6.5 and 7.4 (n = 3). (E) Concentration-dependent temperature increase of CHH-T/NPs and ddH2O with exposure to 660 nm NIR (1.0 W/cm2) for 5 min (n = 3). (F) IR imaging of temperature changes of 40 µM T820 and 40 µM CHH-T/NPs after exposure to 660 nm NIR (1.0 W/cm2) for various times. Color bar: 15–45 °C. (G-H) Hemolysis rate of different concentrations of CHH-T/NPs (n = 3). Data are means ± SD of three separate runs. *P < 0.05; **P < 0.01; ***P < 0.001; NS, non-significant
Fig. 4
Fig. 4
Effect of CHH-T/NPs on CRC cell lines. (A) CD44 expression in NCM-460, LOVO, RKO and CT26 cells. (B) Fluorescence images of uptake of CHH-T/NPs by LOVO cells in 4 h; scale bar = 100 μm. (C-E) Survival of CT26, LOVO and RKO cells incubated 4 h with HCQ, CHC, T820, P-mixture, or CHH-T/NPs followed by NIR (1 W/cm2) irradiation for 90 s (n = 3). (F) Survival of LOVO cells incubated 4 h with oxaliplatin or CHH-T/NPs followed by NIR (1 W/cm2) for 90 s (n = 3). (G) LOVO cells stained with calcein AM after treatment; scale = 100 μm. (H, I) EdU cell division analysis of LOVO and RKO cells incubated with saline, HCQ, CHC, T820, P-mixture, or CHH-T/NPs for 4 h, then 1 W/cm2 NIR for 90 s (n = 3). (J, K) Colony counts and statistical analyses of LOVO (n = 3). (L) Cytometric quantitation of apoptotic index of LOVO cells after different treatments. Data are means ± SD of three separate runs. *P < 0.05; **P < 0.01; ***P < 0.001; NS, non-significant
Fig. 5
Fig. 5
Mechanism of CHH-T/NP-induced stemness reduction in CRC cells. (A) Western immunoblot assay of MCT1 in LOVO cells with CHH-T/NPs treatment. (B) Lactic acid concentration in LOVO cells after treatment (n = 3). (C) Confocal microscopy showing mitochondrial colocalization in LOVO cells (scale = 20 μm). (D) Flow cytometric data and measurement of mitochondrial membrane potential (JC-1) in treated LOVO cells. (E) ATP concentration in treated LOVO cells (n = 3). (F) DQ-BSA fluorescent probe was used to detect autophagy in LOVO cells (scale = 50 μm). (G) Western immunoblot assay of autophagy-related proteins, LC-3 and p62, in LOVO cells. (H) Western immunoblot assay of stemness-related proteins, Nanog, ZEB1, and Oct4 in treated LOVO cells. (I, J) LOVO cells were incubated under different treatment conditions for seven days as spheroids in six-well ultra-low attachment plates (scale = 100 μm, n = 3)). Data are means ± SD of three separate runs. *P < 0.05; **P < 0.01; ***P < 0.001; NS, non-significant
Fig. 6
Fig. 6
In vivo distribution and anticancer properties of CHH-T/NPs. (A) Subcutaneous drug-resistant tumor model in mice. (B) Images of LOVO tumor-bearing mice after i.v. injection of T820 or CHH-T/NPs. Colors: 0–109 [(ps− 1 cm− 2 sr− 1)/(µW cm− 2)]. Scale = 2.5 cm. (C) Characterization of radiation intensity of principle organs and tumor sections. Colors: 0–109 [(ps− 1 cm− 2 sr− 1)/(µW cm− 2)]. Scale = 0.5 cm. (D) IR thermograms of tumors exposed to NIR light (1 W/cm2) for 1, 2, 3, 4, or 5 min. Colors: 15–45 °C. Scale = 2.5 cm. (E) Temperatures of tumors after intravenous injection and irradiation (n = 3). (F) Recorded mouse weights over 15 days (n = 5). (G) Tumor volumes after treatment with normal saline, HCQ, CHC, T820, P-mixture, or CHH-T/NPs (n = 5), and NIR exposure (1 W/cm2) for five minutes. (H) Tumor weights and reductions after NIR exposure (1 W/cm2) for five minutes (n = 5). (I) Tumor images (n = 5). (J) IHC of LC-3 and p62 in tumor sections from mice administered with normal saline, HCQ, CHC, T820, P-mixture, or CHH-T/NPs and exposure to NIR irradiation (1 W/cm2) for five min (n = 5). Scale = 100 μm. Data are means ± SD from five separate runs. *P < 0.05; **P < 0.01; ***P < 0.001; NS, nonsignificant
Fig. 7
Fig. 7
Anticancer activity of CHH-T/NPs in orthotopic CRC. (A) Animal model of orthotopic CRC. (B) Image analysis of CT26 tumors in mice at various times after i.v. injection of T820 or CHH-T/NPs. Colors: 0–109 [(ps− 1 cm− 2 sr− 1)/ (µW/cm2)]. Scale = 2.5 cm. (C) Characterization of radiation intensity in principle organs and colorectum sections from each group. Colors: 0–109 [(ps− 1 cm− 2 sr− 1)/(µW/cm2)]. Scale = 0.5 cm. (D, E) Fluorescence images and statistical analysis at 15 d after therapy (n = 5). Color: 0-8000. Scale = 2.5 cm. (F) Western immunoblot assay of MCT1 in tumor sections after treatment. (G) Western immunoblots of LC-3 and p62 in tumor sections after treatments. (H) Lactic acid concentration in tumor sections (n = 5). (I) ATP concentration in tumor sections (n = 5). (J) Images and H&E staining of orthotopic tumors. Scale bar = 0.8 cm. Scale bar = 100 μm. (K) IHC of Ki67 and IF of TUNEL in tumor sections from mice administered with normal saline, HCQ, CHC, T820, P-mixture, or CHH-T/NPs and exposed to NIR irradiation (1 W/cm2) for five minutes. Scale = 100 μm. Data are means ± SD of five separate runs. *P < 0.05; **P < 0.01; ***P < 0.001; NS, non-significant
Fig. 8
Fig. 8
CHH-T/NPs inhibit CRC tumor recurrence in vivo. (A) Animal model of tumor recurrence. (B) Live imaging of CT26 tumors in mice at various times after i.v. injection of T820 or CHH-T/NPs. Colors: 0–109 [(ps− 1 cm− 2 sr− 1)/(µW/cm2)]. Scale = 2.5 cm. (C) Fluorescence levels in principle organs and tumor tissues. Colors: 0–109 [(ps− 1 cm− 2 sr− 1)/(µW/cm2)]. Scale = 0.5 cm. (D) Live fluorescence images at 15 days after resection (n = 5) Color: 0-8000. Scale = 2.5 cm. (E) Tumors from the various animal groups (n = 5). (F) Weights of tumors and inhibition rates after NIR exposure (1 W/cm2) for five minutes (n = 5). (G) Tumor volumes after injection of normal saline, HCQ, CHC, T820, P-mixture, or CHH-T/NPs (n = 5), and NIR (1 W/cm2) for five minutes. (H) Western immunoblot assay for Nanog, Oct4, and ZEB1 in tumor tissue. (I) Immunohistochemistry of Nanog and ZEB1 in tumor sections from mice injected with normal saline, HCQ, CHC, T820, P-mixture, or CHH-T/NPs plus NIR radiation (1 W/cm2) for five minutes. Scale = 100 μm. Data are means ± SD from five separate experiments. *P < 0.05; **P < 0.01; ***P < 0.001; NS, non-significant

Similar articles

References

    1. van der Stok EP, Spaander MCW, Grünhagen DJ, Verhoef C, Kuipers EJ. Surveillance after curative treatment for colorectal cancer, nature reviews. Clin Oncol. 2017;14(5):297–315. - PubMed
    1. Siegel RL, Wagle NS, Cercek A, Smith RA, Jemal A. Colorectal cancer Stat 2023 CA: cancer J Clin. 2023;73(3):233–54. - PubMed
    1. Dekker E, Tanis PJ, Vleugels JLA, Kasi PM, Wallace MB. Colorectal cancer. Lancet (London England). 2019;394(10207):1467–80. - PubMed
    1. Ravindran Menon D, Luo Y, Arcaroli JJ, Liu S, KrishnanKutty LN, Osborne DG, Li Y, Samson JM, Bagby S, Tan AC, Robinson WA, Messersmith WA, Fujita M. CDK1 interacts with Sox2 and promotes tumor initiation in human melanoma. Cancer Res. 2018;78(23):6561–74. - PMC - PubMed
    1. Leung CON, Yang Y, Leung RWH, So KKH, Guo HJ, Lei MML, Muliawan GK, Gao Y, Yu QQ, Yun JP, Ma S, Zhao Q, Lee TKW. Broad-spectrum Kinome profiling identifies CDK6 upregulation as a driver of lenvatinib resistance in hepatocellular carcinoma. Nat Commun. 2023;14(1):6699. - PMC - PubMed

MeSH terms