. 2025 Jul 14;23(1):510.
doi: 10.1186/s12951-025-03579-5.

Targeted Inhibition of cGAS/STING signaling induced by aberrant R-Loops in the nucleus pulposus to alleviate cellular senescence and intervertebral disc degeneration

Affiliations

Targeted Inhibition of cGAS/STING signaling induced by aberrant R-Loops in the nucleus pulposus to alleviate cellular senescence and intervertebral disc degeneration

Dan Wu et al. J Nanobiotechnology. .

Abstract

Intervertebral disc degeneration (IVDD) is a significant contributor to chronic low back pain and disability worldwide, yet effective treatment options remain limited. Through integrative analysis of single-cell RNA-seq data from intervertebral discs (IVDs), we have firstly uncovered that the aberrant accumulation of R-Loops-a type of triple-stranded nucleic acid structure-can result in the cytoplasmic accumulation of double-stranded DNA (dsDNA) and activate cGAS/STING signaling and induce cellular senescence in nucleus pulposus cells (NPCs) during IVDD. Restoring the R-Loop state significantly mitigated both the activation of the cGAS/STING pathway and NPC senescence. Additionally, we identified ERCC5 as a critical regulator of the R-Loop state and cellular senescence. Thus, we developed an NPC-targeting nano-delivery platform (CTP-PEG-PAMAM) to deliver si-Ercc5 to the NP region of the IVDD. This approach aims to modulate the abnormal R-Loop state and inhibit the activation of cGAS/STING signaling in NPCs for IVDD treatment. CTP-PEG-PAMAM demonstrated excellent targeting capability towards NPCs and NP tissue, and achieved effective silencing of the Ercc5 gene without causing systemic organ complications. Both in vitro and in vivo experiments revealed that CTP-PEG-PAMAM-siERCC5 significantly inhibited cGAS/STING signaling activated by aberrant R-Loops, alleviated cellular senescence and promoting cell proliferation, thereby delayed IVDD in a puncture-induced rat model. In conclusion, the ERCC5-R-Loop-cGAS/STING axis in NPCs represents a promising therapeutic target for delaying IVDD, and the designed CTP-PEG-PAMAM/siRNA complex holds great potential for clinical application in the treatment of IVDD.

Keywords: Cellular senescence; ERCC5; Intervertebral disc degeneration; Nucleus pulposus-specific nano-delivery platform; R-Loops; cGAS/STING.


Conflict of interest statement

Declarations. Ethics approval and consent to participate: All animal experiments were conducted in accordance with the guidelines set forth by the National Institutes of Health for the Care and Use of Laboratory Animals, and received approval from the Animal Research Committee at our institution. Competing interests: The authors declare no competing interests.

Figures
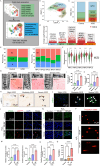
Fig. 1
Fig. 1
NPC senescence is accompanied by DNA damage and the activation of the cGAS-STING axis during IVDD. A: Overview of the overall workflow of the integrated single-cell analysis. B: UMAP visualizing human NPCs as five different subclusters after unsupervised clustering. Each point indicates a single cell, colored according to different cell subclusters. C: Relative proportion of each NPC cluster between the control group and IVDD group. D: Differentially expressed genes in each NPC cluster. E: Cell cycle analysis of all NPC subclusters or that between the control group and IVDD group. F: Senescence score based on single-cell sequencing of each NPC cluster between the control group and IVDD group. G: Representative T2-weighted MRI images and SOFG staining of NP tissues with varying degrees of degeneration. Scale bar = 20 μm. H and I: Representative images and quantitative results of immunohistochemistry for p16INK4a in NP tissues with different degrees of degeneration (n = 3). Scale bar = 20 μm. J and K: Representative images and quantitative results of IF staining for γH2AX in NP tissues with varying degrees of degeneration (n = 3). Scale bar = 20 μm. L and M: Representative images and quantitative results of IF staining for γH2AX and p16INK4a in primary rat NPCs treated with or without H2O2 for 24 h (n = 3). Scale bar = 20 μm. N and O: Representative images and quantitative results of IF staining for S-β-Gal in primary rat NPCs treated with or without H2O2 for 24 h (n = 3). P: Neutral comet assay in primary rat NPCs treated with or without H2O2 for 24 h. Q: Quantification of the percentage of DNA in the tail (Tail DNA) (n = 3). Significance was calculated by (I, K, M, O, and Q) one-way ANOVA. *p < 0.05, **p < 0.01, ***p < 0.001, ****p < 0.0001. NPC: Nucleus pulposus; UMAP: Uniform manifold approximation and projection; cGAS: cyclic GMP-AMP synthase; STING: Stimulator of interferon genes; IVD: Intervertebral disc; SOFG: Safranin O and Fast Green Staining
Fig. 2
Fig. 2
Increased R-Loop score in NPCs correlates with NPC senescence and IVDD. A: Illustration of establishing the R-Loop score model based on scRNA sequencing; B: Weighted gene co-expression network analysis (WGCNA) of 1,185 R-Loop regulators. Deeper colors indicate stronger interactions. C: Correlation analysis of the four modules generated from WGCNA analysis in relation to IVDD. D: Differences in the turquoise module R-Loop score for each NPC cluster between the control group and IVDD group. E: Cell cycle analysis of NPCs based on the R-Loop score for the turquoise module. F: Differences in the yellow-blue R-Loop score for each NPC cluster between the control group and IVDD group. G: Cell cycle analysis of NPCs based on the R-Loop score for the yellow-blue module. H: Differences in the expression of cyclin genes between these two groups for the turquoise module. I: Differences in the expression of cyclin genes between these two groups for the yellow-blue module. J: UMAP visualization of rat IVD cells as seven NPC subclusters. Each plot represents one single cell, colored based on different cell subclusters. K: Relative proportion of each NPC cluster between the control and stab groups (IVDD). L: Differences in the yellow-blue module R-Loop score for each NPC cluster between the control group and stab group. M: Cell cycle analysis of NPCs based on the R-Loop score for the yellow-blue module. N: Differences in the turquoise R-Loop score for each NPC cluster between the control group and stab group. O: Cell cycle of NPCs based on the R-Loop score for turquoise module. NPC: Nucleus pulposus; IVDD: Intervertebral disc degeneration
Fig. 3
Fig. 3
Decreasing R-Loop levels alleviates DNA damage-induced activation of cGAS/STING signaling and NPC senescence. A and B: Representative images and quantitative results of immunofluorescence (IF) staining for RNase H1 in rat NPCs from the control and overexpression groups (n = 3). Scale bar = 20 μm. B: Quantitative results of IF staining for RNase H1 in rat NPCs. C: Representative images of IF staining for S9.6 (marked by circle) and nucleolin in H2O2-treated primary rat NPCs with or without overexpression of RNase H1. Scale bar = 20 μm. D: Quantitative results of IF staining for S9.6 (n = 10). E: Neutral comet assay in H2O2-treated primary rat NPCs with or without overexpression of RNase H1. Scale bar = 20 μm. F: Quantification of the percentage of DNA in the tail (Tail DNA) (n = 3). G: Representative images of S-β-Gal staining in H2O2-treated primary rat NPCs with or without overexpression of RNase H1. Scale bar = 100 μm. H: Quantitative results of S-β-Gal staining (n = 3). I and J: Representative images and quantification of IF staining for STING (green) in H2O2-treated primary rat NPCs with or without overexpression of RNase H1 (n = 3). Scale bar = 20 μm. K: Representative images of IF staining for dsDNA (red) and mitochondria (Tomm20, green) in H2O2-treated primary rat NPCs with or without overexpression of RNase H1. Scale bar = 10 μm. L: Relative quantification cytosolic dsDNA area normalized to total dsDNA area in IF images analyzed by Image J (n = 5). M and N: Representative images and quantitation results of the Western blot for the expression of cGAS/STING pathway-related proteins in rat primary NPCs from different groups (n = 3). O: The results of RT-qPCR for the expression of proinflammatory genes in rat primary NPCs from different groups (n = 3). Significance was calculated by (B, J, and L) Student’s t-test and (D, F, H, and N) one-way ANOVA. **p < 0.05, **p < 0.01, ***p < 0.001, ****p < 0.0001. cGAS: cyclic GMP-AMP synthase; STING: Stimulator of interferon genes; NPC: Nucleus pulposus; ACAN: Aggrecan; MMP3: Matrix metalloproteinase-3
Fig. 4
Fig. 4
Bulk RNA sequencing identified the critical regulators of R-Loop during IVDD A: Illustration of the critical regulator for R-Loops based on bulk RNA sequencing (GSE245147). B: Overlapping R-Loop-related genes between human IVD tissue and NPCs. C: Gene Ontology (GO) and Kyoto Encyclopedia of Genes and Genomes (KEGG) analysis of differentially expressed overlapping R-Loop-related genes. D: Protein-protein interaction network of differentially expressed overlapping R-Loop-related genes constructed using the STRING database (https://cn.string-db.org). E: Bar graphs showing fold changes of the expression of ERCC5 and ERCC6 in human IVD tissue and NPCs, respectively (GSE245147). F: Histological analysis (SOFG staining and immunohistochemistry (IHC) staining for ERCC5 and ERCC6) of human NP tissue with varying degeneration grades. Scale bar = 20 μm. G: Quantitative results of IHC staining for ERCC5 and ERCC6 (n = 5). H: Representative images of IF staining for ERCC5 in H2O2-treated primary rat NPCs. Scale bar = 20 μm. I: Quantitative results of IF staining for ERCC5 (n = 3). J: Representative images of IF staining for ERCC6 in H2O2-treated primary rat NPCs. Scale bar = 20 μm. K: Quantitative results of IF staining for ERCC6 (n = 3). Significance was calculated by (G, I, and K) Student’s t-test. *p < 0.05, **p < 0.01, ***p < 0.001, ****p < 0.0001. SOFG: Safranin O and Fast Green Staining. NPC: Nucleus pulposus cell. MF: Molecular function. BP: Biological processes. CC: Cellular components. KEGG: Kyoto Encyclopedia of Genes and Genomes
Fig. 5
Fig. 5
ERCC5 played a vital role in modulating R-Loop state and cellular senescence in NPCs. A: Illustration of the experiments to investigate the role of ERCC5 or ERCC6 on R-Loop and cellular senescence in rat NPCs. B: The results of RT-qPCR for the mRNA expression of MMP3, CDKN1A, and CDKN2A in H2O2-treated primary rat NPCs with or without silencing ERCC5 or ERCC6 (n = 3). C: The SASP level in rat NPCs via ELISA assay (n = 3). D: Representative images of IF staining for S9.6 and nucleolin in H2O2-treated primary rat NPCs with or without silencing ERCC5 or ERCC6. Scale bar = 20 μm. G: Quantitative results of IF staining for RNA/DNA hybrid foci (n = 3). E and H: Representative images and quantification of IF staining for S-β-gal in H2O2-treated primary rat NPCs with or without silencing ERCC5 or ERCC6 (n = 3). Scale bar = 20 μm. F and I: Representative images and quantification of IF staining for MMP3 and ACAN in H2O2-treated primary rat NPCs with or without silencing ERCC5 or ERCC6 (n = 3). Scale bar = 20 μm. J: Representative images of IF staining for dsDNA (red) and mitochondria (Tomm20, green) in H2O2-treated primary rat NPCs with or without silencing ERCC5 or ERCC6. Scale bar = 10 μm. K and L: Representative images and quantitative results of IF staining for ACAN and MMP3 in H2O2-treated primary rat NPCs with or without silencing ERCC5 or ERCC6 (n = 3). Significance was calculated by (B, C, G, H, I, and L) one-way ANOVA. *p < 0.05, **p < 0.01, ***p < 0.001, ****p < 0.0001. STING: Stimulator of interferon genes; NPC: Nucleus pulposus; ACAN: Aggrecan; MMP3: Matrix metalloproteinase-3
Fig. 6
Fig. 6
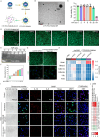
The design and bioeffects of CTP-PEG-PAMAM nano-delivery system in vitro A: The illustration of the design of CTP-PEG-PAMAM nano-delivery system. B: TEM image of CTP-PEG-PAMAM nano-particles (Scale bar = 100 and 500 nm). C: Viability of rat NPCs after treatment with CTP-PEG-PAMAM-siErcc5 complexes having different N/P ratios for 24 h, as tested by CCK-8 assay (n = 4). D: Live/dead assay of rat NPCs after treatment with CTP-PEG-PAMAM complexes having different N/P ratios for 24 h. Scale bar = 100 μm. E: Agarose gel electrophoresis assay of CTP-PEG-PAMAM-siErcc5 complexes with different N/P ratios. F: Zeta potential analysis of complexes with different N/P ratios (n = 3). G: Live/dead assay and fluorescence imaging of rat NPCs after treatment with CTP-PEG-PAMAM complexes (20 µg /mL, N/P = 16:1) and Lip3000 for 24 h. Scale bar = 100/20 µm. H: RT–qPCR analysis and heatmap of genes in the pathways related to ECM degradation and senescence (n = 3). I: Representative images of senescence-, SASP-, and proliferation-related biomarkers (SA-β-gal, γ-H2AX, IL-1β, IL-6, MMP3, and Ki67) in H2O2-treated rat NPCs incubated with CTP-PEG-PAMAM or CTP-PEG-PAMAM-siErcc5 for 24 h. Scale bar = 100–20 μm). J: Quantitative results of SA-β-gal staining and IF staining for γ-H2AX, IL-1β, IL-6, MMP3, and Ki67, respectively (n = 3). Significance was calculated by (C) Student’s t-test. *p < 0.05, **p < 0.01, ***p < 0.001, ****p < 0.0001
Fig. 7
Fig. 7
Therapeutic efficacy of CTP-PEG-PAMAM-si-Ercc5 in puncture-induced rat IVDD model and sustained STING silencing in vivo A: Representative fluorescence image after Cy5. 5-labeled free PEG-PAMAM or CTP-PEG-PAMAM solution were injected into rat disc using IVIS over time. B: Quantitative analysis of representative fluorescence image after Cy5.5-labeled free PEG-PAMAM or CTP-PEG-PAMAM solution within disc via IVIS (n = 5). C: Illustration of the experimental design for the treatment of silencing Ercc5 via PEG-PAMAM-siErcc5 or CTP-PEG-PAMAM-siErcc5 on IVDD in vivo. D: Representative images of T2-weighed MRI for rats from Sham group, IVDD + PBS group, IVDD + PEG-PAMAM group, IVDD + PEG-PAMAM-siErcc5 group, and IVDD + CTP-PEG-PAMAM-siErcc5 group, respectively. E: Pfirrmann score of IVD for rats from Sham group, IVDD + PBS group, IVDD + PEG-PAMAM group, IVDD + PEG-PAMAM-siErcc5 group, and IVDD + CTP-PEG-PAMAM-siErcc5 group, respectively (n = 5). F: Representative images of Hematoxylin-eosin (H&E) and Safranin O/fast Green (SOFG) staining of IVD tissues from different groups at 6-weeks post-operation. G: Histological grading of IVD from different treatment groups at 6-weeks post-operation. H: Representative images of IHC staining for ACAN, MMP3, and P16IKN4a, and STING for IVD tissues from different groups at 6-weeks post-operation. I: Quantitative results of IHC staining for ACAN, MMP3, and P16IKN4a, and STING (n = 5). Significance was calculated by (B) Student’s t-test and (E and I) one-way ANOVA. *p < 0.05, **p < 0.01, ***p < 0.001, ****p < 0.0001. SOFG: Safranin O and Fast Green Staining. cGAS: cyclic GMP-AMP synthase; STING: Stimulator of interferon genes; NPC: Nucleus pulposus; ACAN: Aggrecan; MMP3: Matrix metalloproteinase-3; IVD: Intervertebral disc
Fig. 8
Fig. 8
Transcriptional profiles and function analysis of CTP-PEG-PAMAM-si-Ercc5-treated IVD in vivo A: Heat map of the R-Loop-related genes in rats IVD samples from IVDD groups and IVDD + CTP-PEG-PAMAM-siErcc5 group (n = 4). B: Heat map of the senescence- and proliferation-related genes in rats IVD samples from IVDD groups and IVDD + CTP-PEG-PAMAM-siErcc5 group (n = 4). C: KEGG analysis of DEGs of rats IVD samples from IVDD groups and IVDD + CTP-PEG-PAMAM-siErcc5 group. D: GO (biological process, cellular component, and molecular function) analysis of rats IVD samples from IVDD groups and IVDD + CTP-PEG-PAMAM-siErcc5 group. E: GSEA analysis of DEGs of rats IVD samples from IVDD groups and IVDD + CTP-PEG-PAMAM-siErcc5 group. F: Illustration of the groups for western blot. G: Representative images of western blot for cGAS and STING in rats IVD samples from different groups. Significance was calculated by (H) one-way ANOVA. H: Quantification of the western blot for cGAS and STING (n = 3). *p < 0.05, **p < 0.01, ***p < 0.001, ****p < 0.0001. IVD: Intervertebral disc; cGAS: cyclic GMP-AMP synthase; STING: Stimulator of interferon genes; GSEA: Gene set enrichment analysis
Fig. 9
Fig. 9
Schematic illustration of the fabrication of NPC-targeting gene silencing nano-delivery platform to modulate R-Loops state via ERCC5 to alleviate NPCs senescence and IVDD. A: Fabrication of NPC-targeting gene silencing nano-delivery platform, CTP-PEG-PANAM-siErcc5 and the administration of NPC-targeting gene silencing nano-delivery platform into IVD tissue. B: CTP-PEG-PANAM-siErcc5 rescued NPCs senescence and alleviated IVDD via reprogramming R-Loops state and cGAS/STING signaling pathway

Similar articles

References

    1. Knezevic NN, Candido KD, Vlaeyen J, Van Zundert J, Cohen SP. Low back pain. Lancet. 2021;398(10294):78–92. - PubMed
    1. Jiang W, et al. Intervertebral disc human nucleus pulposus cells associated with back pain trigger neurite outgrowth in vitro and pain behaviors in rats. Sci Transl Med. 2023;15(725):eadg7020. - PMC - PubMed
    1. Zehra U, Tryfonidou M, Iatridis JC, Illien-Jünger S, Mwale F, Samartzis D. Mechanisms and clinical implications of intervertebral disc calcification. Nat Rev Rheumatol. 2022;18(6):352–62. - PMC - PubMed
    1. Han L, Li F, Wu H, Wang W, Chen P, Xia W, et al. Targeting FABP4 to inhibit AGEs-RAGE/NF-κB signalling effectively ameliorates nucleus pulposus dysfunction and angiogenesis in obesity-related intervertebral disc degeneration. Cell Prolif. 2025;e70021. Epub ahead of print. 10.1111/cpr.70021. PMID: 40090836. - PubMed
    1. Sun K, et al. The role of nerve fibers and their neurotransmitters in regulating intervertebral disc degeneration. Ageing Res Rev. 2022;81:101733. - PubMed

MeSH terms

LinkOut - more resources