Effects of five cannabis oils with different CBD: THC ratios and terpenes on hypertension, dyslipidemia, hepatic steatosis, oxidative stress, and CB1 receptor in an experimental model
- PMID: 40660358
- PMCID: PMC12261622
- DOI: 10.1186/s42238-025-00286-8
Effects of five cannabis oils with different CBD: THC ratios and terpenes on hypertension, dyslipidemia, hepatic steatosis, oxidative stress, and CB1 receptor in an experimental model
Abstract
Background: Non-alcoholic fatty liver disease (NAFLD) is a common liver disorder caused by oxidative stress and dysregulation of lipid metabolism. The endocannabinoid system (ECS), particularly the type 1 cannabinoid (CB1) receptor, plays a crucial role in NAFLD progression. Cannabinoids, such as cannabidiol (CBD) and tetrahydrocannabinol (THC), along with terpenes, such as beta-myrcene and d-limonene, have shown potential therapeutic effects on liver health, particularly in reducing oxidative stress and modulating lipid metabolism. This study aimed to analyse the effects of five cannabis oils (COs), each with different CBD:THC ratios and terpenes content, on hypertension, dyslipidemia, hepatic steatosis, oxidative stress, and CB1 receptor expression in an experimental model of NAFLD induced by a sucrose-rich diet (SRD) in Wistar rats for 3 weeks.
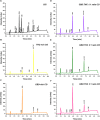
Methods: Male Wistar rats were fed either a: (1) reference diet (RD; standard commercial laboratory diet) or a: (2) sucrose-rich diet (SRD) for 3 weeks. 3 to 7 SRD + CO as following: (3) SRD + THC; (4) SRD + CBD; (5) SRD + CBD:THC 1:1; (6) SRD + CBD:THC 2:1; and (7) SRD + CBD:THC 3:1. The COs were administered orally at a dose of 1.5 mg total cannabinoids/kg body weight daily. The cannabinoid and terpenes content of all COs used in the study was determined. The terpenes found in COs were beta-myrcene, d-limonene, terpinolene, linalool, beta-caryophyllene, alpha-humulene, (-)-guaiol, (-)-alpha-bisabolol. During the experimental period, body weight, food intake and blood pressure were measured. Serum glucose, triglyceride, total cholesterol, uric acid, alanine aminotransferase (ALT), aspartate aminotransferase (AST), and alkaline phosphatase (AP) levels were evaluated. Liver tissue histology, NAFLD activity score (NAS), triglyceride and cholesterol content, lipogenic enzyme activities, enzyme related to mitochondrial fatty acid oxidation, reactive oxygen species (ROS), thiobarbituric acid reactive substance (TBARS), and antioxidant enzyme activities were also evaluated. The CB1 receptor expression was also determined.
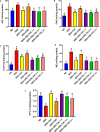
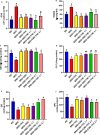
Results: The results showed that SRD-fed rats developed hypertension, dyslipidemia, liver damage, hepatic steatosis, lipid peroxidation, and oxidative stress. This was accompanied by upregulation of liver CB1 receptor expression. CBD-rich CO, CBD:THC 1:1 ratio CO; CBD:THC 2:1 ratio CO and CBD:THC 3:1 ratio CO showed antihypertensive properties. THC-rich CO, CBD:THC 1:1 ratio CO; CBD:THC 2:1 ratio CO showed the greatest beneficial effects against hepatic steatosis and liver damage. All COs exhibited antioxidant effects in liver tissue. This was associated with normal liver CB1 receptor expression.
Conclusions: This study demonstrated that COs, particularly THC-rich CO, CBD:THC ratio 1:1 CO, CBD:THC ratio 2:1 CO and terpenes, can effectively reduce dyslipidemia, liver damage and hepatic steatosis in SRD-induced NAFLD. COs with a higher proportion of CBD in their composition showed antihypertensive properties. All the COs exhibited antioxidant properties. These findings suggest that COs, especially those with CBD:THC ratios of 1:1 and 2:1 and terpenes, may represent a promising therapeutic approach for managing NAFLD and preventing its progression to more severe liver disease.
Keywords: Cannabinoid; Cannabis oil; Hepatic steatosis; Oxidative stress; Terpenes.
© 2025. The Author(s).
Conflict of interest statement
Declarations. Ethics approval and consent to participate: This study was performed in strict accordance with the NIH guidelines for the care and use of laboratory animals and approved by the Institutional Ethics Committee of the Faculty of Biochemistry and Biological Sciences (UNL, Santa Fe, Argentine - Acta CE2022-63). Not applicable for consent to participate. Consent for publication: All authors have read and approved the final manuscript and consent to its publication. Competing interests: The authors declare no competing interests.
Figures


Similar articles
-
Effects of Full-Spectrum Cannabis Oil with a Cannabidiol:Tetrahydrocannabinol 2:1 Ratio on the Mechanisms Involved in Hepatic Steatosis and Oxidative Stress in Rats Fed a Sucrose-Rich Diet.Med Cannabis Cannabinoids. 2023 Nov 15;6(1):170-183. doi: 10.1159/000534610. eCollection 2023 Jan-Dec. Med Cannabis Cannabinoids. 2023. PMID: 38023489 Free PMC article.
-
Study on the modulation of kidney and liver function of rats with diabetic nephropathy by Huidouba through metabolomics.J Ethnopharmacol. 2025 Jul 24;351:120136. doi: 10.1016/j.jep.2025.120136. Epub 2025 Jun 11. J Ethnopharmacol. 2025. PMID: 40513925
-
Vitamin E for people with non-alcoholic fatty liver disease.Cochrane Database Syst Rev. 2024 Oct 16;10(10):CD015033. doi: 10.1002/14651858.CD015033.pub2. Cochrane Database Syst Rev. 2024. PMID: 39412049 Free PMC article.
-
The Black Book of Psychotropic Dosing and Monitoring.Psychopharmacol Bull. 2024 Jul 8;54(3):8-59. Psychopharmacol Bull. 2024. PMID: 38993656 Free PMC article. Review.
-
Statins for non-alcoholic fatty liver disease and non-alcoholic steatohepatitis.Cochrane Database Syst Rev. 2013 Dec 27;2013(12):CD008623. doi: 10.1002/14651858.CD008623.pub2. Cochrane Database Syst Rev. 2013. PMID: 24374462 Free PMC article.
References
-
- Ahmad SB, Rehman MU, Fatima B, Ahmad B, Hussain I, Ahmad SP, Farooq A, Muzamil S, Razzaq R, Rashid SM, Ahmad Bhat S, Mir MUR. Antifibrotic effects of d-limonene (5(1-methyl-4-[1-methylethenyl]) cyclohexane) in CCl4 induced liver toxicity in Wistar rats. Environ Toxicol. 2018;33(3):361–9. 10.1002/tox.22523. - PubMed
-
- Alves-Silva JM, Zuzarte M, Marques C, Salgueiro L, Girao H. Protective effects of terpenes on the cardiovascular system: current advances and future perspectives. Curr Med Chem. 2016;23(40):4559–600. 10.2174/0929867323666160907123559. - PubMed
Grants and funding
LinkOut - more resources
Full Text Sources
Miscellaneous

