. 2025 Jul 14;27(1):131.
doi: 10.1186/s13058-025-02082-x.

Chemoresistant tumor cell secretome potentiates immune suppression in triple negative breast cancer

Affiliations

Chemoresistant tumor cell secretome potentiates immune suppression in triple negative breast cancer

Eleni Skourti et al. Breast Cancer Res. .

Abstract

Background: Chemotherapy is an integral part of the clinical management of triple negative breast cancer (TNBC), however, development of chemoresistance occurs frequently. Tumor sensitivity to treatment is known to be strongly influenced by the immune microenvironment, signifying the predictive potential of immune alterations. How tumor cells that acquire resistance may subsequently modulate the immune microenvironment it is still not well described. Here, we investigated immunomodulation in the context of acquired chemoresistance in TNBC, focusing on the role of the secretome.

Methods: Bulk RNA sequencing and multiplex cytokine profiling were performed on paclitaxel-resistant and -sensitive isogenic variants of TNBC cells to reveal resistance-associated secretome alterations. The immunomodulatory influence of the tumor cell secretome was investigated by exploring its effect on monocytes, macrophages (MΦs) and T cells derived from healthy blood donors. The influence on the immune cell phenotype and activity was evaluated by measuring molecular markers and performing functional assays. To validate the clinical relevance, we utilized longitudinal -omics data from breast cancer patients refractory to standard chemotherapy in the NeoAva clinical trial. CIBERSORT was applied to transcriptomics data to infer MΦ and T cell abundance in individual tumors upon treatment. To evaluate their association with the secretome profiles, patient-matched serum cytokine data were used.

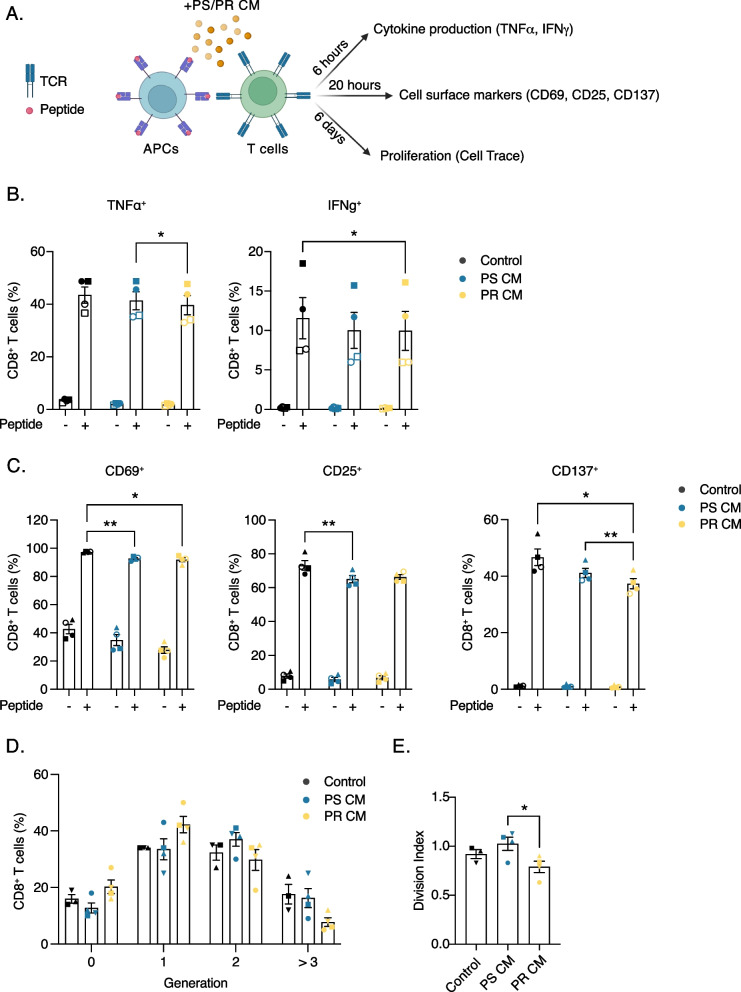
Results: The acquisition of chemoresistance was accompanied by enhanced secretion of cytokines. Subsequently, the resistant cell secretome affected the abundance, phenotype and activity of immune cells. Specifically, it potentiated the recruitment of monocytes, facilitated the polarization of MΦs towards the immunosuppressive M2-like phenotype, and attenuated the activation of CD8+ T cells. Data from the NeoAva clinical cohort validated the enrichment of M2 MΦs and/or the depletion of M1 MΦs after treatment in the majority of residual tumors. The MΦ-associated changes counteracted CD8+ T cell abundance and were partially associated with the cytokine-enriched secretome.

Conclusion: Development of chemoresistance in BC is associated with alterations in the tumor secretome, which impairs immune activation and facilitates immunosuppression. Knowledge on the immune microenvironment in residual tumors after standard chemotherapy could aid in selecting rational treatment options for this group of patients.

Keywords: Chemoresistance; Cytokines; Immune microenvironment; Immune suppression; Macrophages; Secretome; Triple negative breast cancer.


Conflict of interest statement

Declarations. Ethics approval and consent to participate: Ethical approvals were obtained from the Norwegian Regional Committee for Medical and Health Research Ethics (REK) for experiments using monocytes isolated from buffy coats of healthy anonymous donors (REK 95986) and for T cell isolation and generation of TCR-engineered T cells (REK 2019–121). Consent for publication: Not applicable. Competing interests: The authors declare no competing interests.

Figures

Fig. 1
Fig. 1
MDA-MB-468 cell variants with distinct sensitivity to paclitaxel and their transcriptional profiles. A Sensitivity to paclitaxel in parental MDA-MB-468 (PS) cells and paclitaxel pre-treated resistant variants (PR): MDA-MB-468_PR+ (on drug pressure) and MDA-MB-468_PR (off drug pressure). Metabolic activity was detected with CellTiter-Glo after 4 days of treatment. Bars indicate relative metabolic activity normalized to the activity in the non-treated respective controls (set to 100%); mean ± SEM (n = 3). Statistical significance was calculated by one-way ANOVA (* p < 0.05; ** p < 0.01; *** p < 0.001). B-D Transcriptional profile of PS and PR cells. B Heatmap of the 200 genes with the highest variation in RNA expression as measured by bulk RNAseq data from PR and PS cells (n = 3). C Volcano plot of differentially expressed genes in PR versus PS (n = 3). Colored dots indicate the genes with p.adj < 0.05 and abs(Log2Fold-change) > 0.58, where lines indicate the thresholds; red indicates upregulated genes, while blue indicates downregulated genes in PR cells. D GSEA performed using the gene sets in the Hallmark Signature Database on values ranked on Log2Fold-change in C. Only pathways with p.adj < 0.05 in GSEA are displayed (n = 3)
Fig. 2
Fig. 2
Paclitaxel sensitive and resistant cancer cells display distinct secretome profiles. CM was collected from PS and PR cells after 6 days in culture, and cytokines were quantified by Luminex technology using a 27-plex cytokine panel. A Heatmap indicating the cytokine profiles in the PR CM and PS CM (n = 3). B Fold-change of enriched or depleted cytokine levels with statistically significant difference in PR CM relative to PS CM, where bars indicate mean (n = 3). Statistical significance was calculated by unpaired two-tailed t test (* p < 0.05; ** p < 0.01; *** p < 0.001; **** p < 0.0001). C Concentration of the cytokines that were statistically significant different between PR CM and PS CM (n = 3), where bars indicate mean ± SEM
Fig. 3
Fig. 3
Effects of the cancer cell secretome on monocyte recruitment and differentiation. A Chemoattraction of monocytes by PS CM and PR CM was evaluated in a transwell chamber. After 24 h, monocyte recruitment was scored by measuring their metabolic activity with CellTiter-Glo. CCL2-stimulated recruitment (ΔCCL2 = signalCCL2 – signalcontrol) was used as a control, and the effect of PS CM and PR CM is presented relative to this control; bars indicate mean ± SEM (n = 3). Different symbol shapes indicate biological replicates. Statistical significance was calculated by paired two-tailed t test (** p < 0.01). B, C The identity of the monocyte-derived cells after cultivation in PS CM or PR CM for 6 days was evaluated by the expression of MΦ/DC markers, measured by flow cytometry; monocyte-derived MΦs and DCs were used as reference. B A representative heatmap indicating the marker expression profiles in reference cells and samples of interest. C Dot plots indicating the expression of markers, which discriminated DCs from MΦs, in reference cells and samples of interest
Fig. 4
Fig. 4
Comparison of MΦs (PS) and MΦs (PR) with respect to phagocytic activity, morphology and phenotype markers. MΦs (PS) and MΦs (PR) were generated by culturing monocytes in PS CM and PR CM, respectively, for 6 days before further characterization. A, B Phagocytic activity was analyzed by incubating the cells with pHrodo red zymosan bioparticles for 1 h, while staining the cells with calcein for live cell identification. A Representative images of cellular uptake of bioparticle (red) in live MΦs (green), obtained by Incucyte; scale bar 100 μm. B Phagocytic activity presented as area under the curve (AUC) of red signal intensity over time (shown in Supplementary Figure S5B) (n = 5). C-E The cell morphology was analyzed by Incucyte using the cell-by-cell module (n = 6). C Phase contrast pictures with color-coded cell masks to distinguish cells with low (turquoise) and high (pink) eccentricity; scale bar 100 μm. D Average cell eccentricity. E Percentage of cells with high eccentricity (Ecc. value ≥ 0.9). FH CD86 and CD163 expression as analyzed by IF (n = 3). F IF pictures for CD86 (green) and CD163 (red); scale bar 100 μm. G Quantification of CD86 and CD163 signals (pixels), presented as average cell signal. H The ratio between CD163 and CD86 signal in individual cells, presented as average. I, J CD86 and CD163 expression in MΦs co-cultured with PS and PR cells, determined by flow cytometry (n = 5). I Quantification of CD86 and CD163 signals presented as geometric mean of fluorescence intensity (MFI), after subtracting the autofluorescence background. J The ratio between CD163 and CD86 signal. All bars indicate mean ± SEM (n ≥ 3). Different symbol shapes indicate biological replicates, while the symbol outline indicates another PBMC donor. Statistical significance was calculated by unpaired two-tailed t test (B, D and E) or paired two-tailed t test (G, H, I and J) (* p < 0.05; ** p < 0.01; *** p < 0.001)
Fig. 5
Fig. 5
Comparison of MΦs (PS) and MΦs (PR) with respect to cytokine production in steady state and upon stimulation with IFNγ/LPS. MΦs (PS) and MΦs (PR) were generated by culturing monocytes in PS CM and PR CM, respectively, for 6 days. A-C MΦ cultures were washed, and cultured in fresh medium for 1 day, before their culture medium was collected and analyzed using a 27-plex cytokine panel. A Heatmap indicating the cytokine profiles, found in each MΦ culture medium (n = 3). B Fold-change of enriched or depleted cytokine levels in MΦs (PR) relative to MΦs (PS) culture media (n = 3), where bars indicate mean. C Concentrations of cytokines found in MΦs (PS) and MΦs (PR) culture media (n = 3), where bars indicate mean ± SEM. D The cytokine expression in MΦs was analyzed by RT-PCR. Fold-change of transcript levels of cytokines in MΦs (PR) relative to MΦs (PS) (n ≥ 3), where bars indicate mean ± SEM. E MΦs were cultivated with or without IFNγ/LPS stimuli for 1 day and analyzed for the cytokine expression by RT-PCR. Relative transcript levels in MΦs (PR) and MΦs (PS) are presented normalized to the levels in MΦs (M-CSF) (n ≥ 3), where bars indicate mean ± SEM. Different symbols represent biological replicates. Statistical significance was calculated by unpaired two-tailed t test (B and C) or paired two-tailed t test (D and E) (* p < 0.05; ** p < 0.01; *** p < 0.001; **** p < 0.0001)
Fig. 6
Fig. 6
Effect of cancer cell secretome on T cell activation. TCR-engineered T cells (Radium-1 or DMF5) were co-cultured with APCs, loaded or not with a cognate peptide (p621 or MART-1, respectively), in the presence of PS CM or PR CM or RPMI (Control). A Illustration of the experimental setup used to assess T cell activation by flow cytometry (created in https://BioRender.com). B Percentage of CD8+ T cells producing TNFα and IFNγ (n = 4, 2 for each TCR). C Percentage of CD8+ T cells expressing CD69, CD25 and CD137 (n = 4, 2 for each TCR). T cells co-cultured with APCs but no peptide, were used to define background expression (as shown in Supplementary Fig. S8). D, E Assessment of CD8+ T cell proliferation. D Percentage of T cells found in different generations (n = 4). E The division index measured by the proliferation module in FlowJo software. All bars represent mean ± SEM. Different symbol shapes indicate biological replicates, while the symbol outline specifies TCR; non-outlined indicates Radium-1 and outlined indicates DMF5. Statistical significance was calculated in activated T cells by RM one-way ANOVA (A-C) or one-way ANOVA (D) (* p < 0.05; ** p < 0.01)
Fig. 7
Fig. 7
NAC-associated changes in immune cell scores in chemoresistant tumors from the NeoAva clinical study, as determined by CIBERSORT. A Estimated scores of M1 and M2 MΦs and CD8+ T cells in tumors with no pCR, determined by CIBERSORT, using patient-matched biopsies pre- and post-NAC (n = 51). B Fraction of tumors with the indicated alterations, Δ Score (post-NAC minus pre-NAC) for each cell type. C Correlation plot of Δ Score between CD8+ T cell and M1 MΦ (left) or M2 MΦ (right). The cases with Δ Score zero in M1, M2 and CD8+ T cells are excluded. D Heatmap of changes in serum cytokine levels post- versus pre-NAC (ΔCytokine) in patients with no pCR (n = 26). The Δ Score of M1 MΦ, M2 MΦ and CD8+ T cells in each patient is indicated on the top bars. E The Δ Score of M2 MΦ in resistant patients with decreased (down) or increased (Up) ΔCytokine CCL2 or ΔCytokine CCL5 (n = 26). Statistical significance was calculated by paired two-tailed t test (* p < 0.05; **** p < 0.0001)

References

    1. Dent R, Trudeau M, Pritchard KI, Hanna WM, Kahn HK, Sawka CA, et al. Triple-negative breast cancer: clinical features and patterns of recurrence. Clin Cancer Res. 2007;13(15):4429. - PubMed
    1. Furlanetto J, Loibl S. Optimal systemic treatment for early triple-negative breast cancer. Breast care. 2020;15(3):217. - PMC - PubMed
    1. Cortazar P, Zhang L, Untch M, Mehta K, Costantino JP, Wolmark N, et al. Pathological complete response and long-term clinical benefit in breast cancer: the CTNeoBC pooled analysis. Lancet. 2014;384(9938):164. - PubMed
    1. Ladoire S, Mignot G, Dabakuyo S, Arnould L, Apetoh L, Rébé C, et al. In situ immune response after neoadjuvant chemotherapy for breast cancer predicts survival. J Pathol. 2011;224(3):389. - PubMed
    1. Park YH, Lal S, Lee JE, Choi YL, Wen J, Ram S, et al. Chemotherapy induces dynamic immune responses in breast cancers that impact treatment outcome. Nat Commun. 2020;11(1):6175. - PMC - PubMed

MeSH terms

LinkOut - more resources