. 2025 Jul 14;18(1):44.
doi: 10.1186/s13072-025-00610-9.

Epigenetic regulation of MED12: a key contributor to the leukemic chromatin landscape and transcriptional dysregulation

Affiliations

Epigenetic regulation of MED12: a key contributor to the leukemic chromatin landscape and transcriptional dysregulation

Arundhati Chavan et al. Epigenetics Chromatin. .

Abstract

Background: MED12 is a key regulator of transcription and chromatin architecture, essential for normal hematopoiesis. While its dysregulation has been implicated in hematological malignancies, the mechanisms driving its upregulation in acute myeloid leukemia (AML) remain poorly understood. We investigated MED12 expression across AML subgroups by integrating chromatin accessibility profiling, histone modification landscapes, and DNA methylation (DNAm) patterns. Functional assays using DNMT inhibition were performed to dissect the underlying regulatory mechanisms.

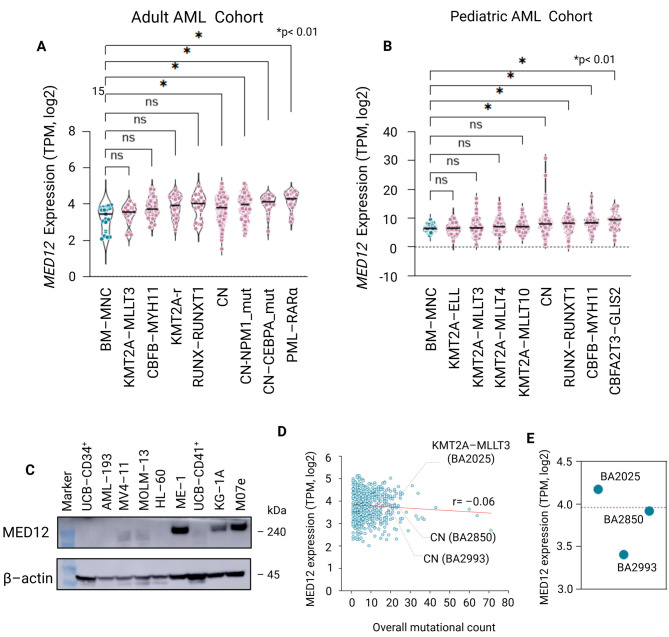
Results: MED12 shows subtype-specific upregulation in AML compared to hematopoietic stem and progenitor cells, independent of somatic mutations. Chromatin accessibility profiling reveals that the MED12 locus is epigenetically primed in AML blasts, with increased DNase hypersensitivity at regulatory elements. Histone modification analysis demonstrates strong H3K4me3 and H3K27ac enrichment around the transcription start site (TSS), consistent with promoter activation, while upstream and intragenic regions exhibit enhancer-associated marks (H3K4me1, H3K27ac). Notably, hypermethylation within TSS-proximal regulatory regions (TPRRs)-including promoter-overlapping and adjacent CpG islands-correlates with ectopic MED12 overexpression, challenging the canonical view of DNAm as strictly repressive. Functional studies show that DNMT inhibition via 5-azacytidine reduces MED12 expression despite promoter demethylation in cells with hypermethylated TPRRs, suggesting a noncanonical role for DNA methylation in maintaining active transcription. Furthermore, MED12 expression positively correlates with DNMT3A and DNMT3B expression, implicating these methyltransferases in sustaining its epigenetic activation.

Conclusion: This study identifies a novel regulatory axis in which aberrant DNA methylation, rather than genetic mutation, drives MED12 upregulation in AML. Our findings suggest that TPRR hypermethylation may function noncanonically to support transcriptional activation, likely in cooperation with enhancer elements. These results underscore the importance of epigenetic mechanisms in AML and highlight enhancer-linked methylation as a potential contributor to oncogene dysregulation. Future studies should further explore the role of noncanonical methylation-mediated gene activation in AML pathogenesis and therapeutic targeting.

Keywords: Acute myeloid leukemia; DNA methylation; Enhancer; MED12.


Conflict of interest statement

Declarations. Ethics approval and consent to participate: Not applicable. Transcriptome (mRNA expression) data analysis was conducted on pAML specimens from consented patients enrolled in the TARGET-AML study (phs000465), with access granted via the Database of Genotypes and Phenotypes (dbGaP). Transcriptome and mutation data for adult AML samples were obtained from the BEAT AML 2.0 study through VIZOME. Data on DNase hypersensitivity, histone modifications, and DNA methylation for primary AML patients were accessed from the BLUEPRINT Epigenome Consortium. Consent for publication: All authors have read the final version of manuscript and consent for publication. Competing interests: The authors declare no competing interests.

Figures

Fig. 1
Fig. 1
MED12 expression is subtype-specific in AML and independent of somatic mutation burden. (A) Violin plot showing MED12 expression (log₂ TPM) across adult AML subgroups from the BEAT AML cohort. Significant upregulation is observed in PML–RARα (p = 6.0 × 10⁻⁵), CN–CEBPA^mut (p = 2.6 × 10⁻³), CN–NPM1^mut (p = 1.3 × 10⁻³), and CN (p = 9.8 × 10⁻³) cases compared to normal bone marrow mononuclear cells (BM–MNC), based on Kruskal–Wallis one-way ANOVA with Dunn’s post-hoc test. No significant difference was found in KMT2A–MLLT3 (p > 0.99), CBFB–MYH11 (p = 0.094), KMT2A-rearranged (p = 0.014), or RUNX1–RUNXT1 (p = 0.044) after correction. (B) Violin plot showing MED12 expression across pediatric AML subgroups in the TARGET pAML cohort. Significant upregulation is observed in CBFA2T3–GLIS2 (p < 1 × 10⁻⁶), CBFB–MYH11 (p = 2 × 10⁻⁶), RUNX1–RUNXT1 (p = 7 × 10⁻⁶), and CN AML (p = 6 × 10⁻⁶) relative to BM–MNC, while KMT2A-ELL, -MLLT3, -MLLT4, and -MLLT10 subtypes do not show statistically elevated expression (all p > 0.48). (C) Immunoblot analysis of MED12 protein in AML cell lines and umbilical cord blood (UCB)-derived CD34⁺ and CD41⁺ hematopoietic cells or megakaryocyte progenitors respectively. Strong MED12 expression is observed in ME–1 (CBFB–MYH11⁺), M07e (CBFA2T3–GLIS2⁺), and KG–1 A (FGFR1-fusion⁺), while minimal expression is seen in KMT2A-r lines (MOLM–13, MV4–11), HL–60, AML–193, and normal controls. β-actin serves as loading control. (D) Scatter plot showing the correlation between MED12 expression (log₂ TPM) and total somatic mutation count in BEAT AML. No significant correlation is observed (Spearman’s r = − 0.06), suggesting MED12 expression is not associated with overall mutational burden. (E) MED12 expression in the three BEAT AML cases harboring MED12 mutations, highlighted by sample ID and cytogenetic context. One KMT2A–MLLT3+ case (BA2025) shows expression above the cohort median (dashed line), while two CN cases (BA2850, BA2993) show lower-than-median expression, indicating potential context-dependent effects
Fig. 2
Fig. 2
The MED12 locus exhibits AML-specific chromatin accessibility and transcription factor motif enrichment. (A) DNase I hypersensitivity (DHS) tracks showing chromatin accessibility across (DHS peaks) the MED12 locus in hematopoietic stem progenitor cells (HSC; ENCODE) and AML blasts (BLUEPRINT). Two AML-specific DHS regions—DHS-I and DHS-II—are highlighted, spanning the TSS proximal regulatory region (TPRR) region (E1–E2) and internal coding exons (E25–E26), respectively. (B-C) Box plots quantifying the span of accessible regions (in base pairs) for DHS-I and DHS-II. DHS-I is significantly broader in AML compared to HSCs (p < 0.01, Mann–Whitney U test), while DHS-II also shows increased accessibility. (D-F) Motif enrichment analysis of the AML-specific DHS-I region identifies significant overrepresentation of binding motifs for ELK1 (p = 2.25 × 10⁻¹²), HSF4 (p = 1.03 × 10⁻¹¹), and HIC2 (p = 4.60 × 10⁻¹⁴), based on in-silico prediction. These findings are computational and intended to provide a hypothesis-generating framework for potential regulatory interactions at the MED12 locus in AML
Fig. 3
Fig. 3
Epigenetic landscape of the MED12 regulatory locus in AML reveals active histone features and focal TPRR hypermethylation. (A) Integrated epigenomic view of the MED12 regulatory locus (chrX:71,118,596–71,142,450, hg38), including 5 kb upstream of the transcription start site (TSS), visualizing chromatin accessibility, histone modifications, and DNA methylation in AML blasts from bone marrow (BM) and venous blood (VB). Two DHS-enriched regions overlapping exon 1 (E1) and exon 2 (E2) are co-marked by active histone modifications H3K4me3 and H3K27ac. H3K36me3 spans the gene body, while H3K4me1 and H3K27me3 show more limited and variable deposition. (B-C) Bar plots showing the median enrichment score for each histone modification (H3K4me3, H3K27ac, H3K27me3, H3K36me3, H3K4me1) in BM (B) and VB (C) AML samples. Enrichment scores were derived from pre-processed BED files and correspond to peaks overlapping the MED12 gene body or upstream TPRR region. (D) DNA methylation profile across the MED12 regulatory locus (chrX:71,118,596–71,142,450), with CpG sites represented as hypermethylated (≥ 80% DNAm, dark orange) or hypomethylated (≤ 20% DNAm, light orange). Focal hypomethylation occurs at DHS-adjacent CpG island near the TSS, while the upstream TPRR and gene body exhibit widespread hypermethylation. (E) Box plots comparing the number of hyper- and hypomethylated DMRs across all BM samples. Hyper-DMRs were significantly more frequent than hypo-DMRs (64 vs. 23 DMRs; p < 0.01, Mann–Whitney U test). (F) Box plot comparing DNAm levels of hypermethylated DMRs in BM vs. VB. BM samples showed significantly higher DNAm at hyper-DMRs than VB samples (p < 0.01, Mann–Whitney U test). (G) Box plot comparing the number of hyper- and hypomethylated DMRs in VB samples. Hyper-DMRs were more abundant than hypo-DMRs (137 vs. 65 DMRs; p < 0.01, Mann–Whitney U test). (H) Box plot of DNAm levels at hypomethylated DMRs in BM vs. VB. No significant difference was observed (p = 0.24, Mann–Whitney U test), indicating conserved focal hypomethylation at DHS-associated elements
Fig. 4
Fig. 4
DNA Methylation Analysis of the MED12 TPRR and Gene Body in Various Cell Lines. (A-B) Methylation profiling of MED12 promoter region using Illumina 850 K array in TARGET AML cohort. (A) CBFA2T3–GLIS2-positive patients (n = 24) exhibit significantly higher DNA methylation at probe cg04768312 in the promoter compared to NBM controls (n = 10) (p = 0.0011, Mann–Whitney U test). (B) KMT2A-rearranged cases (n = 4) show a trend toward lower methylation (median = 0.4501) than NBM (median = 0.5237), though not statistically significant (p = 0.2). (C) Schematic of the MED12 locus with four regions (Regions 1–4) selected for pyrosequencing analysis. Regions 1–3 span the transcriptional promoter regulatory region (TPRR) and overlap a CpG island encompassing the TSS, TPRR, and exon 1. Sequencing primers specific to each region are labeled as S1–S4 in the diagram. (D) DNA methylation levels (% mC) across Regions 1–3 in a panel of cell lines. Cells with high MED12 expression (red) display increased methylation compared to those with low expression (blue). (E) Schematic of the MED12 locus with Region–4, selected for pyrosequencing analysis. Region 4 is located in the gene body and overlaps a DNase I hypersensitive site (DHS-II), and was sequenced using primer S4. (F) DNA methylation levels (% mC) across Region 4 in a panel of cell lines. Cells with high MED12 expression (red) display increased methylation compared to those with low expression (blue). (G-J) Quantitative comparison of methylation percentages between MED12low and MED12high expressing cell lines across the four regions. Statistical significance is indicated: (G) Region-1 shows significantly higher methylation in MED12high cells (p < 0.001). (H) Region-2 exhibits moderate but significant methylation differences (p < 0.05). (I) Region-3 does not show a statistically significant difference (p = 0.22, ns). (J) Region-4 displays significantly increased methylation in MED12high cells (p < 0.01)
Fig. 5
Fig. 5
Correlation Between MED12 Expression, DNA Methylation, and DNMTs, and the Effects of 5-Azacytidine Treatment. (AC) Correlation of MED12 expression with DNA methyltransferases in the BEAT AML cohort (n = 624). DNMT1 shows moderate correlation (r = 0.38, A), while DNMT3A (r = 0.68, B) and DNMT3B (r = 0.55, C) exhibit moderate positive correlations with MED12, implicating de novo methyltransferases in regulating promoter methylation. (D) Dose–response curves for 5-azacytidine (5-AZA) in AML cell lines. IC₅₀ values: M07e (1.5 µM), KG1A (3.5 µM), MOLM-13 (3.5 µM), and MV4-11 (4.6 µM), showing comparable sensitivity independent of baseline methylation. (E, F) Methylation analysis of 13 CpGs in Region-1 and 10 CpGs in Region-2 of the MED12 TPRR in M07e cells (control: red; 5-AZA: blue). Significant demethylation occurs at CpG-1 and − 13 in Region-1 (E), and CpG-2, -4, -7, and − 9 in Region-2 (F) after 5-AZA treatment (p-values shown). (G) qRT-PCR analysis confirms that MED12 expression is significantly reduced in M07e cells after 5-AZA treatment (p < 0.001), supporting a noncanonical, methylation-dependent activation mechanism. (H–I) In MOLM-13 cells, 5-AZA induces modest but significant demethylation at CpG-9 and − 13 in Region-1 (H) and at CpG-4 in Region-2 (I). (J) In contrast to M07e, MED12 expression increases following 5-AZA treatment in MOLM-13 (p < 0.05), consistent with canonical repression being relieved by promoter demethylation

Similar articles

References

    1. Swerdlow SH et al. (Lyon: IARC, 2008).
    1. Eriksson A, Lennartsson A, Lehmann S. Epigenetic aberrations in acute myeloid leukemia: early key events during leukemogenesis. Exp Hematol. 2015;43:609–24. 10.1016/j.exphem.2015.05.009. https://doi.org:. - PubMed
    1. Mehdipour P, Santoro F, Minucci S. Epigenetic alterations in acute myeloid leukemias. FEBS J. 2015;282:1786–800. - PubMed
    1. Sperlazza J, et al. Depletion of the chromatin remodeler CHD4 sensitizes AML blasts to genotoxic agents and reduces tumor formation. Blood. 2015;126:1462–72. 10.1182/blood-2015-03-631606. - PMC - PubMed
    1. Xu J, et al. Subtype-specific 3D genome alteration in acute myeloid leukaemia. Nature. 2022;611:387–98. - PMC - PubMed

LinkOut - more resources