. 2025 Jul;27(7):e70153.
doi: 10.1111/1462-2920.70153.

Unveiling Crocosphaera Responses to Phosphorus Depletion: Insights From Genome Analysis and Functional Characterization

Affiliations

Unveiling Crocosphaera Responses to Phosphorus Depletion: Insights From Genome Analysis and Functional Characterization

Chloé Caille et al. Environ Microbiol. 2025 Jul.

Abstract

Unicellular, nitrogen-fixing cyanobacteria (UCYN) thrive and support primary production in oligotrophic oceans, playing a significant role in the marine nitrogen cycle. Crocosphaera sp., a model organism for studying marine nitrogen fixation, is adapted to low phosphate (Pi) concentrations. Yet, how Crocosphaera copes with Pi depletion is rather poorly understood. We present a genomics analysis of Pi stress-responsive genes in this genus, encompassing six C. watsonii and two strains isolated in coastal environments, C. subtropica and C. chwakensis. We identified genes involved in Pi signalling and uptake, and dissolved organic phosphorus (DOP) hydrolysis. Results showed different genetic potentials to cope with Pi scarcity between the Crocosphaera strains. Physiological monitoring of cultures of C. watsonii WH8501 exposed to Pi depletion highlighted a capacity to survive for at least nine days, albeit with a skewed C:N:P stoichiometry. Upon addition of DOP, cultures efficiently recovered to a growth rate and cell composition equivalent to those observed under favourable conditions. The concomitant transcription analysis revealed diel expression patterns of Pi-related genes and endogenous clock genes, suggesting a possible circadian regulation. Our data deepen our understanding of the growth strategies Crocosphaera employs in Pi-limited environments, offering broader insights into microbial resilience in marine ecosystems.

Keywords: Crocosphaera; cyanobacteria; diel cycle; gene expression; genomics; phosphorus depletion.


Conflict of interest statement

The authors declare no conflicts of interest.

Figures

FIGURE 1
FIGURE 1
Heatmap representation of the number of Pi‐related gene orthologs within the 8 Crocosphaera genomes. The colour scale and associated number from 0 to ≥ 3 represent the number of homologues found in each genome. Grey indicates that no ortholog sequence was found in the genome.
FIGURE 2
FIGURE 2
Schematic representation of phosphate (Pi) transporter distribution across Crocosphaera strains. Label ‘1’ indicates the top‐scoring homologue (best hit) for each seed protein in every genome. (−) stands for the absence of ortholog. In each system, the Pi binding periplasmic protein is in green, the membrane subunit(s) in purple, and the cytoplasmic ATPase subunits in brown. The figure was drawn using BioRender.
FIGURE 3
FIGURE 3
Relative normalized gene expression of C. watsonii WH8501 during the Pi‐depleted phase (closed circles, days 1–4) and the DOP‐recovery phase (closed triangles, days 8–9). RT‐qPCR of the genes encoding for a regulator ptrA in purple (A), for a porin som in red, and transporters, sphX in black, pstS in blue, and ugpC in grey (B). Expression of the genes encoding for a glycerophosphoesterase ugpQ and a 5′‐nucleotidase are represented in brown and green, respectively (C). The Y‐axis scale is logarithmic. Time on the X axis is expressed in days, starting from the beginning of the high‐frequency monitoring phase, that is, five days after the transfer to a Pi‐depleted medium. All points are normalized by the 16S expression at the same point and relative to the first sampling point (Day 1, L0). The horizontal line (y = 1) materializes the value of the first sampling point. The expression variability of biological and analytical duplicates is represented by error bars. White and grey shades represent light and dark periods, respectively and red arrows mark the time of DOP addition.
FIGURE 4
FIGURE 4
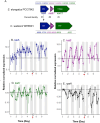
Gene cluster organization and genomic position of Crocosphaera watsonii WH8501 potential kaiABC and percent identity to Synechococcus elongatus PCC 7942 (A); relative normalized expression of C. watsonii potential circadian clock components kaiA (B), kaiB (C), kaiC (D) and regulator, rpaA (E) during the Pi‐depleted phase (closed circles) and the DOP‐recovery phase (closed triangles). The Y‐axes are logarithmic. Time on the X axis is expressed in days, starting from the beginning of the high‐frequency monitoring phase, that is, five days after the transfer to a Pi‐depleted medium. All points are normalized by the 16S gene expression at the same point and relative to the first sampling point (Day 1, L0). The horizontal line (y = 1) materializes the value of the first sampling point. Expression variability of biological duplicates and analytical duplicates are represented by error bars. White and grey shades represent light and dark periods, respectively, and red arrows mark the time of DOP addition.
FIGURE 5
FIGURE 5
Diel fluctuations in C. watsonii cell abundance (top panel, ×106 cells mL−1) and cell biovolume (bottom panel, μm3cell−1) represented for each culture replicate (blue, yellow, and green). Time on the X axis is expressed in days, starting from Day 1 at the beginning of the high‐frequency monitoring phase, that is, five days after the transfer to a Pi‐depleted medium. The dotted lines represent sampling in the first culture triplicate and continuous lines represent samples taken in the second triplicate (see methods). The red arrows mark the time of DOP addition in the second triplicate; sampling of the DOP‐recovery phase was performed during Days 8 and 9. White and grey shades represent light and dark periods, respectively.
FIGURE 6
FIGURE 6
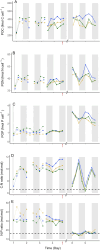
Diel fluctuations of C. watsonii C, N, and P cell contents in each replicate (blue, yellow, and green) during the Pi‐depleted (Day 1 to Day 4) and DOP‐recovery (Day 8 and Day 9) phases. Particulate organic carbon (POC, fmol C cell−1, A) and particulate organic nitrogen (PON, fmol N cell−1, B) were used to estimate the C:N ratio (mol:Mol, D). Particulate organic nitrogen (PON, fmol N cell−1, B) and particulate organic phosphorus (POP, fmol P cell−1, C) were used to estimate the N:P ratio (E). Each content was normalized by the cell abundance estimated at the same time point. Time on the X axis is expressed in days, starting from Day 1 at the beginning of the high‐frequency monitoring phase, which was five days after the transfer to a Pi‐depleted medium. The dotted lines represent sampling in the first culture triplicate and continuous lines represent samples taken in the second triplicate (see methods). The red arrows indicate the time of DOP addition. The dashed horizontal line represents the Redfield ratio. White and grey shades represent light and dark periods, respectively.

References

    1. Abed, R. M. M. , Dobretsov S., and Sudesh K.. 2009. “Applications of Cyanobacteria in Biotechnology.” Journal of Applied Microbiology 106: 1–12. 10.1111/j.1365-2672.2008.03918.x. - DOI - PubMed
    1. Acker, M. , Hogle S. L., Berube P. M., et al. 2022. “Phosphonate Production by Marine Microbes: Exploring New Sources and Potential Function.” Proceedings of the National Academy of Sciences of the United States of America 119: e2113386119. 10.1073/pnas.2113386119. - DOI - PMC - PubMed
    1. Aiba, H. , and Mizuno T.. 1994. “A Novel Gene Whose Expression Is Regulated by the Response‐Regulator, SphR, in Response to Phosphate Limitation in Synechococcus Species PCC7942.” Molecular Microbiology 13: 25–34. 10.1111/j.1365-2958.1994.tb00399.x. - DOI - PubMed
    1. Amstrup, S. K. , Ong S. C., Sofos N., et al. 2023. “Structural Remodelling of the Carbon–Phosphorus Lyase Machinery by a Dual ABC ATPase.” Nature Communications 14: 1001. 10.1038/s41467-023-36604-y. - DOI - PMC - PubMed
    1. Bell, D. W. , Pellechia P. J., Ingall E. D., and Benitez‐Nelson C. R.. 2020. “Resolving Marine Dissolved Organic Phosphorus (DOP) Composition in a Coastal Estuary.” Limnology and Oceanography 65: 2787–2799.

MeSH terms

LinkOut - more resources