

Use of a deep learning neural network to generate bone suppressed images for markerless lung tumor tracking
- PMID: 40660921
- PMCID: PMC12260777
- DOI: 10.1002/mp.17949
Use of a deep learning neural network to generate bone suppressed images for markerless lung tumor tracking
Abstract
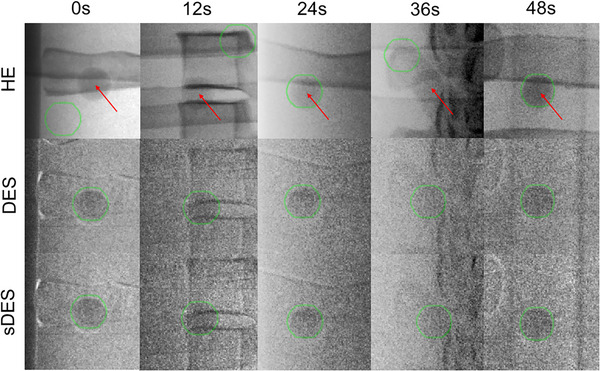
Background: Markerless tumor tracking (MTT) is being considered for real-time motion management of lung tumors. However, bony structures in conventional x-ray images can obfuscate the tumor, increasing tracking difficulty. Bone suppression using dual energy subtraction (DES) can improve tumor visibility but requires additional hardware or software that is not currently available with commercial on-board imaging (OBI) systems.
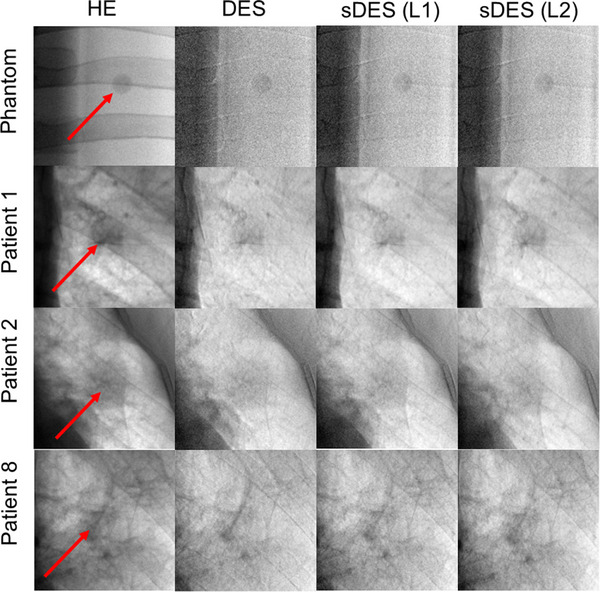
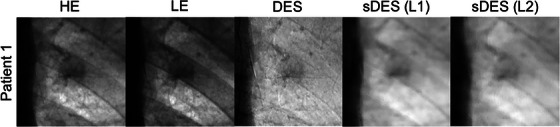
Purpose: This study compares DES images to synthetic DES (sDES) images generated by a U-net neural network, examining both image quality and tracking results.
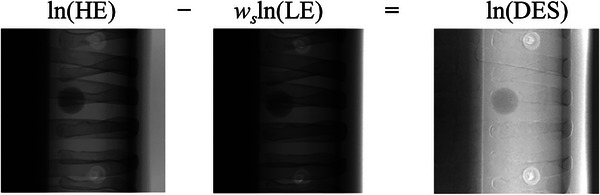
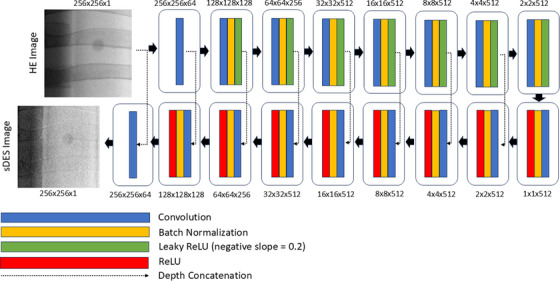
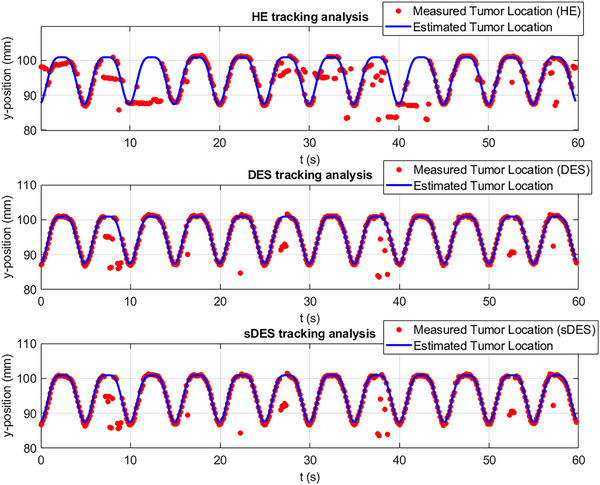
Methods: High (120 kV) and low (60 kV) energy image pairs were obtained over 180-degree rotation using fast-kV switching for a motion phantom and 20 lung cancer patients. DES images were generated offline using weighted logarithmic subtraction. A U-net was then trained to transform 120 kV images into sDES images. Images from the phantom (2694 image pairs) and 20 patients (4499 image pairs), were divided into training, validation, and test sets consisting of 70%, 15%, and 15% of the images, and used for network training and evaluation. The similarity between sDES images and ground truth DES images were evaluated using histogram comparison, structural similarity index measure (SSIM), peak signal-to-noise ratio (PSNR), and the 2D correlation coefficient (2DCC). Separately, a template-tracking algorithm was used to predict tumor location on patient and phantom sDES images. Since there was no ground truth location for the patient images, the predicted locations of the tumor in the HE and sDES images were compared against the predicted locations in the DES images. For the phantom images, tracking success rate (TSR) was defined as the percentage of images in which the predicted and ground truth tumor location differed by <2 mm, missing frames (MF) was defined as the percentage of images in which the tracking algorithm failed, and the mean absolute error (MAE) was also calculated from the differences between predicted and ground truth locations of the tumor.
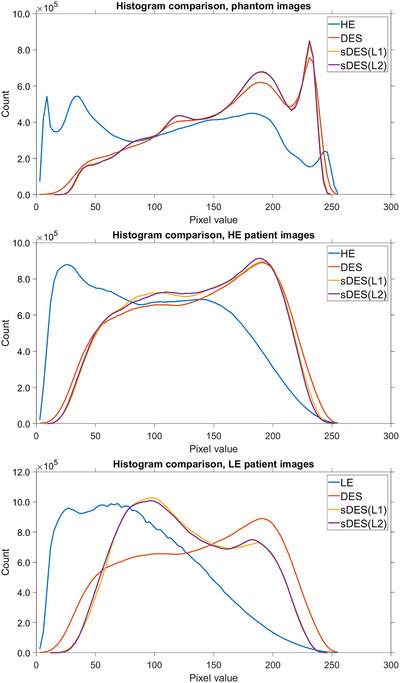
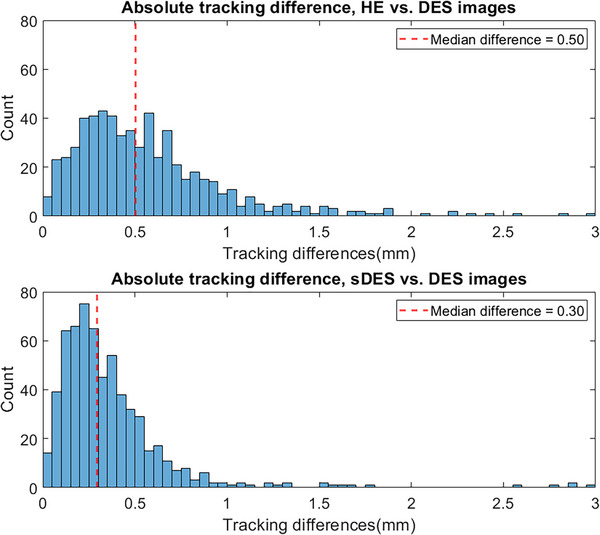
Results: Histogram count comparisons showed good agreement between the pixel distribution of sDES and DES images. Average SSIM, PSNR, and 2DCC scores for sDES images were 0.80 ± 0.05, 28.9 ± 3.4, and 0.97 ± 0.03 for phantom images, and 0.85 ± 0.04, 26.2 ± 3.5, and 0.97 ± 0.03 for patient images. For the patient images, the median tracking difference was 0.5 mm for HE versus DES images, and 0.3 mm for sDES versus DES images (p < 0.01). Separately, the TSR, MF, and MAE tracking metrics for the DES and sDES phantom images were found to be statistically equivalent, with scores of 93.5%, 0.22%, and 0.95 mm versus 93.5%, 0.22%, and 1.03 mm, respectively.
Conclusion: SDES images were found to be equivalent to DES images for use in MTT. The image similarity metrics comparing sDES and DES images showed good agreement, and MTT with DES and sDES images resulted in similar tracking metrics. These results indicate a trained U-net can be used to generate sDES images suitable for MTT using a single x-ray exposure without the need for additional hardware or software.
Keywords: deep learning; dual‐energy subtraction; intrafraction motion management.
© 2025 The Author(s). Medical Physics published by Wiley Periodicals LLC on behalf of American Association of Physicists in Medicine.
Conflict of interest statement
The authors declare no conflicts of interest.
Figures
Similar articles
-
An open-source deep learning framework for respiratory motion monitoring and volumetric imaging during radiation therapy.Med Phys. 2025 Jul;52(7):e18015. doi: 10.1002/mp.18015. Med Phys. 2025. PMID: 40665474 Free PMC article.
-
Technique selection and technical developments for 2D dual-energy subtraction angiography on an interventional C-arm.Med Phys. 2025 May;52(5):3228-3242. doi: 10.1002/mp.17661. Epub 2025 Feb 7. Med Phys. 2025. PMID: 39920906 Free PMC article.
-
Feasibility of a real-time dual energy markerless monitoring of lung tumors using a clinical room-mounted stereoscopic and monoscopic x-ray imaging system.Med Phys. 2025 Jul;52(7):e17966. doi: 10.1002/mp.17966. Med Phys. 2025. PMID: 40665506 Free PMC article.
-
Guided tissue regeneration for periodontal infra-bony defects.Cochrane Database Syst Rev. 2006 Apr 19;(2):CD001724. doi: 10.1002/14651858.CD001724.pub2. Cochrane Database Syst Rev. 2006. Update in: Cochrane Database Syst Rev. 2019 May 29;5:CD001724. doi: 10.1002/14651858.CD001724.pub3. PMID: 16625546 Updated.
-
The effect of sample site and collection procedure on identification of SARS-CoV-2 infection.Cochrane Database Syst Rev. 2024 Dec 16;12(12):CD014780. doi: 10.1002/14651858.CD014780. Cochrane Database Syst Rev. 2024. PMID: 39679851 Free PMC article.
References
-
- Heinzerling JH, Anderson JF, Papiez L, Boike T, Chien S, Timmerman R. Effectiveness of abdominal compression in stereotactic body radiation therapy (SBRT) treatment of lung and liver: 4D CT scan analysis of tumor and organ motion at varying levels of abdominal pressure. Int J Radiat Oncol Biol Phys. 2007;69(3):S134‐S135. doi: 10.1016/j.ijrobp.2007.07.247 - DOI - PubMed
MeSH terms
Grants and funding
LinkOut - more resources
Full Text Sources
Medical
