. 2025 Jul 13;6(7):e70285.
doi: 10.1002/mco2.70285. eCollection 2025 Jul.

Sulfide Quinone Oxidoreductase Alleviates Acute Ulcerative Colitis by Regulating Mitochondrial Dysfunction

Affiliations

Sulfide Quinone Oxidoreductase Alleviates Acute Ulcerative Colitis by Regulating Mitochondrial Dysfunction

Hailin Ma et al. MedComm (2020). .

Abstract

Alteration in mitochondrial function within intestinal epithelial cells were closely related to inflammatory bowel disease (IBD) progression. Sulfide quinone oxidoreductase (SQOR), located in the inner mitochondria membrane, is a crucial enzyme in sulfide metabolism. Here, we observed that SQOR was downregulated during colitis. Intestinal epithelial cells specific knockout of SQOR (Sqor CKO) mice were more susceptible to acute ulcerative colitis (UC) with lower hydrogen sulfide (H2S) levels, and the absence of SQOR caused a breakdown of the epithelial barrier through disruption of the tight junction proteins. Furthermore, analysis of the mitochondrial morphology and functions revealed increased mitochondrial damage when SQOR deficiency. Mechanistically, it is observed that SQOR knockout increased lipid peroxidation, malondialdehyde (MDA) levels and ferroptosis. Further results demonstrated that SQOR may rely on inhibiting excessive mitochondrial division and promoting mitochondrial biogenesis to regulate reaction oxygen species (ROS) levels in intestinal epithelial cells. Treatment with ROS scavengers (NAC) showed significant reduced colonic inflammation symptoms observed in DSS-treated Sqor CKO mice. Collectively, these findings demonstrate the protective role of SQOR in intestinal epithelial cells in maintaining mitochondrial homeostasis by regulating ROS and providing novel insight into UC.

Keywords: ROS; intestinal epithelial cells; mitochondrial dynamics; sulfide quinone oxidoreductase; ulcerative colitis.


Conflict of interest statement

The authors declare no conflicts of interest.

Figures

FIGURE 1
FIGURE 1
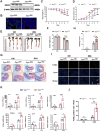
DSS‐induced acute UC significantly reduced SQOR levels. (A) C57BL/6 mice were treated with 3% DSS or water for 7 days, representative immunohistochemical (IHC) staining of SQOR in the colon, red arrows indicated intestinal epithelial cells (scale bar: 200 µm; enlarged scale bar: 100 µm; n = 3). (B, C) Mice were treated with 3% DSS for 7 days, and then colon was prepared to detect SQOR expression using western blot (n = 4). (D, E) Mice were treated with 3% DSS for 3, 5, and 7 days, representative photograph of colon tissue during DSS‐induced acute UC in colon tissue of WT mice, and the colon length was recorded at days 0, 3, 5, 7 (n = 3). (F, G) Relative SQOR protein expression in colonic tissues from controls or DSS‐treated WT mice during days 0, 3, 5, 7 using western blot (n = 3). The data were represented as mean ± SD. *p < 0.05, **p < 0.01, ***p < 0.001. ns, no significant difference.
FIGURE 2
FIGURE 2
SQOR deficiency in the intestinal epithelial cells exacerbates DSS‐induced UC. (A) Western blot analysis of SQOR level in intestinal epithelial cells from Sqor FL/FL and Sqor CKO mice (n = 3). (B) Immunofluorescence analysis of SQOR (green), Villin (red), and DAPI (blue) in the mouse colonic section was determined by immunofluorescence staining (scale bar: 100 µm; n = 3). (C, D) Daily body weight changes and DAI of Sqor FL/FL and SQORCKO mice treated with 3% DSS. (E, F) A representative photograph of colon of Sqor FL/FL and Sqor CKO mice on day 7 after DSS treated or not, and the colon length was recorded. (G, H) The histological analysis of colon sections was performed H&E staining from Sqor FL/FL and SQORCKO mice after DSS treated or not (scale bar: 200 µm; enlarged scale bar: 100 µm), histological scores from Sqor FL/FL and Sqor CKO mice after DSS treated or not (n = 3). (I, J) Apoptotic cells in colonic sections as determined by TUNEL assay (scale bar: 200 µm; n = 3). (K) Cytokines and chemokines mRNA levels in colon tissues from Sqor FL/FL and Sqor CKO mice after DSS treated or not. The data were represented as mean ± SD. n = 6 mice per group. *p < 0.05, **p < 0.01, ***p < 0.001, ****p < 0.0001. ns, no significant difference.
FIGURE 3
FIGURE 3
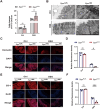
SQOR deficiency reduces intestinal barrier function in DSS‐induced acute UC in mice. (A) FITC‐dextran of serum determined intestinal permeability from Sqor FL/FL and Sqor CKO mice after DSS treated or not (n = 4). (B) Representative TEM images of tight junctions between intestinal epithelial cells from Sqor FL/FL and Sqor CKO mice after DSS treatment or not, white arrows indicating tight junctions. (C, D) The occludin in the mouse colon sections was determined by immunofluorescence staining from Sqor FL/FL and Sqor CKO mice after DSS treated or not (scale bar: 200 µm). (E, F) The ZO‐1 in the mouse colon sections was determined by immunofluorescence staining from Sqor FL/FL and Sqor CKO mice after DSS treated or not (scale bar: 200 µm). The data were represented as mean ± SD. n = 3 per group. *p < 0.05, **p < 0.01, ***p < 0.001. ns, no significant difference.
FIGURE 4
FIGURE 4
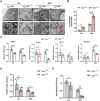
SQOR deficiency drives mitochondrial damage in intestinal epithelial cells. (A) Representative mitochondria images of DSS‐stimulated intestinal epithelial cells by TEM from Sqor FL/FL and Sqor CKO mice after DSS treated or not, red arrows indicate damaged mitochondria (scale bar: 5 µm; enlarged scale bar: 500 nm; n = 3). (B) Percentage of damaged mitochondria (n = 3). (C) Detection of the mRNA levels of Atp5a1, Cox4i1, Uqcrc1, and Ndufab1 in intestinal epithelial cells from Sqor FL/FL and Sqor CKO mice after DSS treated or not (n = 5). (D) The mtDNA copy number in intestinal epithelial cells from Sqor FL/FL and Sqor CKO mice after DSS treated or not (n = 6). (E) The ATP level in intestinal epithelial cells from Sqor FL/FL and Sqor CKO mice after DSS treated or not (n = 4). The data were represented as mean ± SD. *p < 0.05, **p < 0.01, ***p < 0.001, ****p < 0.0001. ns, no significant difference.
FIGURE 5
FIGURE 5
SQOR maintains mitochondrial dynamics homeostasis. (A) Mito‐Tracker was employed to mark mitochondria in NCM460 cells with transfected siRNA‐SQOR or NC siRNA in the presence or absence of DSS (scale bar: 20 µm; enlarged scale bar: 5 µm). (B) Representative TEM of mitochondria images in intestinal epithelial cells from Sqor FL/FL and Sqor CKO mice after DSS treated or not, red lines represent mitochondrial length measurements. (C) Quantitative analysis of mitochondrial length in TEM images. (D, E) Western blot analysis of SQOR and DRP1 in intestinal epithelial cells from Sqor FL/FL and Sqor CKO mice after DSS treated or not. (F, G) The DRP1 in the mouse colon sections was determined by immunofluorescence staining from Sqor FL/FL and Sqor CKO mice after DSS treated or not (scale bar: 100 µm). The data were represented as mean ± SD. n = 3 per group. *p < 0.05, **p < 0.01. ns, no significant difference.
FIGURE 6
FIGURE 6
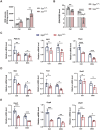
Intestinal epithelial cell function is associated with ROS. (A) Detection of ROS level in intestinal epithelial cells from Sqor FL/FL and Sqor CKO mice after DSS treated or not (n = 4). (B) GSH/GSSG ratio in intestinal epithelial cells from Sqor FL/FL and Sqor CKO mice after DSS treated or not (n = 6). (C) The mRNA levels of PGC1α, Nrf1, and Tfam in mouse intestinal epithelial cells from Sqor FL/FL and Sqor CKO mice after DSS treated or not (n = 6). (D) The mRNA levels of Gpx, Trx2, and Sod2 in mouse intestinal epithelial cells from Sqor FL/FL and Sqor CKO mice after DSS treated or not (n = 4). (E) The mRNA levels of Ucp2, Ucp4, and Ucp5 in mouse intestinal epithelial cells from Sqor FL/FL and Sqor CKO mice after DSS treated or not (n = 3). The data were represented as mean ± SD. n = 6 per group. *p < 0.05, **p < 0.01, ***p < 0.001. ns, not significant.
FIGURE 7
FIGURE 7
NAC alleviates DSS‐induced colitis model. (A) Daily DAI of Sqor FL/FL and Sqor CKO colitis mice treated with NAC. (B, C) A representative photograph of colon of Sqor FL/FL and Sqor CKO mice colitis mice treated with NAC, and the colon length was recorded. (D, E) The histological analysis of colon sections was performed H&E staining from Sqor FL/FL and Sqor CKO mice treated with NAC (scale bar: 100 µm), histological scores from Sqor FL/FL and Sqor CKO mice treated with NAC (n = 3). (F, G) Cytokines and chemokines mRNA levels in colon tissues from Sqor FL/FL and Sqor CKO mice treated with NAC (n = 3). The data were represented as mean ± SD. n = 6 mice per group. *p < 0.05, **p < 0.01, ***p < 0.001, ****p < 0.0001. ns, no significant difference.
FIGURE 8
FIGURE 8
A proposed mechanism by which SQOR alleviated DSS‐induced acute UC by ameliorating mitochondrial dysfunction.

References

    1. Wu Z., Huang S., Li T., et al., “Gut Microbiota From Green Tea Polyphenol‐Dosed Mice Improves Intestinal Epithelial Homeostasis and Ameliorates Experimental Colitis,” Microbiome 9, no. 1 (2021): 184. - PMC - PubMed
    1. Ma C., Yang D., Wang B., et al., “Gasdermin D in Macrophages Restrains Colitis by Controlling cGAS‐Mediated Inflammation,” Science Advances 6, no. 21 (2020): eaaz6717. - PMC - PubMed
    1. Ordás I., Eckmann L., Talamini M., Baumgart D. C., and Sandborn W. J., “Ulcerative Colitis,” Lancet 380, no. 9853 (2012): 1606–1619. - PubMed
    1. Li Y.‐y., Wang X.‐j., Su Y.‐l., et al., “Baicalein Ameliorates Ulcerative Colitis by Improving Intestinal Epithelial Barrier via AhR/IL‐22 Pathway in ILC3s,” Acta Pharmacologica Sinica 43, no. 6 (2021): 1495–1507. - PMC - PubMed
    1. Shmuel‐Galia L., Humphries F., Vierbuchen T., et al., “The lncRNA HOXA11os Regulates Mitochondrial Function in Myeloid Cells to Maintain Intestinal Homeostasis,” Cell Metabolism 35, no. 8 (2023): 1441–1456. e9. - PubMed

LinkOut - more resources