Review
. 2025 Jul 14;15(30):24696-24725.
doi: 10.1039/d5ra03927d. eCollection 2025 Jul 10.

Molecular imaging using (nano)probes: cutting-edge developments and clinical challenges in diagnostics

Affiliations
Review

Molecular imaging using (nano)probes: cutting-edge developments and clinical challenges in diagnostics

Meisam Samadzadeh et al. RSC Adv. .

Abstract

Molecular imaging has emerged as a transformative approach in the field of medical diagnostics, enabling the visualization of biological processes at the molecular and cellular levels. Additionally, the integration of molecular imaging with other imaging modalities such as positron emission tomography (PET), magnetic resonance imaging (MRI), computed tomography (CT), photoacoustic imaging (PAI), and fluorescence imaging (FI) has further broadened the scope of diagnostics. Despite significant advances in probe design, including multifunctional and targeted nanomaterials, their clinical translation remains limited by critical challenges. Key obstacles include nanoprobe stability in physiological environments, nonspecific accumulation in the reticuloendothelial system, potential toxicity, and difficulties in achieving optimal biocompatibility and controlled biodistribution. Moreover, the complexity of nanoprobe synthesis and batch-to-batch variability hinder scalable manufacturing and regulatory approval. The primary goal of this review is to critically analyze the current challenges hindering the clinical translation of molecular imaging nanoprobes in biomedicine. While existing literature extensively covers imaging techniques, this review uniquely emphasizes the persistent obstacles-such as nanoprobe stability, biocompatibility, off-target effects, and limited sensitivity-that impede their effective application. Unlike previous reviews, which tend to focus broadly on advancements, we offer a nuanced perspective by identifying specific barriers and proposing promising strategies to overcome them. We explore how surface modification, novel targeting ligands, and smart responsive systems can enhance nanoprobe performance. Furthermore, the review discusses how addressing these challenges is crucial for accelerating the development of multifunctional nanoprobes capable of simultaneous diagnosis and therapy, ultimately advancing personalized medicine. By highlighting these hurdles and potential solutions, this review aims to provide a comprehensive roadmap for researchers striving to optimize molecular imaging nanoprobes, thereby bridging the gap between laboratory innovation and clinical reality.


Conflict of interest statement

Author(s) declare no conflict of interest.

Figures

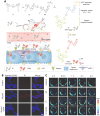
Fig. 1
Fig. 1. Schematic illustration of multifunctional roles of molecular imaging probes in cancer diagnosis and therapy. Nano(probes) are shown crossing the vascular barrier to target tumor tissue, enabling tumor visualization, theranostics, surgical guidance, disease mechanism study, treatment response monitoring, and targeted drug delivery.
Fig. 2
Fig. 2. (A) Fibrinogen extravasation in neuroinflammation. (B) (I) Displays a representative pontine EAE lesion with extended Gd uptake. Over 12 hours post-EP2104-R administration, fibrin-specific contrast enhancement (white arrow) remains visible but is displaced upon administering EP2104-La at a tenfold higher dose due to competitive binding. (II) Representative correlated immunofluorescence and confocal microscopy (IF-CM) images showing extensive fibrin(ogen) deposits (α) in the brainstem, which co-localize with CD45-positive immune cell infiltrates and mild demyelination (β). (III) describes LA-ICP-MS (Laser Ablation-Inductively Coupled Plasma Mass Spectrometry) analysis. Reproduced from ref. under the terms of the Creative Commons (CC BY) license. Springer Nature, copyright 2022.
Fig. 3
Fig. 3. (A) Scheme of synthesizing of CD40-Cy5.5–PIONs (B) in vivo T2-weighted MRI images of HFD-fed mice were taken both before and 24 hours after the injection of CD40-Cy5.5-SPIONs and BSA-Cy5.5-SPIONs, respectively. (C) In vitro fluorescence images. Reproduced from ref. with permission from Elsevier B.V, copyright 2023.
Fig. 4
Fig. 4. (A) Design of 68Ga-DOTA-Olaparib for PARP-1 binding, illustrating the structures of Olaparib and DOTA-Olaparib, their binding interactions with the PARP-1 catalytic domain, and molecular docking results. (B) (I) Confocal images of cells stained with FL-Olaparib (green) and DAPI (blue). (II) Confocal images of FL-Olaparib-stained cells with a 100-fold excess of Olaparib and DAPI. (III) Confocal images of FL-Olaparib-stained cells with a 1000-fold excess of DOTA-Olaparib and DAPI. (C) PET imaging of 68Ga-DOTA-Olaparib in SK-OV-3 models at 0.5, 1, and 2 h post-administration using MicroPET/CT. Reproduced from ref. under the terms of the Creative Commons CC BY license. Springer Nature, copyright 2023.
Fig. 5
Fig. 5. (A) Schematic image related to the application of 68Ga-FAPI-04 prob for PET/CT imaging of colorectal cancer. (B) Effect of different treatments (CTRL: control, SB525334: transforming growth factor-β receptor type 1 (TGF-βR) inhibitor, KN046: bispecific antibody used for blocking programmed death-ligand 1 (PD-L1) and cytotoxic T-lymphocyte-associated protein 4 (CTLA-4), and combination of SB525334 and KN046) on liver weights (I), CD8+ T cells (II), CD8+IFN-γ+ T cells (III), and CD8+GZMB+ T cells (IV) of mice had MC38 liver metastasis. 68Ga-FAPI PET/CT (V) and 18F-FDG PET/CT (VI) images of cancerous mice exposed with different treatments (T: tumor, B: bladder). (VII) Percentage of 68Ga-FAPI tumor uptake in cancerous mice exposed with different treatments. Reproduced from ref. under the terms of the Creative Commons Attribution 4.0 International License. American Society for Clinical Investigation (ASCI), copyright 2024.
Fig. 6
Fig. 6. (A) Preparation of [131I]IBAbHF, [131I]IBNHF, and [131I]HF. (B) SPECT images (Ax and Sag) of [131I]IBAbHF (I), [131I]IBNHF (II), and [131I]HF (III) in ApoE−/− AS groups (6 M) at 0.5, 4, and 10 h p.i. The lesions and nontarget regions were indicated by the yellow arrows and circles, respectively. (C) (I and II) Colocalization of FR-β (green) vs. CD68 (red) and α-SMA (green) vs. CD31 (red) within aortic sections of the WT and AS (3 and 6 M) mice. Reproduced from ref. with permission from American Chemical Society, copyright 2023.
Fig. 7
Fig. 7. (A) Schematic diagram showing IP for near-infrared fluoro-photoacoustic imaging of early-stage liver fibrosis. (B) Fluorescence images of LO2 cells treated with IP (15 μM) or pre-treated with GGT inhibitor DON (1 mM) before IP treatment. Scale bar: 20 μm. (C) PA images of mice after intravenous injection of IP or AP, with liver fibrosis mice pre-treated with DON. Scale bar: 5 mm. Reproduced from ref. with permission from Elsevier B.V, copyright 2023.
Fig. 8
Fig. 8. (A) Schematic image the design of macrophage membrane-coated silica NPs (MSINPs) for photoacoustic imaging of neuroinflammation. (B) Images of (I) H&E and immunofluorescence staining (of the prefrontal cortex (PFC) regions in mouse brains 24 hours after LPS or saline injection) and (II) Evans blue dye staining (of whole brains). (C) Schematic image related to the experimental procedure used for the establishment of LPS-induced neuroinflammation mice model (I). Results of the accumulation of MSINPs in mice (control and neuroinflammation models) during 24 h, fluorescence image (II) and quantitative data (III). Fluorescence image (IV) and quantitative data (V) of brains of control and neuroinflammation mice after 24 h MSINPs injection. Result of accumulation of MSINPs in vital organs after 24 h of injection, (VI) fluorescence image (VII) and quantitative data. Results of PAI (VIII) and quantitative data (IX) of control and neuroinflammation mice injected with MSINPs during 24 h. Reproduced from ref. with permission from American Chemical Society, copyright 2024.
Fig. 9
Fig. 9. (A) Schematic representation of the two proposed mechanisms for lipid droplet (LD) formation. (B) Controversial question regarding whether the number of LDs increases or decreases during starvation (C) (I & II) Confocal and STED super-resolution images of living HeLa cells under starvation at different time points. (III) Merged images showing the first (0 s) and last (514 s) frames from time-lapse STED super-resolution imaging of living HeLa cells under starvation. Scale bar: 2 μm. Reproduced from ref. under the Creative Commons Attribution License. Ivyspring International Publisher, copyright 2023.
Fig. 10
Fig. 10. (A) NIR-II imaging at various time points following intravenous injection of SeCF3-IRD800 in HepG2-Luc and HCCLM3 subcutaneous xenograft tumor models (n = 12), as well as in HepG2-Luc subcutaneous tumor blocking experiments (n = 6). (B) (I) 3D reconstruction of the tumor using LI-CT (tumor area indicated by the gray dashed wireframe). (II) Fluorescence-guided surgery process: Step 1: white light examination for HCC lesions; Step 2: first resection under white light; Step 3: NIR-II fluorescence-guided examination for residual lesions; Step 4: removal of residual lesions. (III) Pathological evaluation of all residual lesions. Reproduced from ref. with permission from Elsevier B.V, copyright 2023.

Similar articles

References

    1. Bai J. W. Qiu S. Q. Zhang G. J. Signal Transduction Targeted Ther. 2023;8:89. - PMC - PubMed
    1. MacRitchie N. Frleta-Gilchrist M. Sugiyama A. Lawton T. McInnes I. B. Maffia P. Pharmacol. Ther. 2020;211:107550. - PubMed
    1. Du M. Wang T. Yang Y. Zeng F. Li Y. Chen Z. Contrast Media Mol. Imaging. 2022;2022:5473244. - PMC - PubMed
    1. Chen K. T. Pharmaceuticals. 2023;16:1506. - PMC - PubMed
    1. Jamalipour Soufi G. Hekmatnia A. Iravani S. Varma R. S. ACS Appl. Nano Mater. 2022;5:10151–10166.

LinkOut - more resources