

This is a preprint.
White matter micro- and macrostructural properties in midlife individuals at risk for Alzheimer's disease: Associations with sex and menopausal status
- PMID: 40661344
- PMCID: PMC12259052
- DOI: 10.1101/2025.06.09.658686
White matter micro- and macrostructural properties in midlife individuals at risk for Alzheimer's disease: Associations with sex and menopausal status
Abstract
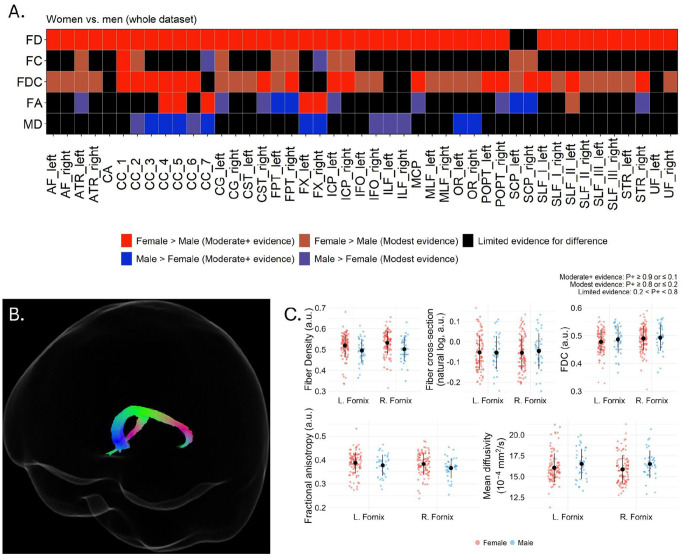
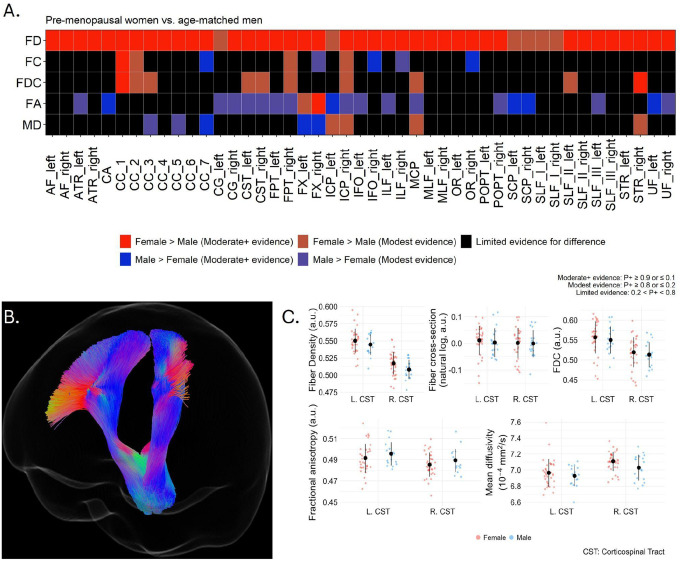
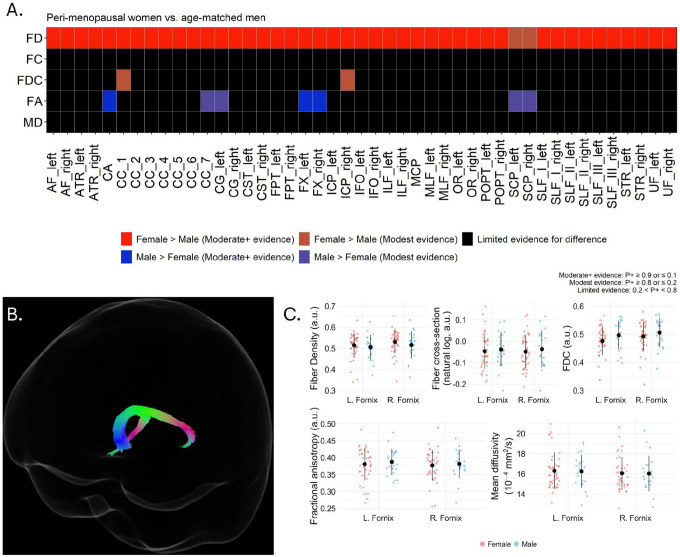
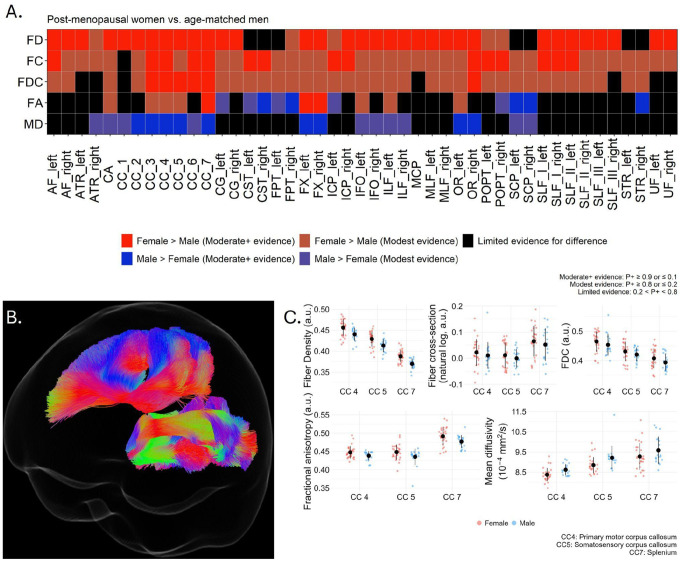
Women are at greater lifetime risk for Alzheimer's disease (AD), potentially due to midlife fractional anisotropy (FA) and lower mean diffusivity in fornix and corpus callosum, indicating more densely organized white matter. Perimenopausal women were the exception, with white matter profiles closely resembling those of men. Perimenopausal women exhibited minimal or absent fiber cross-section and FDC sex differences and a reversal of the fornix FA advantage observed in pre- and postmenopausal women. These cross-sectional results are consistent with sex differences in white matter organization. Importantly, the perimenopause emerges as a critical window of neural reorganization in the female midlife aging brain characterized by temporary convergence toward male-like white matter organization. Longitudinal analyses are key to identifying women who do or do not revert to a premenopausal profile, which may inform AD risk.
Figures
Similar articles
-
Long-term hormone therapy for perimenopausal and postmenopausal women.Cochrane Database Syst Rev. 2017 Jan 17;1(1):CD004143. doi: 10.1002/14651858.CD004143.pub5. Cochrane Database Syst Rev. 2017. PMID: 28093732 Free PMC article.
-
Behavioral interventions to reduce risk for sexual transmission of HIV among men who have sex with men.Cochrane Database Syst Rev. 2008 Jul 16;(3):CD001230. doi: 10.1002/14651858.CD001230.pub2. Cochrane Database Syst Rev. 2008. PMID: 18646068
-
The Black Book of Psychotropic Dosing and Monitoring.Psychopharmacol Bull. 2024 Jul 8;54(3):8-59. Psychopharmacol Bull. 2024. PMID: 38993656 Free PMC article. Review.
-
Sexual Harassment and Prevention Training.2024 Mar 29. In: StatPearls [Internet]. Treasure Island (FL): StatPearls Publishing; 2025 Jan–. 2024 Mar 29. In: StatPearls [Internet]. Treasure Island (FL): StatPearls Publishing; 2025 Jan–. PMID: 36508513 Free Books & Documents.
-
Aerobic exercise is associated with region-specific changes in volumetric, tensor-based, and fixel-based measures of white matter integrity in healthy older adults.Neuroimage Rep. 2023 Jan 4;3(1):100155. doi: 10.1016/j.ynirp.2022.100155. eCollection 2023 Mar. Neuroimage Rep. 2023. PMID: 40568049 Free PMC article.
References
Publication types
Grants and funding
LinkOut - more resources
Full Text Sources