[Preprint]. 2025 Jun 12:2025.06.11.653876.
doi: 10.1101/2025.06.11.653876.

Autocrine TGFβ2 enforces a transcriptionally hybrid cell state in Ewing sarcoma

Affiliations

Autocrine TGFβ2 enforces a transcriptionally hybrid cell state in Ewing sarcoma

Emma D Wrenn et al. bioRxiv. .

Abstract

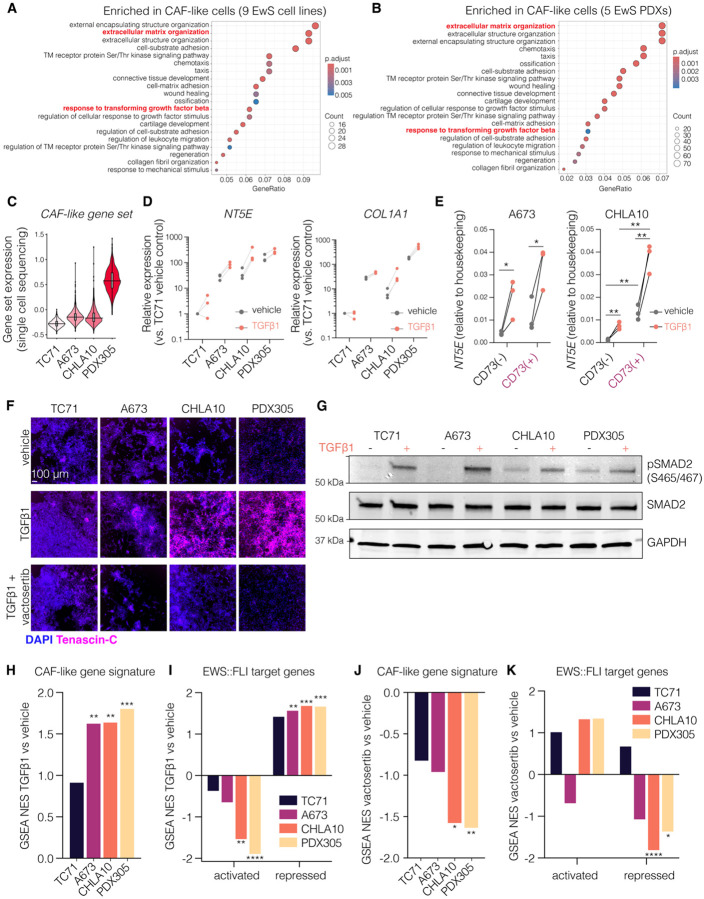
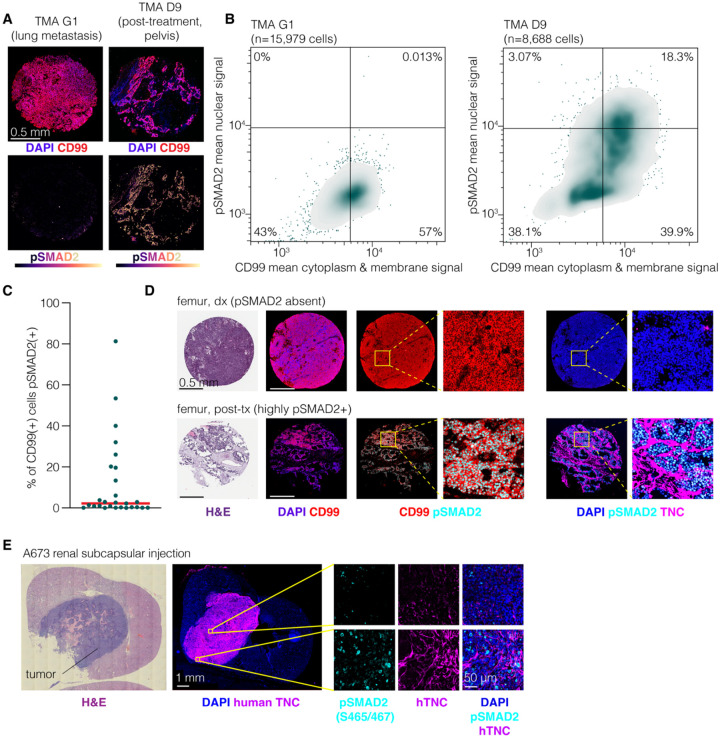
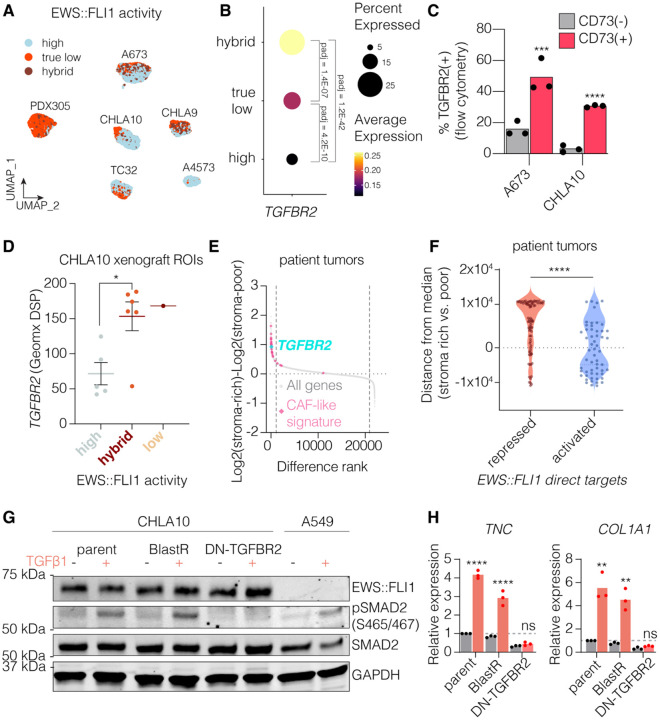
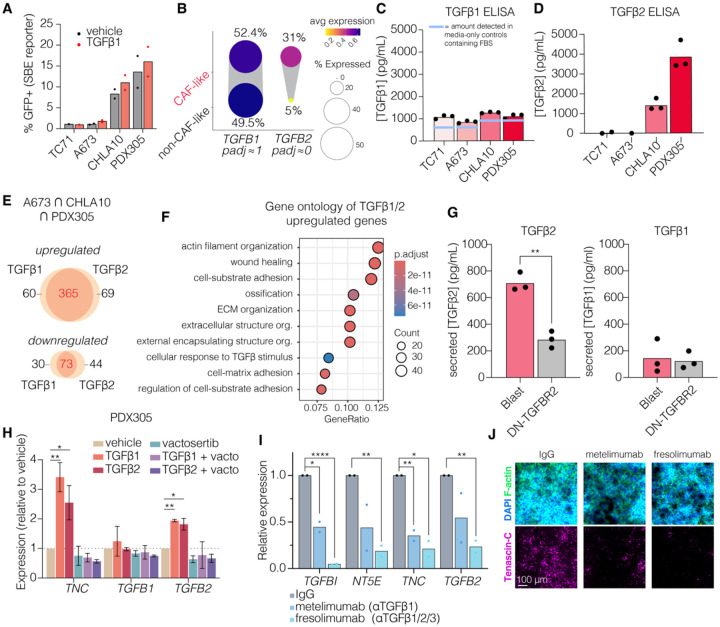
Sub-populations of cancer-associated fibroblast (CAF)-like tumor cells deposit extracellular matrix (ECM) proteins that support Ewing sarcoma (EwS) progression and metastasis. We previously showed a hallmark of CAF-like EwS cells is their hybrid transcriptional state wherein the driver fusion oncogene, EWS::FLI1, maintains activation of proliferative programs but loses capacity to repress mesenchymal genes. Here, we studied primary patient tumors and cell line models to identify molecular drivers of this hybrid state. Our data reveal that hybrid EwS cells are induced and maintained by a TGFβ signaling positive feedback loop. Hybrid cells de-repress TGFBR2 and upregulate expression and secretion of TGFβ2 to sustain pathway activation and ECM deposition. While TGFβ ligands can potently induce growth arrest in cells of epithelial origin, we show that TGFβ1 and TGFβ2 promote cell invasion of EwS cells without affecting proliferation. Thus, stroma and tumor-derived TGFβ ligands induce and maintain hybrid EwS cells to promote pro-metastatic cell phenotypes.


Conflict of interest statement

Competing Interests: KMB: DSMC member for Merck. All other authors declare that they have no competing interests.

Figures

Fig 1.
Fig 1.. TGFβ induces CAF-like gene expression in EwS cells.
Gene ontology of genes marking CAF-like cells (top 30% of cells by expression of 28-gene signature (10), marker genes padj <0.05) via single cell sequencing (scSeq) of (A) 9 Ewing sarcoma (EwS) cell lines, and (B) 5 EwS PDXs in NSG mice (9). (C) 28-gene EwS CAF-like signature expression in 4 EwS cell lines by scSeq (10). (D) TGFBI and COL1A1 expression by RT-qPCR after 48 hrs TGFβ1 (10 ng/mL). Normalized to vehicle treated TC71 sample. n=3, lines indicate same biological replicate. (E) NT5E expression by RT-qPCR in CD73(−) vs. CD73(+) cells treated for 24 hours post-FACS with 10 ng/mL TGFB1. n=3, p-values = unpaired t-tests. (F) Immunofluorescence after 72 hrs TGFβ1 (10 ng/mL) −/+ vactosertib (1 μM). Representative of n=2. (G) Immunoblots of phospho vs. total SMAD2 in EwS cells treated with TGFB1 (10 ng/mL, 48hrs). Representative of n=2. Loading control = GAPDH. (H) GSEA NES scores of 28-gene CAF-like signature in TGFβ1 vs. vehicle treated cells (p-values = padj). (I) GSEA of 100 EWS::FLI1 activated or repressed enhancer target genes (17) in TGFβ1 vs. vehicle treated cells (p-values = padj). (J) GSEA NES scores of 28-gene CAF-like signature in vactosertib vs. vehicle treated cells (p-values = padj). (K) GSEA of 100 EWS::FLI1 activated or repressed enhancer target genes (17) in vactosertib vs. vehicle treated cells (p-values = padj). ns, p > 0.05; *, p < 0.05; **, p < 0.01; ***, p < 0.001; ****, p < 0.0001.
Fig 2.
Fig 2.. EwS cells with active TGFβ signaling are detected in cell subpopulations in tumors.
(A) EwS TMA sections stained for CD99 (tumor marker) with low (left) and high (right) pSMAD2 S465/S467 signal. (B) Nuclear pSMAD2 S465/467 and cytoplasmic/membranous CD99 average intensity per cell. Gates define positive vs. negative populations (conservative threshold of pSMAD2 or CD99 true positives). (C) % CD99+ cells that were pSMAD2+ for each section of the TMA (n=27, Supplemental Table 2), red line = median. (D) H&E and IF from EwS TMA sections stained for CD99, pSMAD2 S465/467, and TNC (ECM protein). Right, zoomed insets showing CD99hi/pSMADlow/TNClow region vs. CD99hi/pSMAD2hi/TNChi region. (E) H&E of tumor formed 3-weeks post renal subcapsular injection A673 cells in NSG mice. Right, IF for pSMAD2 S465/467 and ECM marker TNC (human specific antibody).
Fig 3.
Fig 3.. EWS::FLI1-low and -hybrid transcriptional states escape TGFBR2 repression.
(A) scSeq data from 6 EwS cell lines with CAF-like subpopulations. Cells scored as EWS::FLI1 “true low” (below median expression of activated/above median expression repressed targets (17)) or “hybrid” (above median expression of activated and repressed targets), other cells termed “high”. (B) Single cell TGFBR2 expression grouped by EWS::FLI1 activity state (n=6 cell lines). (C) Flow cytometry of TGFBR2 and CD73. n=3 (D) TGFBR2 expression by GeoMx digital spatial profiling of 12 regions of CHLA10 xenografts in NSG mice, previously scored as EWS::FLI1 “low”, “hybrid”, or “high” activity (10). (E) 40 EwS patient tumors from stroma-poor or stroma-rich (≥30% non-tumor stroma) samples (36). Genes ranked by mean stroma-rich/mean stroma-poor sample values. Dashed lines = top/bottom 5% of genes. (F) Ranked enrichment in stroma-rich vs. stroma-poor samples in 40 patient tumors (36) of EWS::FLI1 activated or repressed target genes (17) (0 = not enriched). P-value = Mann-Whitney test. (G) Immunoblots of phospho vs. total SMAD2 and EWS::FLI1 in CHLA10 cells transduced with dominant negative TGFBR2 vs. empty vector control −/+ 24 hrs treatment with TGFβ1. Representative of n=2. A549 = positive control for TGFβ induced pSMAD2 and negative control for EWS::FLI1. Loading control = GAPDH. (H) RT-qPCR of TNC and COL1A1 in parent, empty vector, or dominant-negative TGFBR2 transduced CHLA10 cells −/+ 24 hrs treatment with TGFβ1. n=3, p-values = unpaired t-tests. ns, p > 0.05; *, p < 0.05; **, p < 0.01; ***, p < 0.001; ****, p < 0.0001.
Fig 4.
Fig 4.. TGFβ induces invasion but not cell cycle arrest in EwS cells.
(A) Real-time measurements of confluence (Incucyte) for TC71, A673, CHLA10, and PDX305 cells treated with vehicle controls, TGFβ1 (10 ng/mL), vactosertib (1 μM), or TGFβ1 + vactosertib. n=2, error bars = SEM. p-values = unpaired t-tests of confluence at 48hrs relative to 0hrs. (B) Measurement of cell area at 48 vs. 0hrs of Incucyte imaging for CHLA10 cells, n=2. Relative to 0hrs. p-value = unpaired t-test. (C) Cell viability measurements by CellTiter-Glo after 72 hrs of culture with vehicle control, TGFβ1 (10 ng/mL), vactosertib (1 μM), or doxorubicin (500 nM, positive control for cell death). n=3. (D) Soft agar colony forming assays of A673 (day 14) and CHLA10 (day 14) cells treated with vehicle control, TGFβ1 (10 ng/mL), or vactosertib (1 μM). (E) Number of colonies formed in soft agar for TC71 (day 14), A673 (day 14), CHLA10 (day 14), and PDX305 cells (day 35), relative to the number of colonies in the vehicle control well. n=2. (F) Invasive morphology of spheroids cultured for 4 days in 3D rat-tail collagen I rich gels treated with vehicle controls, TGFβ1 (10 ng/mL), or vactosertib (10 μM). Stained with phalloidin to mark F-actin. Yellow arrows = invasive strands. Representative of n=2. ns, p > 0.05; *, p < 0.05; **, p < 0.01; ***, p < 0.001; ****, p < 0.0001.
Fig 5.
Fig 5.. TGFβ2 is secreted by CAF-like EwS cells and induces its own expression.
(A) % GFP+ after transduction with SBE-GFP SMAD reporter−/+ TGFβ1 (48 hours, n=2). (B) TGFB1 and TGFB2 expression in CAF-like (top 30% expression CAF-like gene signature) vs. non-CAF-like cells by single cell sequencing (9 EwS lines). (C) ELISAs of TGFβ1 in conditioned media (3 days of culture). n=3. Dashed line indicates TGFβ1 level detected in media only controls. (D) ELISAs of secreted total TGFβ2 in conditioned media (3 days of culture). n=3. TGFβ2 not detected in media only controls. (E) Genes significantly (padj < 0.05) upregulated by TGFβ1 or TGFβ2 in A673, CHLA10, and PDX305 (bulk RNAseq, n=3). (F) Gene ontology (GO:BP) of the 365 genes commonly significantly induced (padj<0.05) by TGFβ1 and TGFβ2 in A673, CHLA10, and PDX305 cells. (G) ELISAs of secreted total TGFβ2 after 3 days of culture of CHLA10 dominant negative TGFBR2 or empty vector transduced cells. n=3. p-value = unpaired t-test. (H) Expression of TNC, TGFB1, and TGFB2 in PDX305 cells treated with TGFβ1 (10 ng/mL) −/+ vactosertib, TGFβ2 (10 ng/mL) −/+ vactosertib, or vactosertib alone (1 μM), n=2, p-values = unpaired t-tests. (I). Expression of TGFβ induced genes in CHLA10 cells treated with TGFβ ligand blocking antibodies (10 ug/mL, 4 days). (J) IF of TNC in CHLA10 cells treated with TGβ ligand blocking antibodies vs. IgG control (10 ug/mL, 4 days). ns, p > 0.05; *, p < 0.05; **, p < 0.01; ***, p < 0.001; ****, p < 0.0001.
Fig 6.
Fig 6.. Expression of TGFβ2 by EwS cell subpopulations antagonizes fusion-mediated repression of TGFβ signaling.
(A) GSEA NES values of EWS::FLI1 target genes (17) in TGFβ2 treated cell lines (bulk RNAseq, n=3, p-values = padj from GSEA). (B) TGFBR2 expression (RNA-seq) of cell lines treated with TGFβ1, TGFβ2, or vactosertib (n=3, error bars = standard error, p-values = padj). (C) Expression of TGFBR2, TGFB1, TGFB2 in shFLI1 vs. shNS CHLA10 cells by RT-qPCR (n=3). (D) RT-qPCR of TGFB2 and TGFBR2 in CHLA10 cells transduced with shNS or shFLI1 shRNAs (48hrs) then treated with vactosertib (1μM, 24 hrs). n=3. (E) RT-qPCR of TGFB2 and TGFBR2 in CHLA10 cells transduced with shNS or shFLI1 shRNAs (48hrs) then treated with TGFβ2 (10 ng/mL, 24 hrs). n=3. (F) RT-qPCR of EWS:FLI1 and its direct activated targets SOX2 and NR0B1 in CHLA10 cells transduced with shNS or shFLI1 shRNAs (48hrs) then treated with TGFβ2 (10 ng/mL, 24 hrs). Normalized to housekeeping genes then to the average of shNS samples. n=3. P-values = unpaired t-tests. (G) RT-qPCR of TGFB2 and TGFBR2 in TC71 cells transduced with shNS or shFLI1 shRNAs (48hrs) then treated with TGFβ2 (10 ng/mL, 24 hrs). n=3. (H) Model of the positive feedback loop between TGFBR2 activity, TGFβ2 expression, and de-repression of EWS::FLI1 downregulated targets in permissive EWS::FLI1 “low” or EWS::FLI1 “hybrid” states vs. EWS::FLI1 “high” cells. ns, p > 0.05; *, p < 0.05; **, p < 0.01; ***, p < 0.001; ****, p < 0.0001.

References

    1. Mehta A., Stanger B. Z., Lineage Plasticity: The New Cancer Hallmark on the Block. Cancer research 84, 184–191 (2024). - PMC - PubMed
    1. Davies A., Zoubeidi A., Beltran H., Selth L. A., The Transcriptional and Epigenetic Landscape of Cancer Cell Lineage Plasticity. Cancer Discov, Of1–of18 (2023). - PMC - PubMed
    1. Ganesh K., Massagué J., Targeting metastatic cancer. Nature Medicine 27, 34–44 (2021). - PMC - PubMed
    1. Lambert A. W., Pattabiraman D. R., Weinberg R. A., Emerging Biological Principles of Metastasis. Cell 168, 670–691 (2017). - PMC - PubMed
    1. Hanahan D., Hallmarks of Cancer: New Dimensions. Cancer Discovery 12, 31–46 (2022). - PubMed

Publication types

LinkOut - more resources