[Preprint]. 2025 Jun 11:2025.06.10.658871.
doi: 10.1101/2025.06.10.658871.

Structural Identification of Major Molecular Determinants for Phosphotyrosine Recognition in Tyrosine Kinases Reveals Tumour Promoting and Suppressive Functions

Affiliations

Structural Identification of Major Molecular Determinants for Phosphotyrosine Recognition in Tyrosine Kinases Reveals Tumour Promoting and Suppressive Functions

Nuo Cheng et al. bioRxiv. .

Abstract

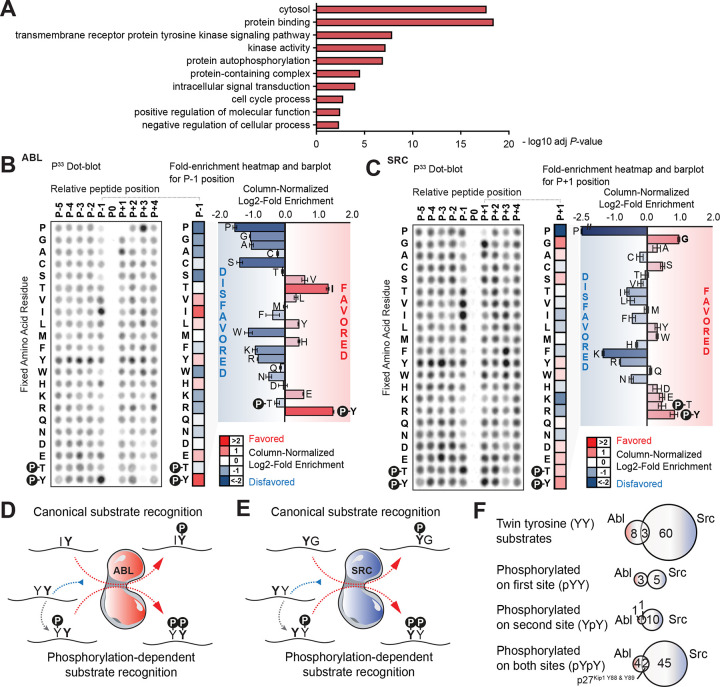
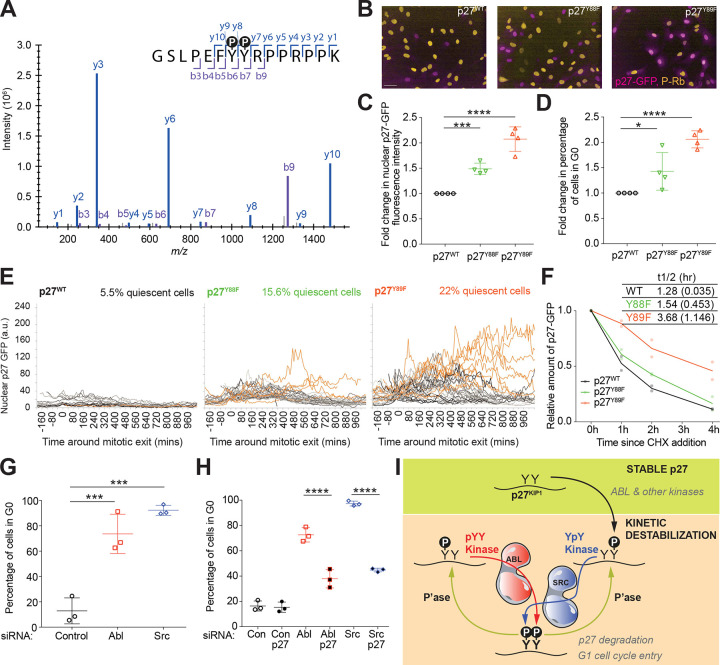
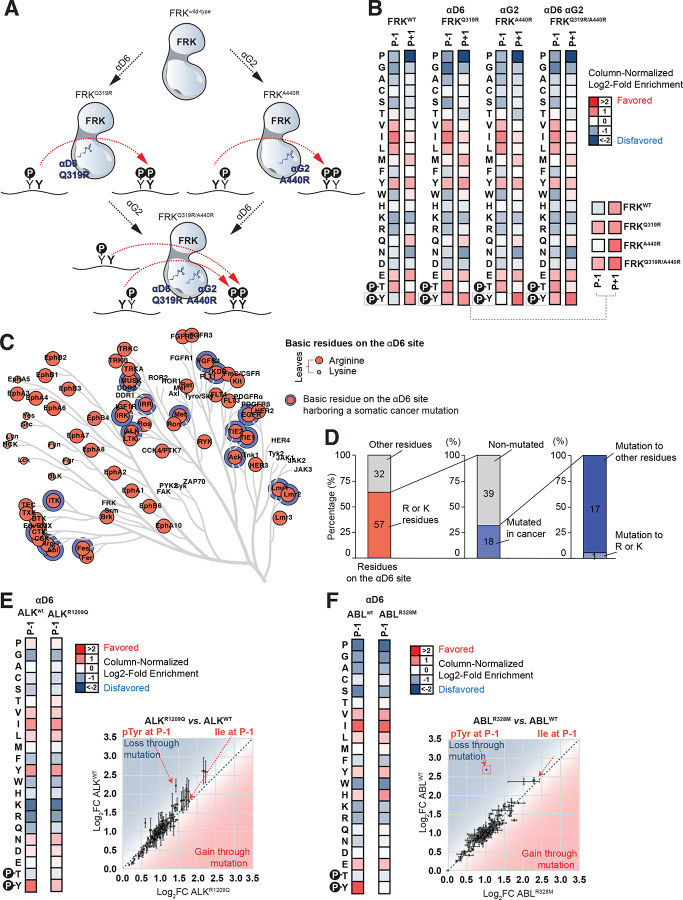
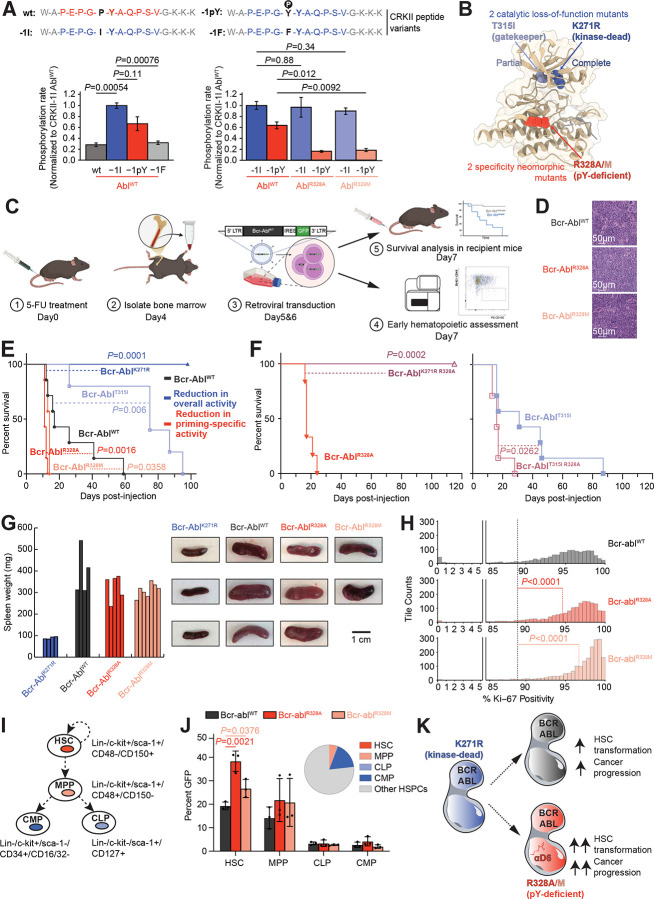
Protein tyrosine kinases activate signaling pathways by catalyzing the phosphorylation of tyrosine residues in their substrates. Mounting evidence suggests that, in addition to recognizing phosphorylated tyrosine (pTyr) residues through specific phosphobinding modules, many protein kinases selectively recognize pTyr directly adjacent to the tyrosine residue they phosphorylate and catalyze the formation of twin pTyr-pTyr sites. Here, we demonstrate the importance of this phosphopriming-driven twin pTyr signaling in promoting cell cycle progression through the cell cycle-inhibitory protein p27Kip1. We identify, structurally resolve, and tune two distinct molecular determinants driving the selective recognition of pTyr directly N- and C-terminal to the target phospho-acceptor tyrosine site. We further show structural and biochemical conservation in this recognition, and identify cancer-associated alterations to these determinants that are unable to recognize phosphoprimed substrates. Finally, using an in vivo mouse model of leukemia we show that Bcr-Abl mutants unable to recognize phosphoprimed substrates paradoxically result in enhanced tumor development and progression. These data indicate that Bcr-Abl, like other proto-oncogenes such as Ras or Myc, engages both pro- and anti-oncogenic programs - but in the case of Bcr-Abl, this is accomplished through a mechanism involving traditional and phosphoprimed substrate recognition.


Conflict of interest statement

L.C.C. is a founder and member of the board of directors of Agios Pharmaceuticals and is a founder and receives research support from Petra Pharmaceuticals; is listed as an inventor on a patent (WO2019232403A1, Weill Cornell Medicine) for combination therapy for PI3K-associated disease or disorder, and the identification of therapeutic interventions to improve response to PI3K inhibitors for cancer treatment; is a co-founder and shareholder in Faeth Therapeutics; has equity in and consults for Cell Signaling Technologies, Volastra, Larkspur and 1 Base Pharmaceuticals; and consults for Loxo-Lilly. J.L.J has received consulting fees from Scorpion Therapeutics and Volastra Therapeutics. M.B.Y. is on the Scientific Advisory Board of Odyssey Therapeutics. The remaining authors declare no competing interests.

Figures

Figure 1.
Figure 1.. The Non-Receptor Tyrosine Kinases Abl and Src Kinases Conditionally Phosphorylate Twin Tyrosine Substrates by Selectively Recognizing pTyr.
(A) Selected gene sets that are statistically significantly enriched in YY sites reported to be phosphorylated relative to all YY sites. (B) Positional Scanning Peptide Library (PSPL) screening results for Abl kinase shown on the left with the different fixed amino acid residues as rows (x axis) and different relative positions where the residues are fixed as columns (y axis). A column-normalized fold-enrichment heatmap for the relative position directly N-terminal from the phosphorylation site position (P−1) is shown in the middle with red denoting a favored amino-acid residue for Abl and blue denoting a disfavored one. To facilitate direct comparison between residues and their enrichment, the same fold-enrichment values are displayed as barplots. (C) Positional Scanning Peptide Library (PSPL) screening results for Src kinase shown as in B, but with a focus on the P+1 position. (D, E) Graphical representation of the canonical and non-canonical, phosphorylation-dependent motifs for Abl (D) and Src (E) kinases based on the data from panels B & C. (F) Top. Venn diagrams displaying phosphorylation sites reported in PhosphositePlus as being downstream of Abl kinase, Src kinase or both and that contain a tyrosine directly adjacent to them. Bottom. Further classification of these YY sites with those reported to be phosphorylated on the first N-terminal tyrosine, the second C-terminal or both. tyrosine residues 88 and 89 of p27Kip1 are highlighted as the only sites shared by Abl and Src that are reported to be phosphorylated on both residues (even if not necessarily simultaneously). See also Figure S1.
Figure 2.
Figure 2.. Phosphorylation of Tyrosine Residues p27Y88 and p27Y89 Is Required for Cell Cycle Progression.
(A) Mass spectrum displaying intensity (y axis) as a function of mass-to-charge ratio (x axis) for the different fragment ions also displayed as b- and y-ions within the p27 peptide sequence containing the twin pTyr-pTyr sites (p27pY88 pY89). (B) Representative merged images of p27-GFP (magenta) in genotypically CRISPR-tagged p27WT, p27Y88F and p27Y89F cell lines, fixed and immuno-stained for pS807/811 Rb (gold). Scale bar is 50 μm. (C, D) Quantification of the fold-change in (C) nuclear p27-GFP fluorescence intensity and (D) percentage of quiescent (G0) cells in the mutant p27 cell lines relative to the p27 wild type cell line. Quiescence was scored as pSer807/Ser811-Rb negative. Mean +/− STD is shown of n=4. One-way ANOVA (*** P <0.0005, **** P <0.0001). (E) Graphs showing quantification of nuclear p27-GFP in individual cells from timelapse imaging of p27WT, p27Y88F and p27Y89F cell lines, aligned in silico to time of mitotic exit. Orange traces are cells that enter spontaneous quiescence (e.g., do not enter S-phase for at least 600 mins). Numbers in orange are the percentage of cells in each cell line that enter spontaneous quiescence. Number of cells per cell line: p27WT n=18, p27Y88F n=32, p27Y89F n=41 cells. (F) Quantification of p27-GFP levels from Western blotting after treating cells with 100 μg/mL cycloheximide from panel Figure S2H, normalized to t=0h controls. Line represents mean of n=2, and table shows half-lives of p27WT, p27Y88F and p27Y89F proteins in hrs (+/−STD shown in brackets). (G) Quantification of the percentage of quiescent (G0, pRb-) cells after siRNA-based knock-down of Abl and Src compared to non-targeting control siRNA treatment. Graph shows the mean +/− STD of n=3. One-way ANOVA (*** P <0.0005). (H) Quantification of the percentage of quiescent cells (G0) after siRNA-based knock-down of p27 alone and in combination with Abl, Src or non-targeting control siRNA treatment. Data shown is mean +/− STD of n=3. One-way ANOVA (**** P <0.0001). (I) Model illustrating how different non-redundant phosphorylating events on p27 at Y88 and/or Y89 by Abl and Src could differentially regulate p27 degradation and G1 cell cycle entry. See also Figure S2.
Figure 3.
Figure 3.. The Arginine in Position αD6, AblR328, is Required for the N-terminal Recognition of pTyr in the Active Site of Abl Kinase.
(A) Structural modeling of Abl and its optimal substrate peptide Abltide (PDB: 2G2F), where the canonical Ile directly N-terminal of the target tyrosine is replaced with pTyr, depicted in red, and the closest basic residue in Abl, AblR328, is depicted in blue. (B) Graphical representation of the non-canonical, phosphorylation-dependent motif for Abl kinase with AblR328 as a candidate molecular determinant driving the recognition of pTyr directly N-terminal from the target tyrosine. (C) Positional Scanning Peptide Library (PSPL) screening results for AblWT, AblR328K and AblR328A kinases with the different fixed amino acid residues as rows (x axis) and different relative positions where the residues are fixed as columns (y axis). A column-normalized fold-enrichment heatmap for each kinase variant for the relative position directly N-terminal from the phosphorylation site position (P−1) is shown on the right with red denoting a favored amino-acid residue and blue denoting a disfavored one. (D) Scatterplots quantitatively comparing the column-normalized fold-enrichment values for each spot in the PSPL experiments comparing between AblR328K and AblWT (left), and AblR328A and AblWT (right). Datapoints in the upper-left region of the scatterplot indicate that a specific amino acid residue in a specific position has become less favored or more disfavored, whereas datapoints in the lower-right region of the scatterplot would indicate a change in specificity leading to a more favorable or less disfavorable effect for that amino acid in that position. See also Figure S3.
Figure 4.
Figure 4.. The Arginine in Position αG2, SrcR472, is Required for the C-Terminal Recognition of pTyr in the Active Site of Src Kinase.
(A) Structure of Src (from PDB: 3D7T) by homology modeling it to the structure of Abl with its optimal substrate peptide (from PDB: 2G2F), where the canonical residue directly C-terminal of the target tyrosine is replaced with pTyr, depicted in red, and the closest basic residue in Src, SrcR472, is depicted in blue. (B) Graphical representation of the non-canonical, phosphorylation-dependent motif for Src kinase with SrcR472 as a candidate molecular determinant driving the recognition of pTyr directly C-terminal from the target tyrosine. (C) Positional Scanning Peptide Library (PSPL) screening results for SrcWT, SrcR472S and AblR472A kinases with the different fixed amino acid residues as rows (x axis) and different relative positions where the residues are fixed as columns (y axis). A column-normalized fold-enrichment heatmap for each kinase variant for the relative position directly C-terminal from the phosphorylation site position (P+1) is shown on the right with red denoting a favorable amino-acid residue and blue denoting a disfavorable one. (D) Scatterplots quantitatively comparing the column-normalized fold-enrichment values for each spot in the PSPL experiments comparing between SrcR472S and SrcWT (left), and SrcR472A and SrcWT (right). Datapoints in the upper-left region of the scatterplot indicate that a specific amino acid residue in a specific position has become less favored or more disfavored, whereas datapoints in the lower-right region of the scatterplot would indicate a change in specificity leading to a more favorable or less disfavorable effect for that amino acid in that position. See also Figure S4.
Figure 5.
Figure 5.. Multiple Tyrosine Kinases Recognise pTyr in Their Active Site and Encode the Same Molecular Determinants.
(A) Dendrogram displaying the phylogenetic relationship of the human tyrosine kinases with leaves coloured according to the presence or absence of basic amino acid residues (arginine or lysine) at the αG2 sites. (B) Dendrogram displaying the phylogenetic relationship of the human tyrosine kinases with leaves coloured according to the presence or absence of basic amino acid residues (arginine or lysine) at the αD6 sites. (C) Column-normalized fold-enrichment heatmaps for different kinases quantifying the PSPL results for the relative position directly N-terminal (P−1) and/or C-terminal (P+1) from the phosphorylation site position, with red denoting a favored amino-acid residue and blue denoting a disfavored one. (D) Positional Scanning Peptide Library (PSPL) screening results for IRK with the different fixed amino acid residues as rows (x axis) and different relative positions where the residues are fixed as columns (y axis). A column-normalized fold-enrichment heatmap for the relative position directly N-terminal from the phosphorylation site position (P−1) is shown on the right with red denoting a favored amino-acid residue for IRK and blue denoting a disfavored one. (E) X-ray Crystal structure of bis-phosphorylated (pTyr1158, pTyr1162) IRK. Inset. The 2Fo-Fc electron density (at 2.15 Å) is shown in purple, contoured at 1σ. Tyr1163 (P residue) of the activation loop is bound in the active site (in cis), hydrogen-bonded (black dotted lines) to Asp1132 and Arg1136 in the catalytic loop. pTyr1162 (P−1 residue) is salt-bridged (black dotted lines) to αD2 (Lys1085) and αD6 (Arg1089). Red crosses represent water molecules. See also Figure S5.
Figure 6.
Figure 6.. The Two Molecular Determinants are Non-Exclusive and Sufficient to Drive Active-Site Recognition of pTyr and Cancer Somatic Mutations Suppress this Recognition.
(A) Graphical model illustrating our hypothesis that the addition of the basic residue arginine to the αD6 site (left), αG2 site (right) or both (bottom) would lead to pTyr recognition directly N-terminal, C-terminal or on both sides from the target tyrosine. (B) Column-normalized fold-enrichment heatmaps for the different FRK variants quantifying the PSPL results for the relative positions directly N-terminal (P−1) and C-terminal (P+1) from the phosphorylation site position, with red denoting a favored amino-acid residue and blue denoting a disfavored one. For easier comparison, the results for pTyr on these (P−1 and P+1) positions for the four FRK variants are re-plotted at the bottom right. (C) Dendrogram displaying the phylogenetic relationship of the human tyrosine kinases with its leaves coloured in red according to the presence of basic amino-acid residues (arginine, lysine or histidine) on the αD6 as well as in blue if a cancer somatic mutation has been observed on that same site. (D) Summary of residue composition and cancer mutation status at the αD6 site across tyrosine kinases. (E, F) Left. Column-normalized fold-enrichment heatmaps for the cancer somatic mutation AlkR1209Q (E) or AblR328M (F) and its respective wild-type counterpart quantifying the PSPL results for the relative positions directly N-terminal (P−1) from the phosphorylation site position, with red denoting a favored amino-acid residue and blue denoting a disfavored one. Right. Scatterplot quantitatively comparing the column-normalized fold-enrichment values for each spot in the PSPL experiments comparing between AlkR1209Q and AlkWT (E) or AblR328M and AblWT (F). Datapoints in the upper-left region of the scatterplot indicate that a specific amino acid residue in a specific position has become less favored or more disfavored, whereas datapoints in the lower-right region of the scatterplot would indicate a change in specificity leading to a more favorable or less disfavorable effect for that amino acid in that position. See also Figure S6.
Figure 7.
Figure 7.. The Bcr-AblR328A and Bcr-AblR328M Variants Result in High Stem Cell Progenitors and Faster Myeloproliferative Progression Uncovering an Anti-Oncogenic Function Downstream of the Pro-Oncogenic Bcr-Abl Kinase In Vivo.
(A) Phosphorylation rates of CrkII peptide variants with substitutions at the −1 position relative to the target tyrosine (illustrated at the top). Left. Phosphorylation rates measured for AblWT using −1F, −1I, and −1pY variants, normalized to −1I. Right. Relative phosphorylation rates comparing the kinase activity of AblWT, AblR328A and AblR328M against two variant peptides of the Abl natural substrate CrkII. Data represent reaction slopes from in vitro kinase assays shown in Figure S7A. (B) Structural illustration of the 2 catalytic loss-of-function mutants, Bcr-AblT315I and Bcr-AblK271R, and 2 specificity neomorphic mutants, Bcr-AblR328A and Bcr-AblR328M incapable of recognizing phosphoprimed substrates. (C) Schematic representation of Bcr-Abl-driven in vivo mouse model experiments. (D) Sections from spleen of representative Bcr-AblWT, Bcr-AblR328A, and the Bcr-AblR328M transplanted animals were stained with haematoxylin and eosin (H&E). Scale bars are 50 μm. (E) Comparison of the percent survival over time for mice harbouring Bcr-AblWT, Bcr-AblT315I, Bcr-AblK271R, Bcr-AblR328A, and the Bcr-AblR328M variants. (F) Left. Comparison of the percent survival over time for mice harbouring the hypomorphic gatekeeper variant Bcr-AblT315I either by itself or in combination with the Bcr-AblR328A mutation, Bcr-AblR328A T315I. Right. Comparison of the percent survival over time for mice harbouring the variant Bcr-AblR328A either by itself or in combination with the kinase-dead mutation, Bcr-AblR328A K271R. (G) Left. Spleen weights measured from mice injected with Bcr-AblK271R, Bcr-AblWT, Bcr-AblR328A, or Bcr-AblR328M. Right. Representative images of spleens from mice injected with Bcr-AblK271R, Bcr-AblWT, Bcr-AblR328A, or Bcr-AblR328M. (H) Tile-based quantification of Ki-67+ cells in spleen IHC sections from mice expressing Bcr-AblWT, Bcr-AblR328A, or Bcr-AblR328M. Ranges 0–5% and 85–100% are shown; the full distribution is provided in Figure S7D. (I) Diagram illustrating cell surface markers and relationship among the different stem cells and hematopoietic progenitors in terms of self-renewal (curved arrow) and developmental fate decisions (straight arrows) during differentiation. HSC, Hematopoietic Stem Cells; MPP, Multi-Potent Progenitor; CLP, Common Lymphoid Progenitor; CMP, Common Myeloid Progenitor. (J) Left. Comparison of the percentage of GFP-high cells within progenitor subpopulations including HSCs, MPPs, CLPs, and CMPs, following transduction of total HSPCs with Bcr-AblWT, Bcr-AblR328A, or Bcr-AblR328M. Data are shown as bar plots with individual data points and medians (n = 3 mice per group). Right. The pie chart shows the distribution of these subpopulations within the Bcr-AblWT-transduced HSPC pool. Equivalent distributions for Bcr-AblR328A and Bcr-AblR328M are shown in Figure S7E. (K) Graphical model summarizing our findings, where variants of Bcr-Abl impaired in their ability to recognize pTyr directly N-terminal from their target tyrosine site (Bcr-AblR328A/M) lead to a higher percentage of transformed, Bcr-Abl-GFP-high hematopoietic stem cells and faster myeloproliferative progression in vivo than WT Bcr-Abl. Our results imply that non-canonical pTyr-driven substrates downstream of Bcr-AblWT suppress transformation of hematopoietic stem cells and myeloproliferative progression in vivo. See also Figure S7.

References

    1. Eckhart W., Hutchinson M. A. & Hunter T. An activity phosphorylating tyrosine in polyoma T antigen immunoprecipitates. Cell 18, 925–933 (1979). - PubMed
    1. Smith A. E., Smith R., Griffin B. & Fried M. Protein kinase activity associated with polyoma virus middle T antigen in vitro. Cell 18, 915–924 (1979). - PubMed
    1. Schaffhausen B. S. & Benjamin T. L. Phosphorylation of polyoma T antigens. Cell 18, 935–946 (1979). - PubMed
    1. Hunter T. & Sefton B. M. Transforming gene product of Rous sarcoma virus phosphorylates tyrosine. Proc Natl Acad Sci 77, 1311–1315 (1980). - PMC - PubMed
    1. Sadowski I., Stone J. C. & Pawson T. A noncatalytic domain conserved among cytoplasmic protein-tyrosine kinases modifies the kinase function and transforming activity of Fujinami sarcoma virus P130gag-fps. Mol Cell Biol 6, 4396–4408 (1986). - PMC - PubMed

Publication types

LinkOut - more resources