[Preprint]. 2025 Jun 14:2025.06.13.659490.
doi: 10.1101/2025.06.13.659490.

Resolving a paradox about how vision is transformed into familiarity

Affiliations

Resolving a paradox about how vision is transformed into familiarity

Simon Bohn et al. bioRxiv. .

Abstract

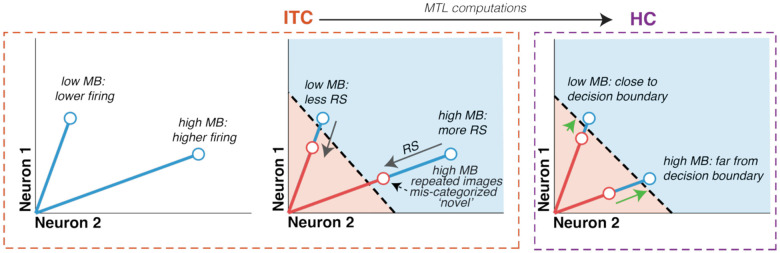
While humans and other primates are generally quite good at remembering the images they have seen, they systematically remember some images better than others. Here, we leverage the behavioral signature of "image memorability" to resolve a puzzle around how the brain transforms seeing into familiarity. Namely, the neural signal driving familiarity reports is thought to be repetition suppression, a reduction in the vigor of the population response in brain regions including inferotemporal cortex (ITC). However, within ITC, more memorable images evoke higher firing rate responses than less memorable ones, even when they are repeated. These two observations appear to conflict: if reduced firing leads to stronger memory signaling, then why are the images that induce greater firing more memorable? To resolve this paradox, we compared neural activity in ITC and the hippocampus (HC) as two rhesus monkeys performed a single-exposure image familiarity task. We found evidence that the paradox is resolved in HC where neural representations reflected an isolated memory signal that was larger for more memorable images, but HC responses were otherwise uncorrupted by memorability. Memorability behavior could not be accounted for by trivial computations applied to ITC (like thresholding). However, it could be decoded from ITC with a linear decoder that corrects for memorability modulation, consistent with the hypothesis that ITC reflects familiarity signals that are selectively extracted through medial temporal lobe (MTL) computation. These results suggest a novel role for the MTL in familiarity behavior and shed new light on how the brain supports familiarity more generally.


Figures

Figure 1:
Figure 1:. The familiarity-memorability paradox.
Left-side panels reflect hypothetical population grand mean firing rates; blue and red clouds reflect distributions of firing rates to novel and repeated images, respectively. Repetition suppression is the difference between the novel and repeated firing rate distributions, indicated with a solid gray arrow, and the implementation of a simple “spike count” classifier is shown by drawing a decision boundary at the overall mean firing rate (from the perspective of a downstream, brain area, the only information available is the firing rate). The distance from two exemplar points to the decision boundary is shown (left, green arrows). Projections of the firing rate clouds onto the classifier’s axis are shown as approximate probability density functions. Reading out this classifier would classify any image (regardless of the ground truth) above the boundary as novel, and anything below it as repeated. a) The repetition suppression hypothesis proposes that reductions in overall population vigor drive reports of familiarity, where repetition suppression is strongest immediately after seeing an image and disappears as a function of delay time. In this case, a simple linear decoder of ITC firing rate (right, solid green) predicts forgetting behavior (right, black dots; idealized here for conceptual simplicity). b) The paradox occurs when ITC population response vigor is also modulated by the images themselves, for instance, by memorability, where more memorable images produce higher ITC firing rates (left). In this case, an ITC firing rate decoder predicts that the most memorable images (solid black arrows, pointing to high memorability (MB) images) are the least memorable (because they have the highest firing rates), at odds with behavior (right, solid black dots).
Figure 2.
Figure 2.. The familiarity-memorability paradox is resolved in HC.
a) Two rhesus macaque monkeys performed a single-exposure visual recognition memory task in which they viewed one image per trial, each for 500ms, and responded with a saccade to a response target indicating whether they judged the image to be novel (never seen before) or repeated (seen exactly once before). Every image was shown exactly twice and the gap between novel and repeated presentations differed from immediate (“1-back”) to minutes (“64-back”). Images were drawn from a broad set of naturalistic objects and scenes and naturally varied in memorability, a scalar (range 0–1) that corresponds to the likelihood of a human correctly remembering that image in this task. Memorability scores were generated by using a convolutional neural network, MemNet, that was trained on human responses and that possesses accuracy approaching the ceiling imposed by inter-subject variability. b) The pooled results of the two macaque monkeys on this task for ‘novel’ (blue) and ‘repeat’ (red) trials (n=18,465 trials of each type). As predicted from the human-derived memorability scores, higher memorability images are more likely to be correctly recognized as repeated. Error shadow represents 95% confidence interval computed by bootstrapping (10,000 iterations). c-d) Neural data recorded in ITC (panel c) and HC (panel d) with spikes counted in the 300–500ms window following image presentation. Each dot represents the grand mean firing rate across all units to a novel (blue) or repeated (red) image of a given memorability. Average firing rate across all units and images is shown as a dashed line; this line would be the decision boundary in the most straightforward version of the repetition suppression hypothesis (any image above the line would be decoded as “novel”, and below the line would be decoded as repeated). In panel c (ITC), this decoding scheme would lead to poor predictions of observed memorability behavior (Fig. 1b), because higher memorability repeated images land above the line and would thus be classified as novel, however, these images are the most likely to be classified as repeated. In comparison, this decoding scheme applied to panel d (HC) would align much better with memorability behavior. Gray arrows indicate repetition suppression, which increases with memorability in both ITC and HC.
Figure 3.
Figure 3.. The data are consistent with a feedforward transformation between ITC and HC
a) The distribution of sensitivity to memory (d’) across the units in the ITC and HC populations (602 units in ITC, 836 in HC) in the 300–500ms spike count window. On the x-axis, a positive value for repetition suppression corresponds to units that fire less to a repeated presentation than to a novel one. The solid black vertical line separates units that are enhanced by repetition (left) from ones that are suppressed (right). b) Time course of memory signal in ITC and HC measured by the performance of a weighted linear decoder as a function of time (150ms spike count window, 20ms sliding intervals). Shaded regions represent one standard deviation across cross validations. c) Time course of the correlation between memorability and grand mean firing rate in ITC and HC (150ms spike count window, 20ms sliding intervals). Shaded regions reflect 95% confidence intervals, computed by bootstrapping with 10,000 resamples. Darker shadows indicate times in which the correlation is significantly different from zero (p<.05).
Figure 4:
Figure 4:. Thresholding ITC cannot explain the transformation to HC.
a) To evaluate the plausibility of the thresholding proposal, we performed a simulation based on tuning curves fit to each unit. Shown is an example unit. The red and blue lines correspond to the firing of this unit to novel and repeated images, arranged from best (highest evoked firing) to worst (lowest evoked firing) images on the x-axis. The vertical dashed line denotes the threshold at which the tuning curve is modified, and the inset shows the tuning curve after the modification. To assess the impact of thresholding, the same threshold (e.g., 60% as shown in panel a is applied to all ITC units, and the modified tuning curves are used to generate a simulated population; this is then repeated for a range of thresholds. b) The correlation between memorability and GMFR for the simulated populations is plotted as a function of the percent of the tuning curves that were modified on all units. To match the observed memorability correlation in HC, 93% of the tuning curve would have to be thresholded away. Error shadow depicts the 95% confidence interval. c) Memory information remaining in each simulated population after thresholding, assessed by a weighted linear decoder. The threshold required to match memorability (panel b) destroys nearly all memory information, implying that this proposal is implausible.
Figure 5.
Figure 5.. A memorability-correcting decoder applied to ITC predicts behavior.
a) Projections of ITC neural data onto a plane defined by repetition suppression (RS, where every unit is weighted equally) and a memorability decoder (MB, optimized to decode high versus low memorability images), rotated 45 degrees for clarity. Ellipses indicate the one-standard-deviation contour for 2D histograms of the projections of ITC population responses onto this plane. The eight ellipses correspond to novel (blues) and repeated (reds) images grouped by memorability scores into quadrants (hue). The classifier axis that best predicts behavior sits ~5 deg away from orthogonal to MB decoder (i.e. the one with no sensitivity to memorability). b) The quality of prediction (normalized difference in angle between the slope of the predicted to actual behavior, average of novel and repeated predictions) for different linear decoders defined by their rotation within the plane relative to the vector that weights all units equally (1,1,1,….). c) FLD Memory classifier performance at different angles of rotation within the MB/RS classifier plane (average of novel and repeated performance). d) Comparison of behavior (dashed) with neural predictions (solid) for five decoder rotations. For visualization, the neural predictions are rescaled to the same range as behavior with a multiplicative factor, loosely consistent with an adjustment in population size (see Methods). All analyses were performed in the 100–500ms spike count window following image presentation.
Figure 6:
Figure 6:. Schematic of the proposed two-stage process that converts visual experiences into memories.
Left: In the first stage (in ITC, orange dashed box), images evoke patterns of spikes coding for their identity, corresponding to population vector angle, and memorability determines population vigor, corresponding to population vector length (ITC left, blue). Middle: When an image is repeated (red), it triggers a reduction in firing, repetition suppression (RS, gray arrows). This creates larger magnitude RS for more memorable images because they evoke stronger novel firing. However, memory cannot be decoded from population response vigor in ITC, because highly memorable images fall on the wrong side of the decision boundary (dashed black line, blue shaded region would be decoded as ‘novel’ and red shaded area as ‘repeated’). Next, this representation undergoes a transformation in the medial temporal lobe to attenuate memorability modulation while retaining RS proportional to memorability. As a result, in HC (right, purple dashed box), the repeated presentations of higher memorability images are further (green arrow) from a decision boundary based on the overall mean firing rate. Consequently, a decoder can classify a neural representation as deriving from a novel or repeated image and explain memorability behavior by simply decoding overall firing rate.

References

    1. Isola P., Xiao J., Torralba A., and Oliva A. (2011). What makes an image memorable? In CVPR 2011 (IEEE; ), pp. 145–152.
    1. Bainbridge W.A., Isola P., and Oliva A. (2013). The intrinsic memorability of face photographs. J. Exp. Psychol. Gen. 142, 1323–1334. - PubMed
    1. Isola P., Jianxiong Xiao, Parikh D., Torralba A., and Oliva A. (2014). What makes a photograph memorable? IEEE Trans. Pattern Anal. Mach. Intell. 36, 1469–1482. - PubMed
    1. Bylinskii Z., Isola P., Bainbridge C., Torralba A., and Oliva A. (2015). Intrinsic and extrinsic effects on image memorability. Vision Res. 116, 165–178. - PubMed
    1. Khosla A., Raju A.S., Torralba A., and Oliva A. (2015). Understanding and predicting image memorability at a large scale. In 2015 IEEE International Conference on Computer Vision (ICCV) (IEEE; ), pp. 2390–2398.

Publication types

LinkOut - more resources