[Preprint]. 2025 May 23:2025.04.24.649900.
doi: 10.1101/2025.04.24.649900.

Hebb's Vision: The Structural Underpinnings of Hebbian Assemblies

Affiliations

Hebb's Vision: The Structural Underpinnings of Hebbian Assemblies

J Wagner-Carena et al. bioRxiv. .

Abstract

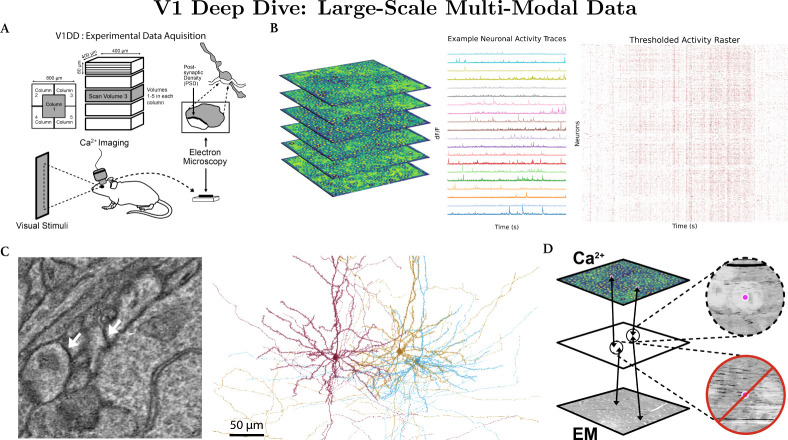
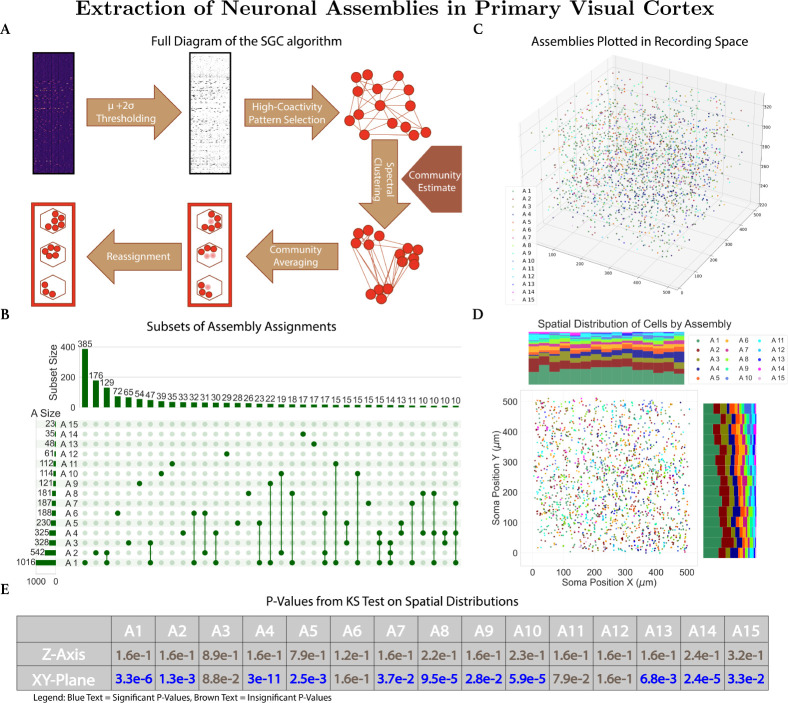
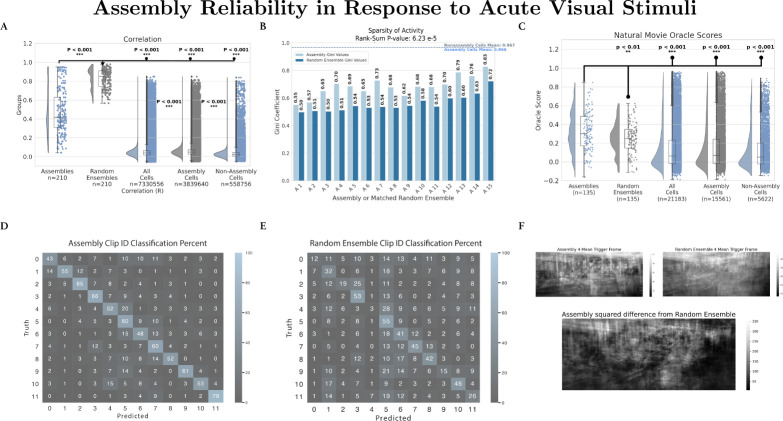
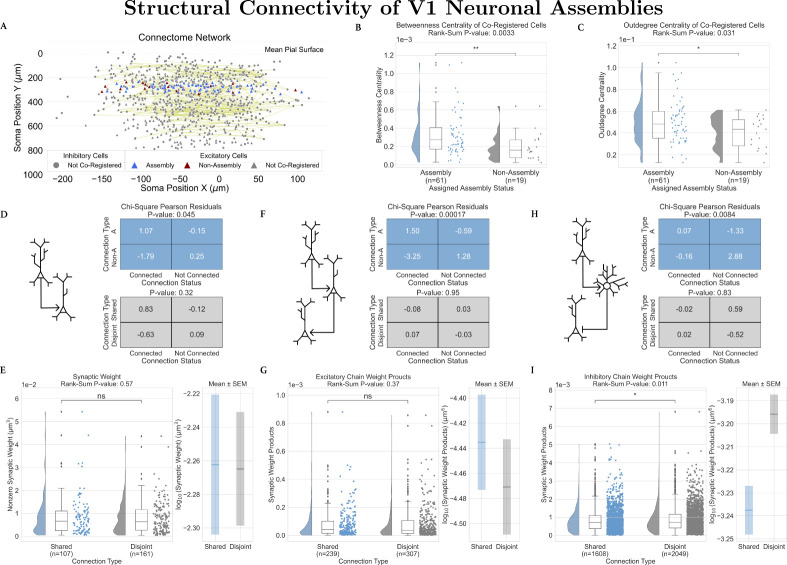
In 1949, Donald Hebb proposed that groups of neurons that activate stereotypically form the organizational building blocks of perception, cognition, and behavior. Finding the structural underpinning of such assemblies has been technically challenging, due to a lack of large-scale structure-activity maps. Here, we analyze this relation using a novel dataset that links in vivo optical physiology to connectivity using postmortem electron microscopy (EM). From the fluorescence traces, we extract neural assemblies from higher-order correlations in neural activity. Physiologically, we show that these assemblies exhibit properties consistent with Hebb's theory, including more reliable responses to repeated natural movie inputs than size-matched random ensembles and superior decoding of visual stimuli. Structurally, we find that neurons that participate in assemblies are significantly more integrated into the structural network than those that do not. Contrary to Hebb's original prediction, we do not observe a marked increase in the strength of monosynaptic excitatory connections between cells participating in the same assembly. However, we find significantly stronger indirect feed-forward inhibitory connections targeting cells in other assemblies. These results show that assemblies can be useful components of perception, and, surprisingly, they are delineated by mutual inhibition.


Figures

Figure 1:
Figure 1:
(A). Schematic of experimental data acquisition for the V1 Deep Dive dataset (V1DD). V1DD consists of dense thousands of excitatory neurons in an 800×800×800 μm3 section of mouse V1, recorded during awake behaving imaging sessions, with no behavioral task. Our work focuses on the center column, particularly the third scan volume (pictured here in grey). Postmortem, the same tissue volume was fixed and imaged via transmission electron microscopy, allowing for reconstruction of synaptic connectivity, including post-synaptic density (PSD) volumes. (B) Each scan volume for in vivo imaging consisted of six stacked scan planes. Dense calcium activity allowed for the extraction of individual neuronal traces, with 20 example traces shown in addition to a raster plot of thresholded normalized activity for all 2708 neurons in Scan Volume 3 of Column 1. (C) Example of a microscopy view of connected neurons, with white arrows pointing to PSD. Reconstructed pyramidal cells corresponding to the left microscopy view are shown on the right. (D) Schematic showing the framework for coregistration of cells between the calcium recordings and the electron microscopy. Identified ROIs were mapped to an interstitial space (see Methods 5.1.4), where the correspondences were manually inspected.
Figure 2:
Figure 2:
(A). SGC, an extraction algorithm for assemblies uniquely designed for calcium imaging data, groups frames of the calcium fluorescence input to determine when neurons in assemblies are coactivated. Figure adapted from Mölter et al. [32] (B). An UpSet [33] visualization of the subsets formed between assembly assignments. The histogram on the left represents the size of each individual assembly. The top histogram represents the size of the subsets between assemblies. Only subsets of ten neurons or greater were visualized. (C). Spatial positions of fifteen extracted assemblies in the three-dimensional recording field. There are 1960 neurons visualized, including neurons assigned to multiple assemblies (plotted only once) but not including the 748 neurons that were assigned to no assemblies. (D). Spatial distribution of assembly cells projected onto the x-y plane. Histograms for each axis are normalized to provide a per-bin proportional stack of the assembly distributions. (E). A table presenting the KS test results on each assembly’s spatial distributions. Values colored in blue represent significant results (p-value < 0.05), while brown signifies insignificant results. All values have been corrected for false discovery under the Benjamini-Hochberg Procedure.
Figure 3:
Figure 3:
(A) Raincloud plot of pairwise correlations of coactivation between assemblies, size-matched random ensembles, and sets of individual cells. Coactivation for an individual cell is equivalent to a binary thresholded activity raster. (B). Grouped bar plot of sparsity (measured by the Gini Coefficient) of coactivity over time in cell assemblies and the null-grouping of size-matched random ensembles. The random ensembles’ coefficients are significantly smaller than the set of assembly coefficients (Wilcoxon Rank-Sum p-value: 6.234e − 5). The average sparsity of individual assembly cells and non-assembly cells is also plotted as nearly equal horizontal dashed lines. (C). Raincloud plot illustrating the reliability of activity from assemblies and general neuronal populations in response to natural movies. Oracle scores of each assembly and random ensemble coactivity trace were plotted, as well as the scores of sets of individual cells. These oracle scores are computed for the concatenation of natural movie clips and their responses, rather than individual clips, in order to reduce the likelihood of sparse responses causing an artificially high reliability score. (D, E). Heatmap illustrating decoding accuracy of natural movie clips with Assemblies and Random Ensembles. Heatmap values indicate the accuracy of clip decoding by the percentage of presentation. Clip IDs, indicating a unique natural movie clip, are balanced such that each clip has an equal frequency of presentation. Values in the assembly heatmap are significantly greater than the random ensemble heatmap (Mann-Whitney u-stat: 7546.0, p-value: 6.07e − 5; one-sided on diagonal elements u-stat: 131.5, p-value: 3.25e − 4). (F). Example plots of the mean ‘trigger frame’ of assemblies and random ensemble during natural movies. Frames were generated by averaging the frames associated with peak coactivity. The natural movie frame was visually better reconstructed by the assembly activity than that of the random ensemble, as signified by the plotted squared difference.
Figure 4:
Figure 4:
(A). Visualization of the network being analyzed, showing the soma position of cells in the connectome, colored by cell-type and assembly assignment. All coregistered reconstructed neurons were found in layer 2/3 or layer 4 of V1. (B) A raincloud plot of betweenness centrality, demonstrating a higher centrality for assembly neurons than those not in assemblies(Wilcoxon Rank-Sum: p-value < 0.01). (C) A raincloud plot of outdegree centrality, a mathematical proxy for probability of connection, demonstrating a higher centrality for assembly neurons (Wilcoxon Rank-Sum: p-value < 0.05). (D,F,H). Chi-squared analysis of the likelihood of monosynaptic (D), disynaptic excitatory (F), and disynaptic inhibitory (H) connections (schematic on the left). This comparison was made between assembly neurons and non-assembly neurons (top-right) as well as between neurons that share an assembly membership and neurons that participate in disjoint assemblies (bottom-right). (E, G, I) Raincloud plots showing the combined synaptic PSD volume per extant monosynaptic (E), disynaptic excitatory (G), and disynaptic inhibitory (I) connection, each divided between origin and terminus cell pairs which share assemblies and those which participate in disjoint assemblies. Log-scaled plotting of the chain weights with SEM-based confidence intervals is included as an inset plot to the right of each panel.

Similar articles

References

    1. Hebb D. The Organization of Behavior (John Wiley & Sons, New York, 1949).
    1. Frégnac Y. Aplysia: Hebbian or not? Trends in Neurosciences 9, 410 (1986).
    1. Buzsáki G. Neural Syntax: Cell Assemblies, Synapsembles, and Readers. Neuron 68, 362–385 (2010). - PMC - PubMed
    1. Miehl C., Onasch S., Festa D. & Gjorgjieva J. Formation and computational implications of assemblies in neural circuits. The Journal of Physiology 601, 3071–3090 (2023). - PubMed
    1. Matheus Gauy M. et al. A Hippocampal Model for Behavioral Time Acquisition and Fast Bidirectional Replay of Spatio-Temporal Memory Sequences. Frontiers in Neuroscience 12, 961 (2018). - PMC - PubMed

Publication types

LinkOut - more resources