[Preprint]. 2025 Jun 10:2025.06.10.658877.
doi: 10.1101/2025.06.10.658877.

A spatial long-read approach at near-single-cell resolution reveals developmental regulation of splicing and polyadenylation sites in distinct cortical layers and cell types

Affiliations

A spatial long-read approach at near-single-cell resolution reveals developmental regulation of splicing and polyadenylation sites in distinct cortical layers and cell types

Careen Foord et al. bioRxiv. .

Abstract

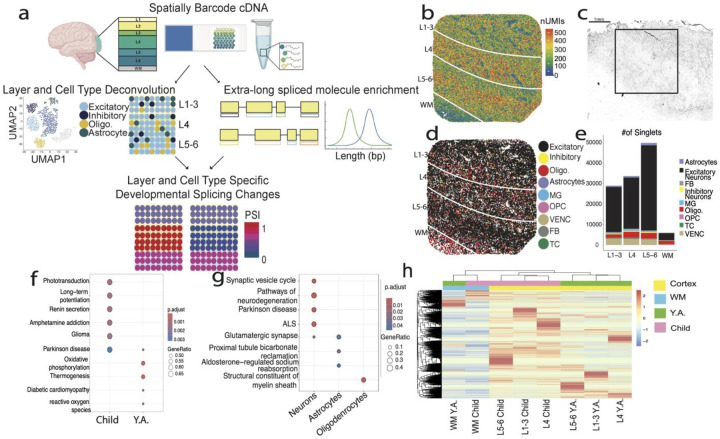
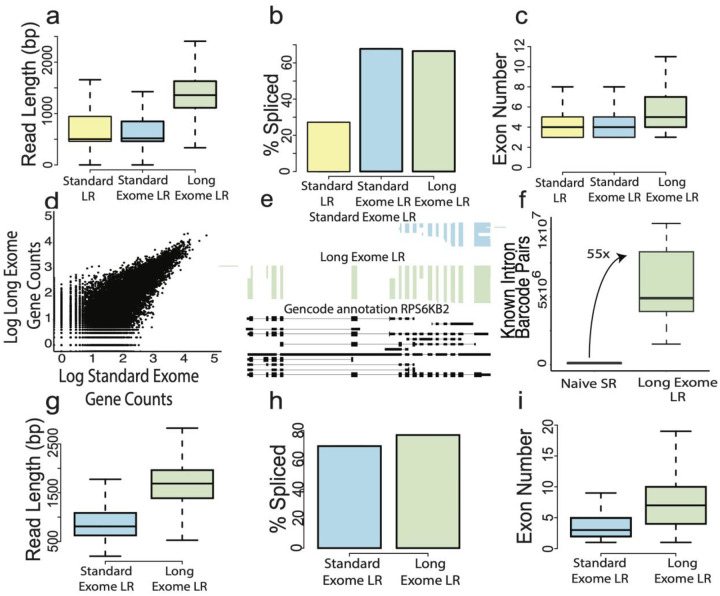
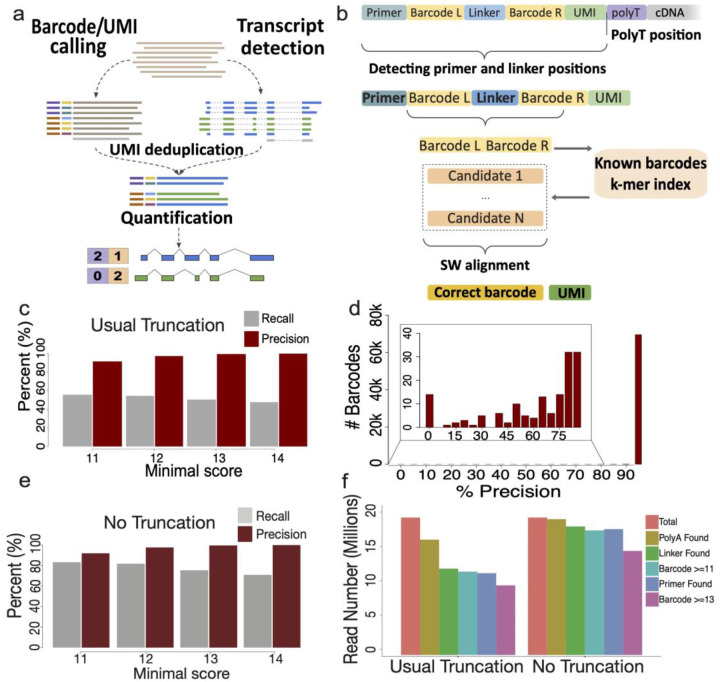
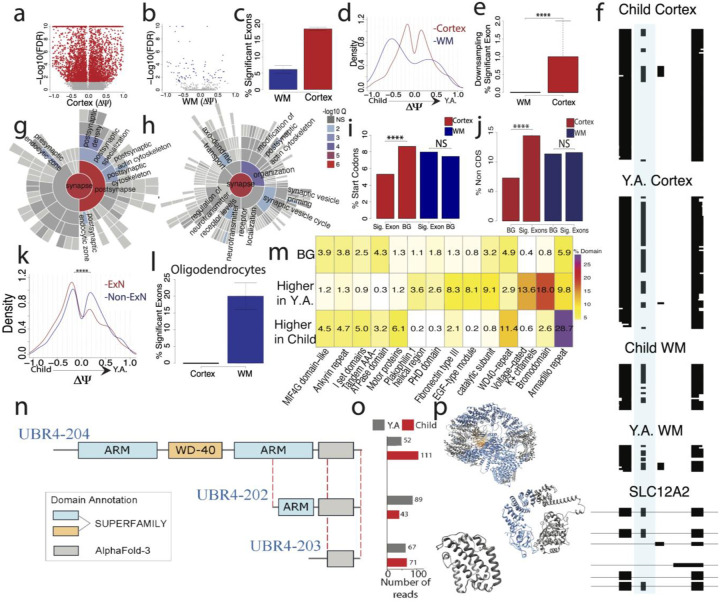
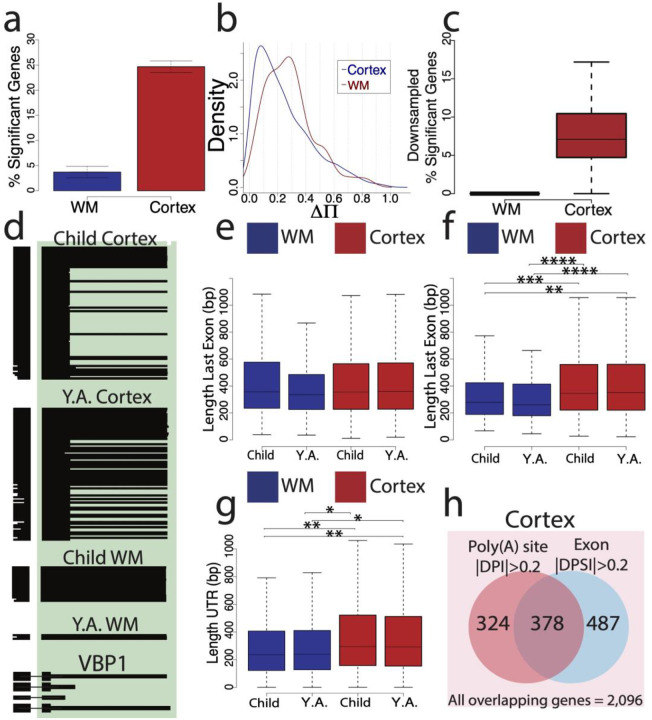
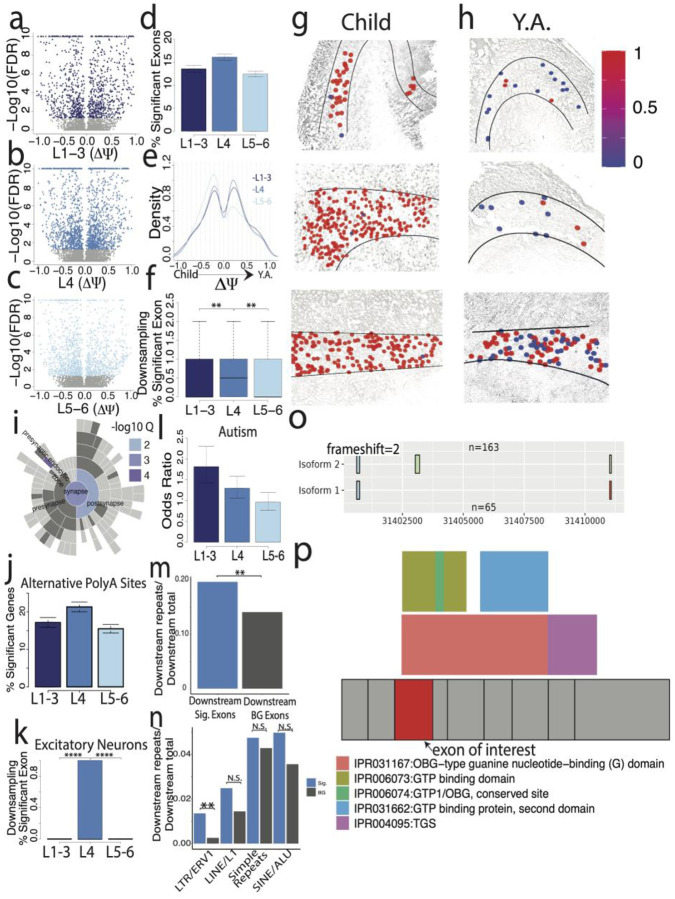
Genome-wide single-cell and spatial long-read approaches have gained traction, but mostly lack single-cell resolution - and yield limited read lengths. Here, we introduce spatial ISOform sequencing (Spl-ISO-Seq), which reveals exons and polyadenylation sites from long reads with near-single-cell resolution. Spl-ISO-Seq selects long cDNAs and doubles to triples read lengths compared to standard preparations. Adding a highly specific software tool (Spl-ISOquant) and comparing human post-mortem pre-puberty samples of the visual cortex (8-11 years) to post-puberty samples (16-19 years), we find that cortical layers harbor stronger splicing and poly(A)-site regulation than the adjacent white matter, with enrichment of multiple protein-domain types. For oligodendrocytes however, developmental splicing changes are stronger in white matter. Among cortical layers, layer 4 has the most developmental changes in alternative-exon inclusion in excitatory neurons and in poly(A) sites. We also find many repeat elements, especially ERV1 long terminal repeats downstream of developmentally-regulated layer 4 exons. Overall, alternative splicing changes are linked to synapses - specifically at the post-synapse. Age-linked splicing changes in layers 1-3 and 4 are associated with autism spectrum disorder but not with schizophrenia, amyotrophic lateral sclerosis and Alzheimer's disease. These results root developmental splicing changes during puberty and the resulting protein changes in specific layers and cell types. More generally, our new technologies enable new observations for any complex tissue.


Conflict of interest statement

CONFLICTS OF INTEREST H.U.T. has presented at user meetings of 10x Genomics, Oxford Nanopore Technologies, and Pacific Biosciences, which in some cases included payment for travel and accommodations. The other authors declare no competing interests.

Figures

Figure 1.
Figure 1.
a) Experimental overview. Spatially barcoded cDNA is separated into 2 pools: one which is short-read sequenced and used for layer and cell-type deconvolution, and the other which undergoes exome enrichment, long-molecule selection, and is long-read sequenced. The two sets of data are then combined to examine layer and cell-type specific developmental splicing changes. b) UMI count per spot plotted by spatial location on sample 1115. c) Hematoxylin and Eosin stain on 10 uM thick slice of tissue following experimental section of sample 1115 with approximate area captured in black square. Scale bar indicates 1mm. d) RCTD defined singlets plotted by cell type and spatial location. Cell types include excitatory neurons, inhibitory neurons, oligodendrocytes (Oligo.), astrocytes, microglia (MG), oligodendrocyte precursor cells (OPC), vascular endothelial cells (VENC), fibroblasts (FB), and T cells (TC). e) Number of singlets across layers (L1–6) and white matter (WM) for all samples combined. f) KEGG enrichment of gene expression differences from short-read data when grouping by age groups, child (8–11) and young adult (16–19). g) KEGG enrichment
Figure 2.
Figure 2.
a) Read length of 100,000 long reads randomly sampled from each spatial dataset (n=2). Standard: cDNA from standard protocol prior to tagmentation; Standard Exome: cDNA from standard protocol which is enriched for exonic reads; Long Exome: cDNA from standard protocol which is enriched for exonic reads and longest molecules. b) Percent of spliced molecules from each group. c) Number of exons per read in barcoded, mapped, and spliced reads. d) Correlation of counts per gene of a Standard Exome dataset compared to the Long Exome dataset from the same spatial slide (n=1). Counts are log10 transformed. e) ScisorWiz plot of the gene RPS6KB2. Each horizontal line is a sequenced read from each respective dataset which come from the same slide. Gencode annotated transcripts are plotted in black. f) Total number of intron-barcode pairs from naive Illumina sequencing compared to Long Exome sequencing from all samples (n=8). g) Read length of 10,000 reads randomly sampled from each single-cell dataset (n=1). h) Percent of spliced molecules per group. i) Number of exons per read in barcoded, mapped, and spliced reads.
Figure 3.
Figure 3.
a) Outline of Spl-IsoQuant algorithm. b) Barcode calling and UMI determination in Spl-IsoQuant. c) Precision and recall as a function of minimal scores overall in Spl-IsoQuant with truncation which is representative of ONT data. d) Precision for individual barcodes. e) Precision and recall as a function of minimal scores overall in Spl-IsoQuant with no truncation. f) Number of reads found by Spl-IsoQuant to meet criteria cutoffs separated by reads modeled with usual truncation and no truncation.
Figure 4.
Figure 4.
a) Exons tested between ages in cortex by deltaPSI (YA-Child) and -log10(FDR). Red points are significant exons and grey points are non-significant. b) Exons tested between ages in WM by deltaPSI and -log10(FDR). Blue points are significant exons and grey points are non-significant. c) Percent significant of tested exons and |deltaPSI| >=0.2 for cortex and WM. d) deltaPSI density of significant exons for cortex and WM. e) Percent significant exons from downsampling experiments. Exon selection and percent significant calculations are repeated 100x and plotted. f) ScisorWiz plot of exon chr5_128177105_128177152_+ in SLC12A2 gene. g) SynGO location enrichment of significant cortex genes. h) SynGO function enrichment of significant cortex genes. i) Percent of exons associated with start codons between highly significant and a background set of exons. (j) Percent of non-CDS exons between highly significant and a background set of exons. k) deltaPSI density of significant exons of excitatory neurons and non-excitatory neurons. l) Percent significant of tested exons and |deltaPSI| >=0.2 for cortex and WM in Oligodendrocytes. m) Enrichment of protein domains in cortex highly significant alternative exons (|deltaPSI| > .5 and FDR <.05). n) Diagram of 3 transcripts of the multidomain protein UBR4 which affect its domain architecture. Transcripts contain 2 Armadillo repeats (ARM) and 1 WD-40 domain (UBR4–204), 1 shorter ARM repeat only (UBR4–202), or neither domain types (UBR4–203). o) Number of spliced and barcoded reads assigned to each transcript separated by Y.A. and Child. p) AlphaFold3 predictions of protein structure; blue = ARM repeats and yellow = WD-40.
Figure 5.
Figure 5.
a) Percent significant genes with differential polyA sites. b) PolyA deltaPI density in cortex and WM. c) Downsampling experiments which equally sampled from individuals equally and selected 20 reads and 50 genes randomly. Genes were resampled 100x and calculated percent significant per iteration. d) ScisorWiz example of alternative polyA site in the VBP1 gene. e) Average length of last exons per tested genes with |deltaPI| <0.2 compared across regions and age groups. f) Average length of last exons per genes with |deltaPI| >0.2 compared across regions age groups. WM is colored in blue and Cortex is colored in red. g) Average length of UTR per genes with |deltaPI| >0.2 compared across regions age groups. h) Overview of all cortical overlapping genes that were tested in both Poly(A) and exon tests (n=2,096). Genes were classified as only having |deltPI| > 0.2, only having a |deltaPSI|>0.2, or both.
Figure 6.
Figure 6.
a) Exons tested between ages in L1–3 by deltaPSI (Y.A.-Child) and -log10(FDR). Colored points are significant exons and grey points are non-significant. b) Exons tested between ages in L4 by deltaPSI and -log10(FDR). Colored points are significant exons and grey points are non-significant. c) Exons tested between ages in L5–6 by deltaPSI and -log10(FDR). Colored points are significant exons and grey points are non-significant. d) Percent significant of tested exons and |deltaPSI| >=0.2 for L1–3, L4, and L5–6. e) deltaPSI density of significant exons for L1–3, L4 and L5–6. f) Percent significant exons from downsampling experiments. Exon selection and percent significant calculations are repeated 100x and plotted. g) Exon chr12_85027899_85028023_- in the TSPAN19 gene plotted by area in 3 child samples. h) Exon chr12_85027899_85028023_- in the TSPAN19 gene plotted by area in 3 Y.A. samples. i) SynGO location enrichment of significant L4 genes. j) Percent significant genes with alternative polyA sites by layer. k) Downsampling of excitatory neuron specific reads and genes. l) Odds ratio comparing significant group v background group of autism associated genes. m) Ratio of sequences with repetitive elements found to total number of sequences per group. Sig: Sequences found upstream of exons with |deltaPSI| > 0.5 and FDR < .05. BG: Sequences found upstream of exons with |deltaPSI| < 0.05 and FDR > .05. n) Ratio of sequences with repetitive elements found to total number of sequences per group, broken down by repetitive element. o) RiboSplitter plotted example of an exon skipping event in the DRG1 gene. Blue squares indicate constitutive exons, green square indicate alternative exon. “n” indicates number of reads in each isoform. p) DRG1 gene plotted where exons are denoted in grey squares. Colored boxes indicate protein domains and their locations relative to exons.

Similar articles

References

    1. Harrow J. et al. GENCODE: producing a reference annotation for ENCODE. Genome Biology 7, S4 (2006). - PMC - PubMed
    1. Johnson J. M. et al. Genome-wide survey of human alternative pre-mRNA splicing with exon junction microarrays. Science 302, 2141–2144 (2003). - PubMed
    1. Wang E. T. et al. Alternative isoform regulation in human tissue transcriptomes. Nature 456, 470–476 (2008). - PMC - PubMed
    1. Pan Q., Shai O., Lee L. J., Frey B. J. & Blencowe B. J. Deep surveying of alternative splicing complexity in the human transcriptome by high-throughput sequencing. Nat Genet 40, 1413–1415 (2008). - PubMed
    1. Furlanis E. & Scheiffele P. Regulation of Neuronal Differentiation, Function, and Plasticity by Alternative Splicing. Annu Rev Cell Dev Biol 34, 451–469 (2018). - PMC - PubMed

Publication types

LinkOut - more resources