[Preprint]. 2025 Jun 8:2025.06.05.658127.
doi: 10.1101/2025.06.05.658127.

ProGuide: a flexible framework for modeling global conformational rearrangements in proteins using DEER-derived distance restraints

Affiliations

ProGuide: a flexible framework for modeling global conformational rearrangements in proteins using DEER-derived distance restraints

Julian D Grosskopf et al. bioRxiv. .

Abstract

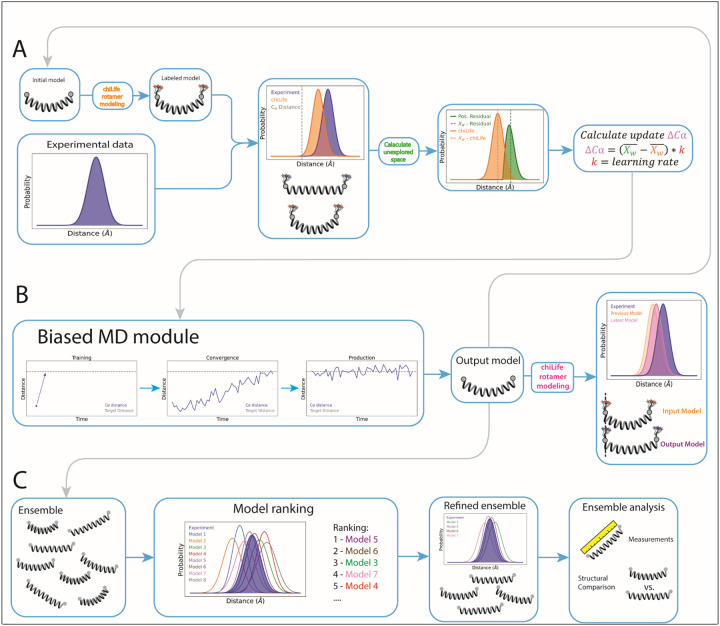
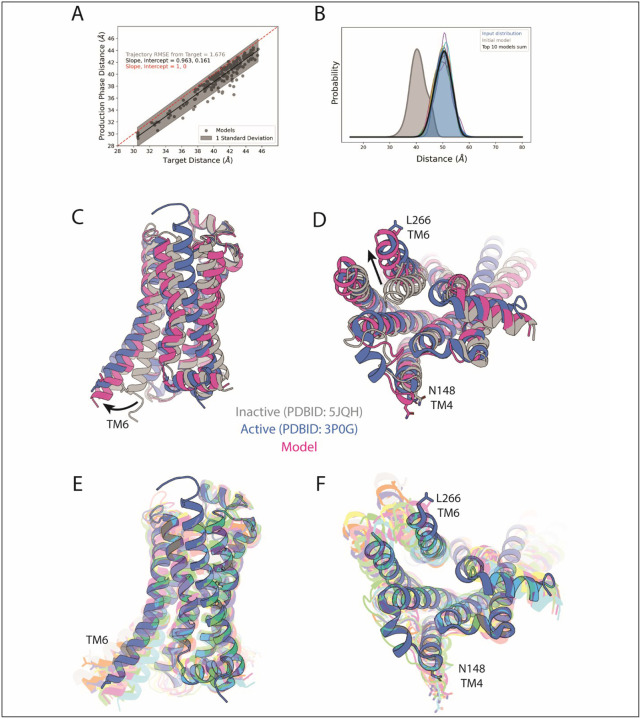
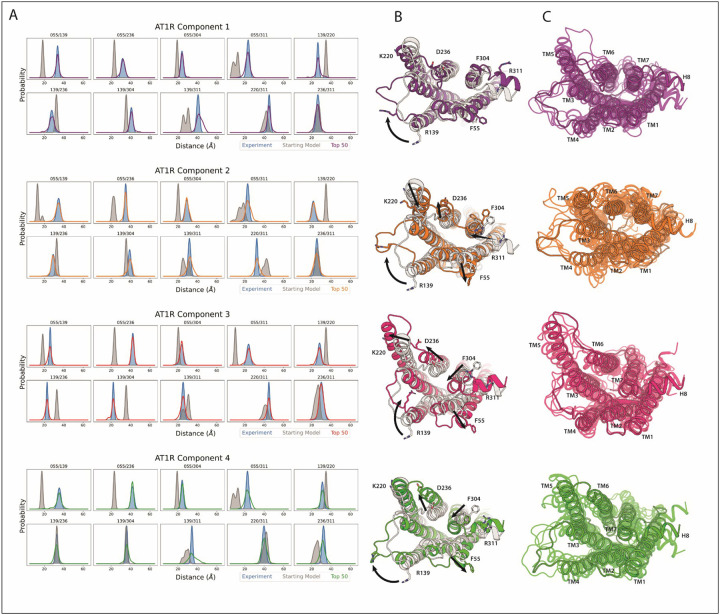
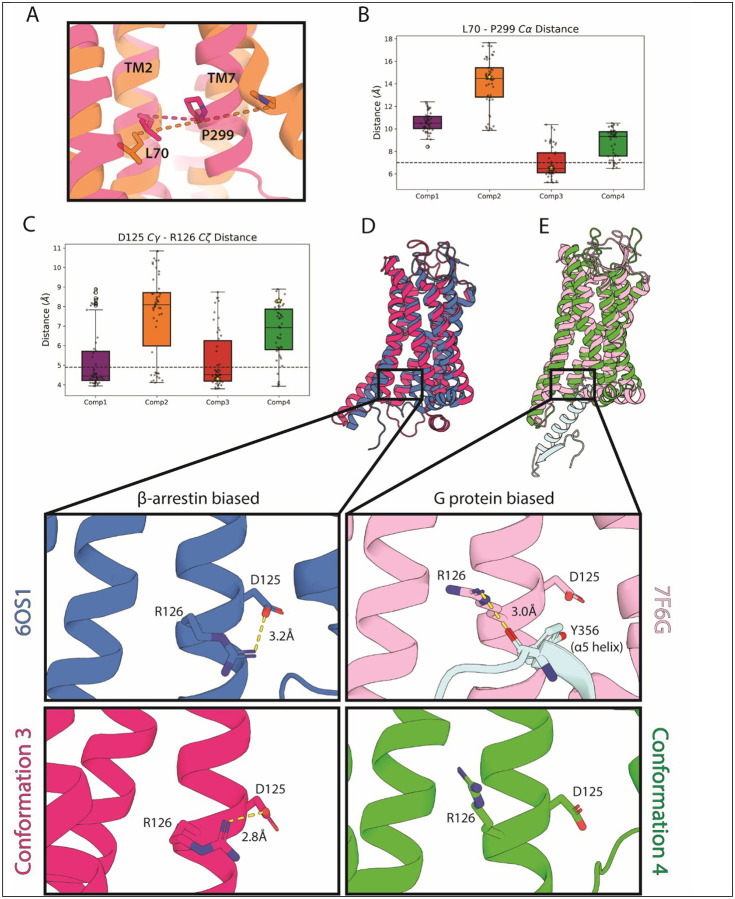
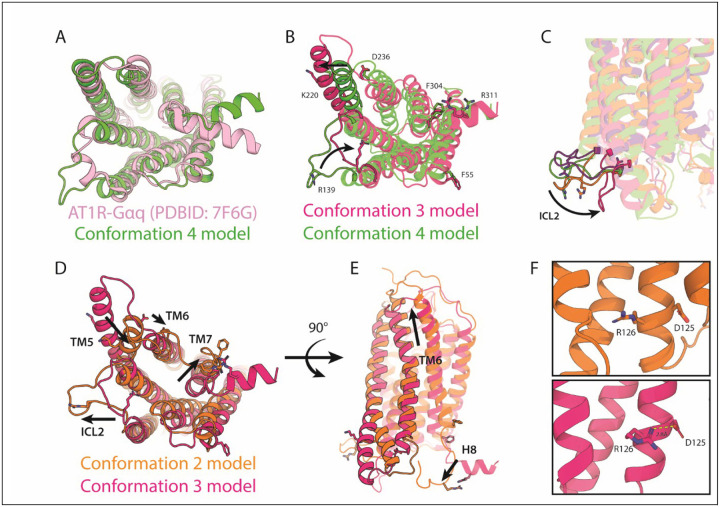
Conformational heterogeneity is integral to protein function - ranging from enzyme catalysis to signal transduction - and visualizing distinct conformational states requires experimental techniques capable of providing such structural information. One particularly powerful method, double electron-electron resonance (DEER) spectroscopy, can provide a high-resolution, long-range (~15-80 Å) probability distributions of distances between site-selected pairs of spin labels to resolve intra-protein distance parameters of unique protein conformations, as well as their respective likelihoods within a conformational ensemble. A current frontier in the field of DEER spectroscopy is utilizing this distance information in computational modeling to generate complete structural models of these multiple conformations. Although several methods have been developed for this purpose, modeling protein backbone structural rearrangements using multiple distance restraints remains challenging, due in part to the complexity provided by rotameric flexibility of the spin label side chain. Here, we overcome these challenges with ProGuide, a new framework for generating accurate structural models guided by DEER distance distribution information. Large conformational rearrangements are captured by performing iterative experimentally biased molecular dynamics simulations. In each iteration, spin-label rotameric heterogeneity is modeled using chiLife, and then C α changes are calculated to capture distance-probability density present in the experimental DEER distributions and lacking from the modeled one. The resulting models of this process then go through a selection to generate the ensemble that best recapitulates the DEER data. We illustrate the power of this method using published DEER data from a study of biased agonism in the angiotensin II type 1 receptor (AT1R), a prototypical G protein coupled receptor (GPCR). The resulting AT1R models consist of both Gq- and β-arrestin-biased conformations, including a completely novel β-arrestin-biased conformation. These models reveal structural insights involving tertiary structural rearrangements as well as residue-level changes in crucial microswitch motifs. Taken together, the results demonstrate the power and flexibility of ProGuide to investigate conformational rearrangements of large, complex proteins using DEER-derived distance restraints.


Figures

Figure 1:
Figure 1:
Label sites and spin-label rotameric heterogeneity. A) and B) show the β2AR viewed from the membrane plane and the cytoplasmic surface, respectively, with the spin label site Cα atoms shown as orange spheres. C) and D) show the AT1R viewed from the membrane plane and the cytoplasmic surface, respectively, with the spin label site Cα atoms shown as orange spheres. E) demonstrates a superimposed rendering of IAP rotamers (green) modeled on to the β2AR (grey cartoon, PDB ID: 3SN6, loops modelled in), shown from the cytoplasmic face. Transparent clouds represent the nitroxide N-O atoms where the free radical is trapped, which ultimately serves as the point of measurement in DEER spectroscopy. Orange spheres represent the Cα atoms that harbor the spin label, with an orange dashed line signifying the distance between Cα atoms. F) shows a magnified view of the IAP spin label, with a single rotamer highlighted. G) illustrates a graph of the IAP nitroxide distribution (green) and distance between Cα atoms that harbor the IAP spin label (orange dotted line).
Figure 2:
Figure 2:
Schematic of ProGuide. A) Update block. This block calculates an incremental update to the Cα distance between the two spin-labeled residues. First, an input model and experimental data are fed into ProGuide. Using chiLife, the simulated distribution between the two spin-labeled residues is calculated from the coordinates of the input model (orange distribution). The simulated distribution is compared with the experimental data and the unexplored space of the experimental distribution is calculated by subtracting the simulated distribution from the experimental data and keeping only the positive residuals (green). An update to the Cα distance is then calculated (see methods) and applied to the next block in the framework. B) biased MD block. This block receives the updated Cα distance and performs biased MD in 3 phases: training phase calculates a linear bias potential to drive the necessary change; convergence phase applies the bias potential to the system and ends once the distance between Cα atoms in the simulation is within a certain cut off (typically 1-2 Å); production phase allows the system to relax around this bias potential for some amount of time. Using chiLife, the last frame of the production phase is then used to simulate the spin-label distribution that this model provides. An example of the simulated distribution from the output model compared to the input model and experimental data is shown. The output model is then fed back into the update block to calculate a new update to the Cα distance, as well as fed into the final block. C) Model ranking and analysis block. The ensemble of output models is reweighted (the component models can also be ranked) to generate spin label rotamer set/distribution that best overlays with the experimental data. The top n model coordinates can be output for further structural and statistical analysis.
Figure 3:
Figure 3:
Modelling the outward active conformation of TM6 in the β2AR using a single IAP spin label pair at 148/266. A) Target Cα distance of the biased MD simulations vs. the Cα distance of the trajectory average of each modelling iteration. Data points (grey dots) are fit to a line (black) with one standard deviation in the fitting parameters (grey shade). A perfectly matched correlation between the trajectory average and the target distance would yield a line with slope 1 and intercept 0, modelled as a red line. B) Graph of the simulated chiLife distribution of the initial model (grey), the experimental data (blue), the simulated distributions of the top 10 models (multi-colored lines), and the sum of the top 10 models (black line). All distributions are area normalized. C-F) Cartoon representations of the starting model (grey), active crystal structure of the β2AR (PDB ID: 3P0G), a representative model (magenta) from the top 10 models, and the top ten models shown as transparent cartoons (multi-colored). Residues N148 (TM4) and L266 are shown as sticks. Intracellular loop (ICL) 3 has been truncated in all models shown here for visual purposes.
Figure 4:
Figure 4:
Results from modelling NMF components of the AT1R from the data in Wingler et al. 2019. A) Graphs depicting the NMF conformation/input data (blue) vs. the sum of the simulated spin label distributions of the top 50 models (colored). Starting model simulated distributions are represented in grey. B) Representative AT1R conformational models (color) overlayed with the starting model generated from an unbiased MD equilibration of the antagonist bound AT1R structure (PDB ID: 4YAY). Each model was selected from the top 5 models ranked by their closeness to the NMF component data. Label sites are shown as their native residues represented by sticks. Arrows indicate major structural changes observed in the overlayed structures. C) Ensemble of the top 5 models in each NMF conformation. Models highlighted with a black silhouette are the models representing the conformational components in panel B.
Figure 5:
Figure 5:
Model and motif analysis of the AT1R models generated from NMF components. A) PCA of AT1R model backbone atom coordinates and B) AT1R model label site Cα atom coordinates (lower). C-E) Comparison of the conformation 1 model to conformation 2 (C), conformation 3 (D), and conformation 4 (E). Models are shown as cartoons, native label site residues are shown as sticks, and relevant conformational rearrangements are highlighted with a black arrow.
Figure 6:
Figure 6:
Models show NPxxY and DRY motif changes consistent with published X-ray crystallography and cryo-EM structures. A) L70-P299 Cα atom distance as a monitor of NPxxY movement of the AT1R models. Representative models of conformations 2 (orange) and 3 (green) are shown as cartoons, and the distance between the Cα atoms are highlighted by dashed lines. B) Box and whisker plot for L70-P299 Cα atom distance of models generated in each conformation. The median value is indicated by the center line and lower and upper bounds indicate the first and third quartile values. Upper and lower bounds of the whiskers indicate the furthest datapoint lying within −1.5 IQR and +1.5 IQR, respectively. Black dots represent data points, open circles represent outliers, and the stars are the values of the models in panel A. The black dashed line at 7Å represents the upper limited considered for β-arrestin-biased conformations of the NPXXY measured by L70-P299 distance. C) Box and whisker plot of the distance between D125 Cγ and R126 Cζ of the DRY motif for the models in each conformation. The median value is indicated by the center line and lower and upper bounds indicate the first and third quartile values. Upper and lower bounds of the whiskers indicate the furthest datapoint lying within −1.5 IQR and +1.5 IQR, respectively. Black dots represent data points, open circles represent outliers, and the stars are the values of the models in panels D and E. The black dotted line is the distance between D125 Cγ and R126 Cζ atoms of 6OS1. D) Overlay of the TRV023 (β-arrestin-biased ligand) bound AT1R X-ray crystal structure (PDBID: 6OS1) with a representative model of conformation 3. Blow up panels show the DRY motif of each structure/model. A salt bridge interaction between D125 and R126 is shown by the yellow dashed line. E) Overlay of the AT1R-Gq complex bound to Sar1-AngII (PDBID: 7F6G) with a representative model of conformation 4. The α5 helix of the Gq protein is shown in pale cyan. The upper panel shows R126 of the AT1R interacting with Y356 of the Gq α5 helix, shown by a yellow dashed line.
Figure 7:
Figure 7:
Comparison of highly relevant conformational rearrangements between models and comparison with previous cryo-EM structures. A) Comparison from the cytoplasmic surface of Gq biased conformation 4 with the cryo-EM structure AT1R-Gαq complex (PDB ID: 7F6G, Gαq removed for clarity). B) Comparison from the cytoplasmic surface of conformational rearrangements (black arrow) of β-arrestin biased conformation 3 (magenta) and Gq biased conformation 4 (green). C) A view from the membrane plane showing the inward conformational rearrangement in ICL2 of conformation 3 compared to the other conformational models. D) Comparison of β arrestin biased models derived from conformation 2 (orange) and conformation 3 (magenta) from the cytoplasmic surface. Helical rearrangements from conformation 3 model to the conformation 2 model are shown by arrows. E) Comparison of β arrestin biased models derived from conformation 2 (orange) and conformation 3 (magenta) from the membrane plane. Helical rearrangements from conformation 3 model to the conformation 2 model are shown by arrows. F) DRY configurations showing an open configuration for the conformation 2 model (orange, top) and a closed configuration for the conformation 3 model (magenta, bottom). The distance between the R126 nitrogen atom and D125 oxygen atom is highlighted by a yellow dashed line.

Similar articles

  • Prescription of Controlled Substances: Benefits and Risks.
    Preuss CV, Kalava A, King KC. Preuss CV, et al. 2025 Jul 6. In: StatPearls [Internet]. Treasure Island (FL): StatPearls Publishing; 2025 Jan–. 2025 Jul 6. In: StatPearls [Internet]. Treasure Island (FL): StatPearls Publishing; 2025 Jan–. PMID: 30726003 Free Books & Documents.
  • Short-Term Memory Impairment.
    Cascella M, Al Khalili Y. Cascella M, et al. 2024 Jun 8. In: StatPearls [Internet]. Treasure Island (FL): StatPearls Publishing; 2025 Jan–. 2024 Jun 8. In: StatPearls [Internet]. Treasure Island (FL): StatPearls Publishing; 2025 Jan–. PMID: 31424720 Free Books & Documents.
  • Electrophoresis.
    Sonagra AD, Zubair M, Dholariya SJ. Sonagra AD, et al. 2025 Jul 14. In: StatPearls [Internet]. Treasure Island (FL): StatPearls Publishing; 2025 Jan–. 2025 Jul 14. In: StatPearls [Internet]. Treasure Island (FL): StatPearls Publishing; 2025 Jan–. PMID: 36251838 Free Books & Documents.
  • Management of urinary stones by experts in stone disease (ESD 2025).
    Papatsoris A, Geavlete B, Radavoi GD, Alameedee M, Almusafer M, Ather MH, Budia A, Cumpanas AA, Kiremi MC, Dellis A, Elhowairis M, Galán-Llopis JA, Geavlete P, Guimerà Garcia J, Isern B, Jinga V, Lopez JM, Mainez JA, Mitsogiannis I, Mora Christian J, Moussa M, Multescu R, Oguz Acar Y, Petkova K, Piñero A, Popov E, Ramos Cebrian M, Rascu S, Siener R, Sountoulides P, Stamatelou K, Syed J, Trinchieri A. Papatsoris A, et al. Arch Ital Urol Androl. 2025 Jun 30;97(2):14085. doi: 10.4081/aiua.2025.14085. Epub 2025 Jun 30. Arch Ital Urol Androl. 2025. PMID: 40583613 Review.
  • Assessing the comparative effects of interventions in COPD: a tutorial on network meta-analysis for clinicians.
    Haeussler K, Ismaila AS, Malmenäs M, Noorduyn SG, Green N, Compton C, Thabane L, Vogelmeier CF, Halpin DMG. Haeussler K, et al. Respir Res. 2024 Dec 21;25(1):438. doi: 10.1186/s12931-024-03056-x. Respir Res. 2024. PMID: 39709425 Free PMC article. Review.

References

    1. Astore MA, Pradhan AS, Thiede EH, Hanson SM. Protein dynamics underlying allosteric regulation. Curr Opin Struct Biol. 2024;84. doi: 10.1016/j.sbi.2023.102768 - DOI - PubMed
    1. Frauenfelder H, Sligar SG, Wolynes PG. The Energy Landscapes and Motions of Proteins. Science (1979). 1991;254:1598–1603. https://www.science.org - PubMed
    1. Henzler-Wildman K, Kern D. Dynamic personalities of proteins. Nature. 2007;450(7172):964–972. doi: 10.1038/nature06522 - DOI - PubMed
    1. Mishra P, Jha SK. The native state conformational heterogeneity in the energy landscape of protein folding. Biophys Chem. 2022;283. doi: 10.1016/j.bpc.2022.106761 - DOI - PubMed
    1. Onuchic JN, Wolynes PG. Theory of protein folding. Curr Opin Struct Biol. 2004;14(1):70–75. doi: 10.1016/j.sbi.2004.01.009 - DOI - PubMed

Publication types

LinkOut - more resources