. 2025 Jul 14;7(7):e70035.
doi: 10.1096/fba.2025-00117. eCollection 2025 Jul.

Matrix Stiffness Regulates TGFβ1-Induced αSMA Expression via a G9a-LATS-YAP Signaling Cascade

Affiliations

Matrix Stiffness Regulates TGFβ1-Induced αSMA Expression via a G9a-LATS-YAP Signaling Cascade

Chinmay S Sankhe et al. FASEB Bioadv. .

Abstract

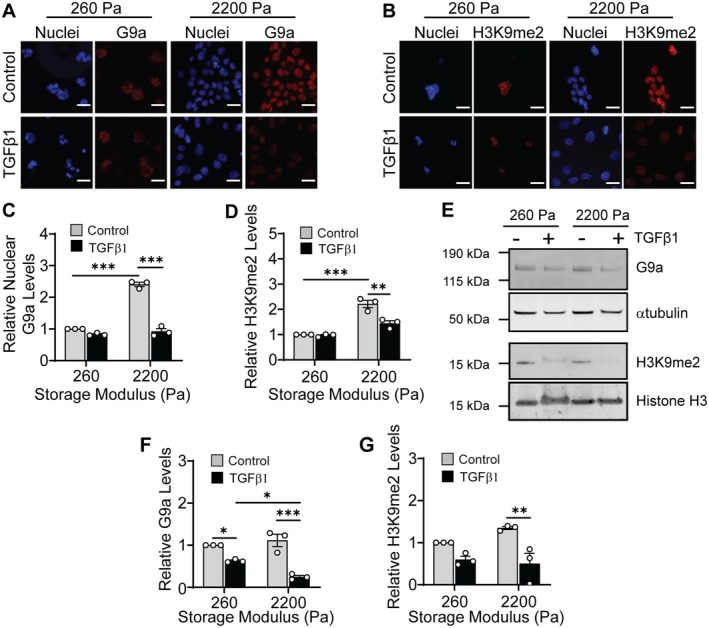
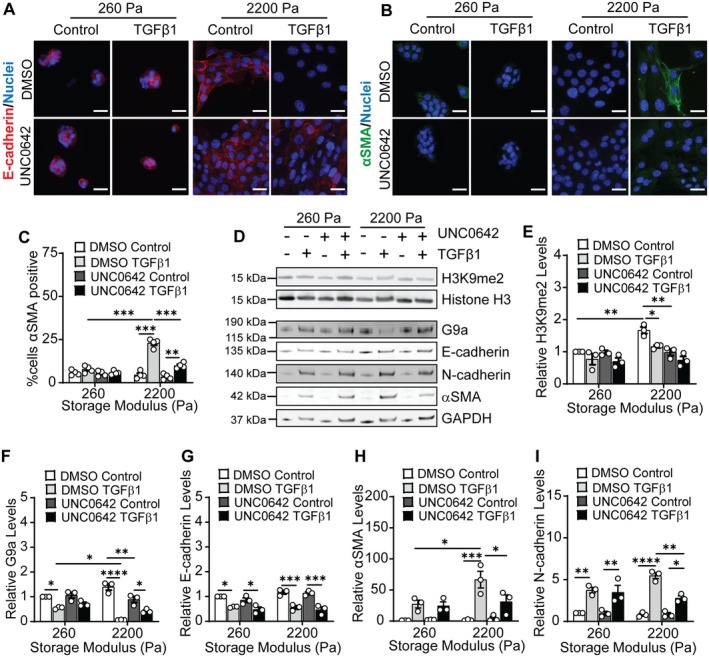
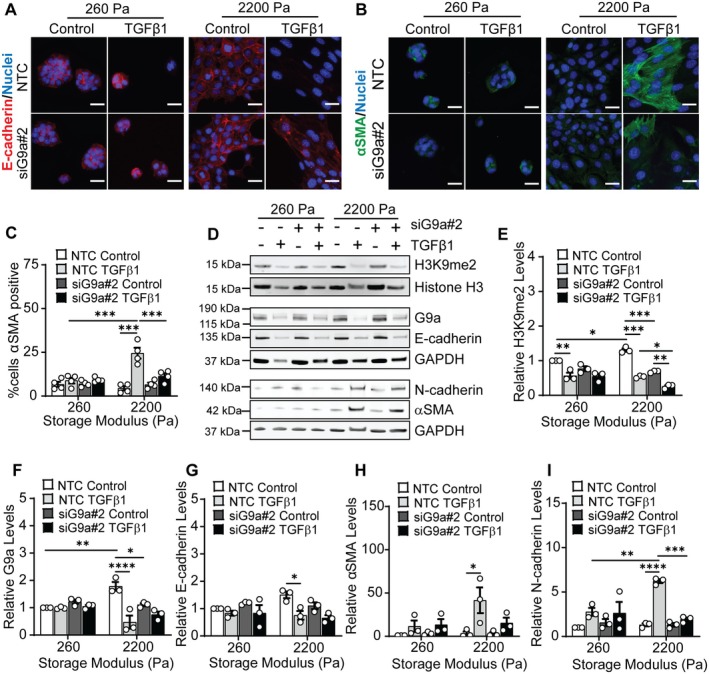
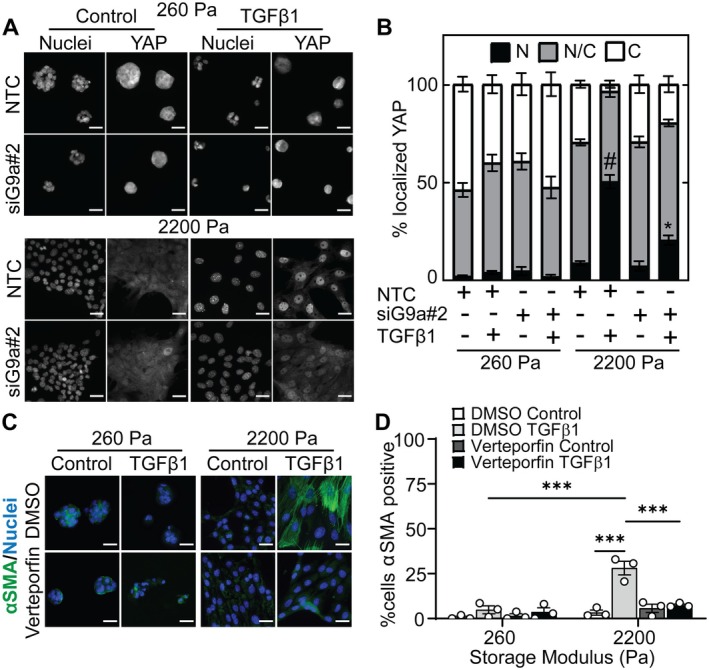
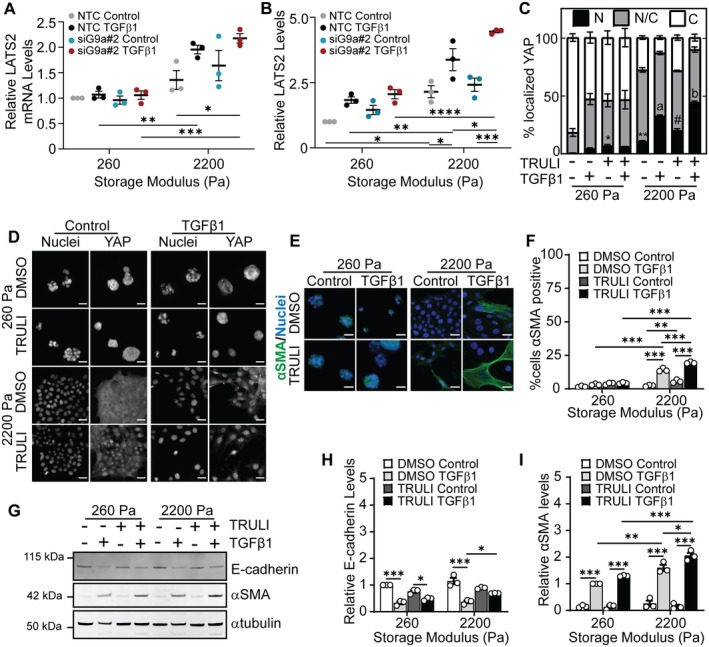
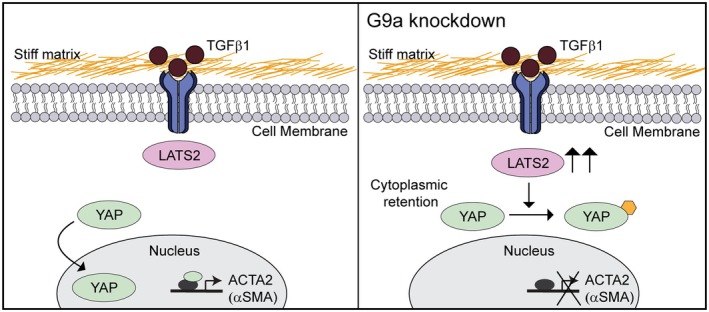
Extracellular matrix stiffness is enhanced in cancer and fibrosis; however, there is limited knowledge on how matrix mechanics modulate expression and signaling of the methyltransferase G9a. Here, we show that matrix stiffness and transforming growth factor (TGF)-β1 signaling together regulate G9a expression and the levels of the histone mark H3K9me2. Suppressing the activity and expression of G9a attenuates TGFβ1-induced alpha smooth muscle actin (αSMA) and N-cadherin expression and cell morphology changes in mammary epithelial cells cultured on stiff substrata. Knockdown of G9a increases the expression of large tumor suppressor kinase 2 (LATS2) and decreases the nuclear localization of yes associated protein (YAP). Furthermore, inhibition of LATS promotes an increase in YAP nuclear localization and αSMA expression, while inhibition of YAP attenuates αSMA expression. Overall, our findings indicate that a G9a-LATS-YAP signaling cascade regulates mammary epithelial cell response to matrix stiffness and TGFβ1.

Keywords: epigenomics; epithelial cells; extracellular matrix; histone methyltransferases; hydrogels; mammary gland.


Conflict of interest statement

The authors declare no conflicts of interest.

Figures

FIGURE 1
FIGURE 1
Matrix stiffness regulates G9a and histone 3 lysine 9 dimethylation in response to TGFβ1. Immunofluorescence staining for (A) G9a and (B) H3K9me2 in NMuMG cells cultured on hydrogels and treated with or without TGFβ1. Scale bars: 25 μm. Quantification of the (C) relative nuclear G9a and (D) relative H3K9me2 levels from immunofluorescence images shown in panels (A) and (B). Data are normalized with respect to the soft hydrogel control sample. (E) Western blot for G9a using whole cell protein extracts and H3K9me2 using histone extracts from NMuMG cells cultured on hydrogels with and without TGFβ1 treatment. Relative quantification via densitometric analysis for (F) G9a and (G) H3K9me2 from blots shown in panel (E). Data are normalized with respect to the soft hydrogel control sample. All data represent mean ± sem for n = 3 independent experiments; *p < 0.05, **p < 0.01, ***p < 0.001.
FIGURE 2
FIGURE 2
Inhibition of G9a activity impacts H3K9 dimethylation levels and EMT in response to TGFβ1 and matrix stiffness. Immunofluorescence staining for (A) E‐cadherin and (B) αSMA for NMuMG cells cultured on hydrogels and treated with DMSO or the G9a inhibitor UNC0642 (10 nM) with and without TGFβ1 treatment. Scale bars: 25 μm. (C) Quantification of αSMA positive NMuMG cells for various treatment conditions from immunofluorescence staining for αSMA. Data represent mean ± sem for n = 4 independent experiments, **p < 0.01, ***p < 0.001. (D) Western blots for H3K9me2, G9a, E‐cadherin, N‐cadherin, and αSMA in NMuMG cells. Densitometric quantification of the relative expression of (E) H3K9me2, (F) G9a, (G) E‐cadherin, (H) αSMA, and (I) N‐cadherin from western blots shown in panel (D). Data are normalized with respect to the soft hydrogel DMSO control sample. Data represent mean ± sem for n = 3 independent experiments; *p < 0.05, **p < 0.01, ***p < 0.001, ****p < 0.0001.
FIGURE 3
FIGURE 3
siRNA knockdown of G9a attenuates TGFβ1‐induced changes in H3K9me2, αSMA, and N‐cadherin levels as a function of matrix stiffness. Immunofluorescence staining for (A) E‐cadherin and (B) αSMA in NMuMG cells transfected with NTC siRNA or siG9a#2 with and without TGFβ1 treatment. Scale bars: 25 μm. (C) Quantification of the percentage of αSMA positive cells for various treatment conditions. Data represent mean ± sem for n = 4 independent experiments, ***p < 0.001. (D) Western blot for H3K9me2, G9a, E‐cadherin, N‐cadherin, and αSMA in NMuMG cells transfected with NTC siRNA or siG9a#2 with and without TGFβ1 treatment. Densitometric quantification of the relative levels of (E) H3K9me2, (F) G9a, (G) E‐cadherin, (H) αSMA, and (I) N‐cadherin from blots shown in panel (D). Data are normalized with respect to the soft NTC siRNA control sample. Data represent mean ± sem for n = 3 independent experiments; *p < 0.05, **p < 0.01, ***p < 0.001, ****p < 0.0001.
FIGURE 4
FIGURE 4
Knockdown of G9a impacts YAP subcellular localization and inhibiting YAP attenuates TGFβ1‐induced αSMA expression and cell morphology changes as a function of matrix stiffness. (A) Immunofluorescence staining for YAP in NMuMG cells transfected with NTC siRNA or siG9a#2 with and without TGFβ1 treatment. Scale bars: 25 μm. (B) Quantification of the percentage of cells with nuclear (N), pancellular (N/C), or cytoplasmic (C) YAP localization under different treatment conditions. Data represent mean ± sem for n = 3; #p < 0.001 with respect to all other samples, *p < 0.05 with respect to the stiff hydrogel siG9a control and soft hydrogel siG9a TGFβ1 samples. (C) Immunofluorescence staining for αSMA in NMuMG cells cultured on hydrogels and treated with DMSO or YAP inhibitor Verteporfin (4 μM) with and without TGFβ1 treatment. Scale bars: 25 μm. (D) Quantification of αSMA positive NMuMG cells cultured on soft and stiff hydrogels and treated with DMSO or Verteporfin in the presence and absence of TGFβ1. Data represent mean ± sem for n = 3 independent experiments; ***p < 0.001.
FIGURE 5
FIGURE 5
G9a regulates LATS kinase which acts upstream of YAP and αSMA. (A) Quantitative real‐time PCR for LATS2 and (B) relative levels of LATS2 quantified from immunofluorescence staining in NMuMG cells cultured on hydrogels with storage moduli of 260 Pa and 2200 Pa and transfected with non‐targeting control siRNA (NTC) or siRNA targeting G9a (siG9a#2) with and without TGFβ1 treatment. Data represent mean ± sem for n = 3 independent experiments; *p < 0.05, **p < 0.01, ***p < 0.001, ****p < 0.0001. (C) Quantification of the percentage of cells with nuclear (N), pancellular (N/C), or cytoplasmic (C) YAP localization in cells following treatment with DMSO or LATS1/2 kinase inhibitor TRULI (15 μM) with and without TGFβ1 treatment. Data represent mean ± sem for n = 3 independent experiments; *p < 0.05, **p < 0.01 with respect to soft DMSO control sample, #p < 0.01 with respect to stiff DMSO control sample, a p < 0.001 with respect to all other samples except stiff TRULI TGFβ1, b p < 0.001 with respect to all other samples. Immunofluorescence staining for (D) YAP and (E) αSMA in NMuMG cells under different treatment conditions. Scale bars: 25 μm. (F) Quantification of αSMA positive NMuMG cells treated with DMSO or TRULI in the presence and absence of TGFβ1. Data represent mean ± sem for n = 3 independent experiments; **p < 0.01, ***p < 0.001. (G) Western blot for E‐cadherin and αSMA in NMuMG cells cultured on hydrogels and treated with DMSO or TRULI with and without treatment with TGFβ1. Densitometric quantification of the relative expression of (H) E‐cadherin and (I) αSMA from western blots shown in panel (G). Data are normalized with respect to the soft DMSO control sample. Data represent mean ± sem for n = 3 independent experiments; *p < 0.05, **p < 0.01, ***p < 0.001.
FIGURE 6
FIGURE 6
Knockdown of G9a promotes an increase in LATS2 expression, cytoplasmic retention of YAP, and a decrease in αSMA expression in TGFβ1‐treated cells cultured on stiff substrata.

Similar articles

References

    1. Martinez‐Vidal L., Murdica V., Venegoni C., et al., “Causal Contributors to Tissue Stiffness and Clinical Relevance in Urology,” Communications Biology 4 (2021): 1011. - PMC - PubMed
    1. Booth A. J., Hadley R., Cornett A. M., et al., “Acellular Normal and Fibrotic Human Lung Matrices as a Culture System for In Vitro Investigation,” American Journal of Respiratory and Critical Care Medicine 186 (2012): 866–876. - PMC - PubMed
    1. Lopez J. I., Kang I., You W.‐K., McDonald D. M., and Weaver V. M., “In Situ Force Mapping of Mammary Gland Transformation,” Integrative Biology (Camb) 3 (2011): 910–921. - PMC - PubMed
    1. Paszek M. J., Zahir N., Johnson K. R., et al., “Tensional Homeostasis and the Malignant Phenotype,” Cancer Cell 8 (2005): 241–254. - PubMed
    1. Sankhe C. S., Sacco J. L., and Gomez E. W., “Biophysical Regulation of TGFβ Signaling in the Tumor Microenvironment,” in Engineering and Physical Approaches to Cancer, ed. Wong I. Y. and Dawson M. R. (Springer International Publishing, 2023), 159–200.

LinkOut - more resources