

Effects of different incremental treadmill exercise protocols on the autonomic nervous system in healthy college students: a comparative study based on heart rate variability analysis
- PMID: 40661664
- PMCID: PMC12256851
- DOI: 10.3389/fphys.2025.1579929
Effects of different incremental treadmill exercise protocols on the autonomic nervous system in healthy college students: a comparative study based on heart rate variability analysis
Abstract
Objectives: This study aimed to examine the acute regulatory effects of three different incremental load treadmill exercise protocols on autonomic nervous system (ANS) function in healthy college students. The ultimate goal was to inform evidence-based training strategies and enhance cardiopulmonary function assessment in this population.
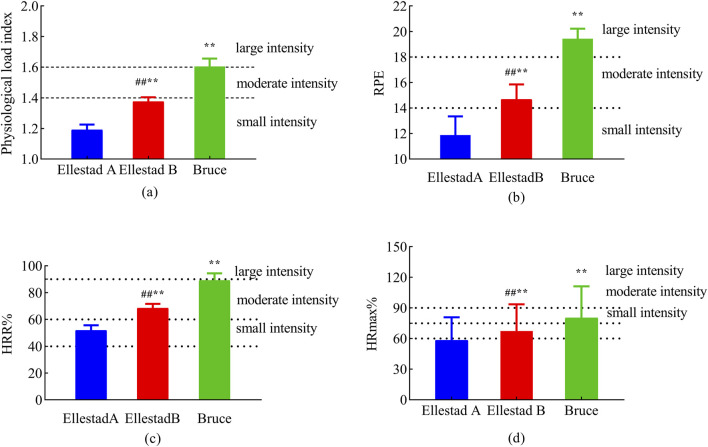
Methods: Forty healthy male college students were recruited to complete three incremental treadmill protocols: Ellestad A, Ellestad B, and Bruce. Participants were equipped with an energy expenditure monitor (GT9-X, ActiLife 1.0), and heart rate (HR) and heart rate variability (HRV) data were recorded at three time points: pre-exercise, immediately post-exercise, and 5 minutes post-exercise. HRV was analyzed using time-domain indices (SDNN, RMSSD, PNN50), frequency-domain indices (LF, HF), and nonlinear metrics derived from Poincaré plots (SD1, SD2), in order to evaluate the impact of exercise intensity on autonomic regulation.
Results: All three protocols resulted in significant reductions in time-domain, frequency-domain, and nonlinear HRV indices compared to pre-exercise baseline values (p < 0.01), indicating marked autonomic suppression. Compared to the immediate post-exercise period, HRV continued to decline following the Ellestad A and B protocols (p < 0.01), while a significant rebound was observed after the Bruce protocol (p < 0.01). Furthermore, the LF/HF ratio progressively increased across the three protocols, revealing a significant main effect of exercise intensity (p < 0.01).
Conclusion: (1) All three incremental treadmill protocols elicited acute HRV alterations, characterized by parasympathetic withdrawal and sympathetic activation, reflecting a transient state of autonomic imbalance; (2) HRV serves as a sensitive physiological marker for detecting exercise-induced fatigue and quantifying training load intensity. Under the Ellestad A and B protocols, heart rate variability (HRV) exhibited a sustained decline throughout the 5-min recovery period, potentially indicating that exercise-induced fatigue load may not have been fully resolved. However, this interpretation warrants further validation through additional objective physiological markers. While the rebound observed after the Bruce protocol may suggest acute autonomic recovery associated with supercompensation and adaptive responses to high-intensity exercise.
Keywords: HRV; Poincaré scatter plot; incremental load; sport intensity; treadmill exercise regimes.
Copyright © 2025 Cao, Li, Zha, Yan, Jia, Luo and Chi.
Conflict of interest statement
The authors declare that the research was conducted in the absence of any commercial or financial relationships that could be construed as a potential conflict of interest.
Figures


Similar articles
-
The Impact on Autonomic Nervous System Activity during and Following Exercise in Adults: A Meta-Regression Study and Trial Sequential Analysis.Medicina (Kaunas). 2024 Jul 28;60(8):1223. doi: 10.3390/medicina60081223. Medicina (Kaunas). 2024. PMID: 39202504 Free PMC article.
-
Do Pain and Autonomic Regulation Share a Common Central Compensatory Pathway? A Meta-Analysis of HRV Metrics in Pain Trials.NeuroSci. 2025 Jul 5;6(3):62. doi: 10.3390/neurosci6030062. NeuroSci. 2025. PMID: 40700127 Free PMC article. Review.
-
Effects of sleep deprivation on heart rate variability: a systematic review and meta-analysis.Front Neurol. 2025 Aug 14;16:1556784. doi: 10.3389/fneur.2025.1556784. eCollection 2025. Front Neurol. 2025. PMID: 40895095 Free PMC article.
-
Monitoring Athletic Training Status Through Autonomic Heart Rate Regulation: A Systematic Review and Meta-Analysis.Sports Med. 2016 Oct;46(10):1461-86. doi: 10.1007/s40279-016-0484-2. Sports Med. 2016. PMID: 26888648
-
HRV and blood parameters for assessing the physiological functioning of cyclists during long-distance rides across different altitudes.Front Physiol. 2025 Jun 17;16:1559417. doi: 10.3389/fphys.2025.1559417. eCollection 2025. Front Physiol. 2025. PMID: 40600123 Free PMC article.
References
-
- Aguinis H., Gottfredson R. K., Culpepper S. A. (2013). Best-practice recommendations for estimating cross-level interaction effects using multilevel modeling. J. Manag. 39 (6), 1490–1528. 10.1177/0149206313478188 - DOI
LinkOut - more resources
Full Text Sources
Research Materials
Miscellaneous