. 2025 Jul 9:18:1683-1702.
doi: 10.2147/CCID.S523936. eCollection 2025.

Effects of Exosomes From Hypoxia-Induced Adipose-Derived Stem Cells on Ameliorating Photoaging

Affiliations

Effects of Exosomes From Hypoxia-Induced Adipose-Derived Stem Cells on Ameliorating Photoaging

Cuc Bach Huynh et al. Clin Cosmet Investig Dermatol. .

Abstract

Introduction: Photoaging, a significant concern in cosmetic dermatology, involves complex skin damage that necessitates effective treatments. Exosomes derived from adipose-derived stem cells (ADSCs), particularly those generated under hypoxic conditions (hypADSC-Exo), have emerged as a promising cell-free therapeutic approach. This study investigates the effects of hypADSC-Exo on reducing human dermal fibroblast (HDF) senescence and mitigating signs of photoaging through topical application in a mouse model.

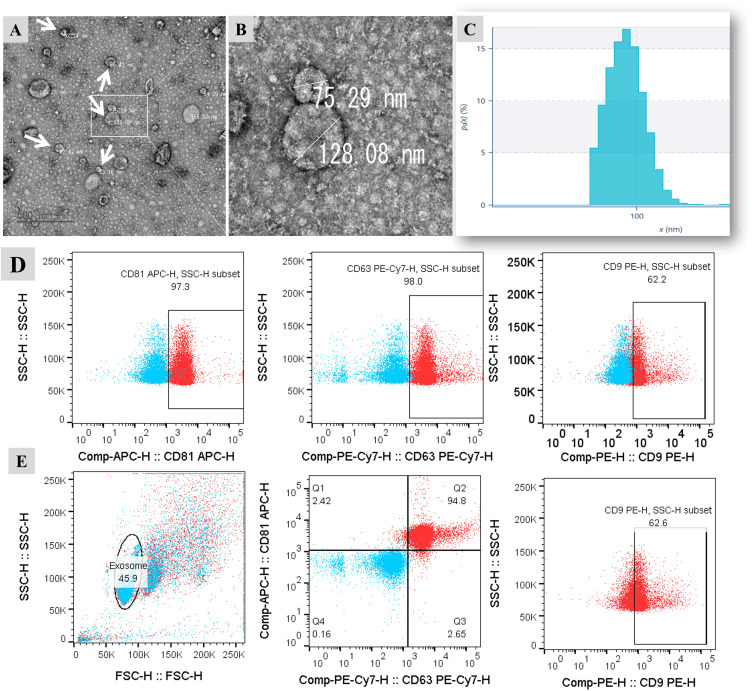
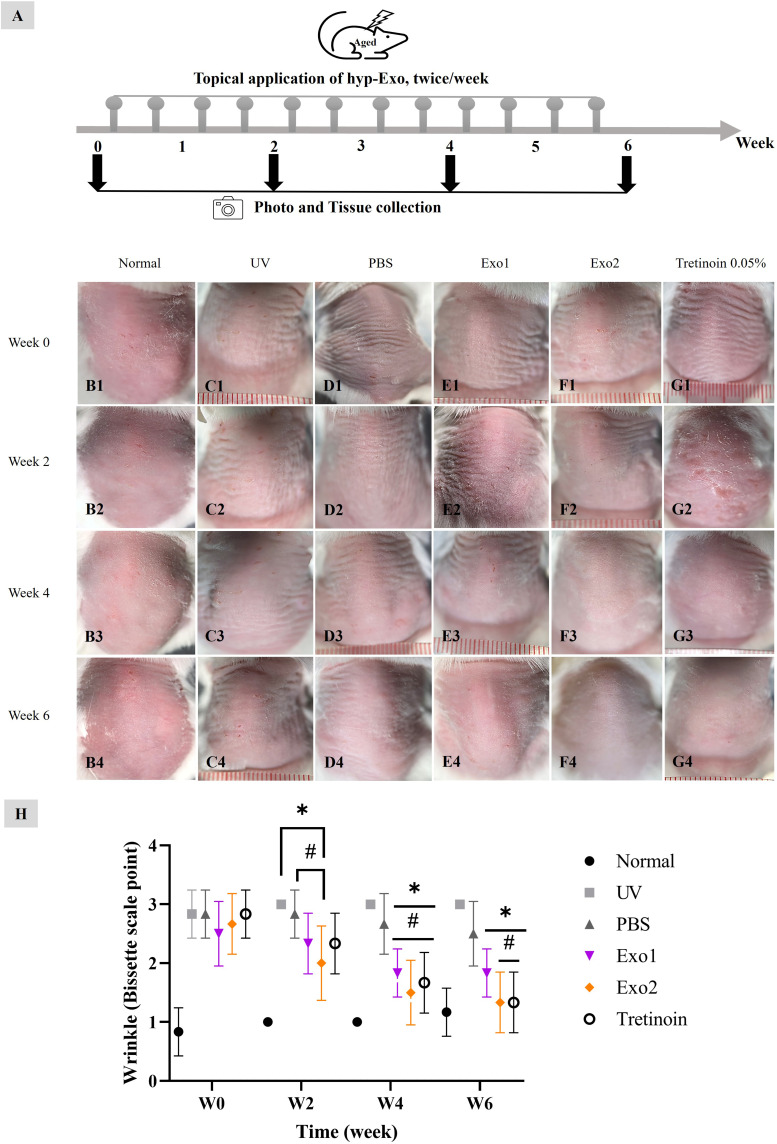
Methods: Exosomes were isolated from hypoxia-induced human ADSCs via ultracentrifugation and identified using flow cytometry (CD9, CD63, CD81). Transmission electron microscopy (TEM) confirmed the vesicle morphology, while the Bradford assay and nanoparticle tracking analysis (NTA) assessed the protein content and size. In vitro, UV-induced senescent HDFs were treated with hypADSC-Exo. Cell morphology, senescence (SA-β-gal assay), proliferation (Alamar Blue), and gene expression (p16, p21 via qPCR) were evaluated. In vivo, photoaged mice received hypADSC-Exo treatments (50 or 100 μg/mL) twice weekly for six weeks. Skin parameters (wrinkles, thickness, hydration, elasticity) were evaluated biweekly. Skin biopsies were used to assess epidermal and dermal thickness, collagen density, and gene expression of collagen types 1, 3 and MMP-1, 2, and 3.

Results: hypADSC-Exo exhibited a cup-shaped morphology under TEM and expressed exosomal markers CD9, CD63, and CD81. In vitro, hypADSC-Exo improved HDF morphology, reduced SA-β-gal activity, enhanced proliferation, and downregulated p16 and p21. In vivo, it reduced skin wrinkles and thickness. Treated mice exhibited improvement in hydration, elasticity, decreased epidermal and dermal thickness, and increased collagen density. Collagen types 1 and 3 increased slightly, while the levels of MMP-1, 2, and 3 decreased in the exosome group.

Conclusion: Our findings demonstrate that hypADSC-Exo reduces senescence in UV-induced aged HDF and improves photoaging in mice. These effects likely result from decreased MMP-1, 2, 3 expression and increased collagen deposition, making hypADSC-Exo a promising therapy for photoaging.

Keywords: adipose-derived stem cell; hypoxic exosome; photoaging; senescent dermal fibroblast.


Conflict of interest statement

The authors declare no competing interests, financial or otherwise, associated with this publication.

Figures

Figure 1
Figure 1
Characterization of hypADSC-Exo. The morphology and size of hypADSC-Exo under the TEM (A and B). Nanoparticle tracking analysis (NTA) assessed the size and density of the exosomes (C). Flow cytometry analysis for CD9, CD63, and CD81 exosomal markers (D and E). Characterization of hypADSC-Exo data represents a single technical replicate from two independent samples.
Figure 2
Figure 2
Effects of hypADSC-Exo on HDF morphology and size alteration. Normal 4th passage HDFs at 0 h and 72 h (A1 and A2). UV-induced senescent HDFs at 0 h and 72 h (B1 and B2). Changes of HDF appearance at 0 h, 24 h, 48 h, and 72 h after treatment in the UV+PBS group (C1C4) and UV+Exo group (D1D4). Representative images of two individual experiments. Scale bar = 50 μm. The cell size of the UV+PBS group and UV+Exo group after treatment at 0 h, 24 h, 48 h, and 72 h, compared with normal cells (E). Graph of cell size changes between different groups (n=2). Two biological samples, each with sixteen cells, were used. The averages from one experiment of each group are coded in dark blue dots, red squares, and green triangles, whereas individual cell size from a single experimental run is coded in light color in the background. Data are presented as mean (SD); *p<0.05, UV+PBS versus (vs) UV+Exo group, calculated using two-way ANOVA with Turkey’s post-test (F).
Figure 3
Figure 3
Effects of hypADSC-Exo on HDFs senescent phenotype and function. SA-β-galactosidase activity in senescent HDFs treated with PBS (A1A4) and hypADSC-Exo (B1B4) at different time points, representative images of three independent experiments, scale bar = 100 μm. Representative images of SA-β-gal staining in HDFs from the normal group (B5) and the UV-induced senescence group (B6). SA-β-galactosidase signals intensity analyzed by Image J (n=3, *p<0.05, vs normal group; #p<0.05, vs UV+PBS group). Data are presented as mean (SD), calculated using two-way ANOVA with Turkey’s post-test. Three biological replicates, each with two technical replicates, were used (C). Cell proliferation was assessed at different time points using Alamar blue staining (n=2; *p<0.05, vs normal group). Data are presented as mean (SD), calculated using two-way ANOVA with Turkey’s post-test. Two biological replicates, each with three technical replicates, were used (D). mRNA expression of p16 and p21 were determined by RT-qPCR at 48 h (n=5; *p<0.05, vs normal group; #p<0.05, UV+PBS vs UV+Exo group). Data are presented as mean (SEM), calculated using the Mann–Whitney test. Five biological replicates, each with a single technical replicate, were used (E).
Figure 4
Figure 4
Effects of hypADSC-Exo on the skin appearance of photoaged mice. Schematic representation and timeline of the experiment (A); Changes in the skin surface appearance of normal mice at different time points (B1B4); UV-induced photoaged mice (C1C4); PBS-treated mice (D1D4); Exo1-treated group (hypADSC-Exo 50 μg/mL) (E1E4); Exo2-treated group (hypADSC-Exo 100 μg/mL) (F1F4); Tretinoin 0.05%-treated group (G1G4); Wrinkle scores assessed using the Bissett scale across different groups and time points (n=6; *p<0.05, vs UV group; #p<0.05, vs PBS group) (H). Data are presented as mean (SD), calculated using repeated two-way ANOVA with Turkey’s post test. Six biological replicates, each with three technical replicates, were used. W, week.
Figure 5
Figure 5
Effects of hypADSC-Exo on skin structure and barrier function of photoaged mice. Skin hydration levels of multiple groups measured by Corneometer device (n=6; *p<0.05, vs UV group, ns: not significant) (A). Skinfold thickness changes at different time points (n=6; *p<0.05, vs UV group; #p<0.05, vs PBS group) (B). Skin elasticity detected by pinch test of multiple groups (n=6; *p<0.05, vs UV group; #p<0.05, vs PBS group) (C). Data are presented as mean (SD), calculated using repeated two-way ANOVA with Turkey’s post test. Six biological replicates, each with three technical replicates, were used. W, week.
Figure 6
Figure 6
Effects of hypADSC-Exo on the pathological impairments of photoaging skin. Representative photograph of normal group sections stained by hematoxylin and eosin (A). Normal skin close-up photograph, yellow arrow: thin epidermis with 1–3 cell layers, black arrow: fibroblast interspersed with collagen fibers, and asterisk: collagen bundles oriented wavy parallel to the skin surface (B). Representative histological images of UV (C1C4), PBS (D1D4), Exo1 (E1E4), Exo2 (F1F4), tretinoin (G1G4) group at different time points. W, week. Epidermal (H) and dermal thickness (I) changes of multiple groups at different time points (n=2; *p<0.05, vs UV group; #p<0.05, vs PBS group). Data are presented as mean (SD), calculated using two-way ANOVA with Turkey’s post test. Two biological replicates, each with three technical replicates, were used. W, week.
Figure 7
Figure 7
Effects of hypADSC-Exo on the abnormalities of dermis sections in photoaging skin. Representative photographs of normal group sections stained by Masson staining (A). Collagen qualification at different time points analyzed by Image J (n=2; *p<0.05, vs UV group; #p<0.05, vs PBS group). Data are presented as mean (SD), calculated using two-way ANOVA with Turkey’s post test. Two biological replicates, each with three technical replicates, were used. W, week (B). Changes in collagen density of UV (C1C4), PBS (D1D4), Exo1 (E1E4), Exo2 (F1F4), and tretinoin group (G1G4) over time. Representative images of two independent trials.
Figure 8
Figure 8
Effects of hypADSC-Exo on gene expression of collagen 1, 3 and MMPs. mRNA expression of collagen 1 and 3 genes of different groups at week 6 (n=5; *p<0.05, vs normal group) (A). mRNA expression of MMP-1, MMP-2, and MMP-3 genes among groups at week 6 (n=5; *p<0.05, vs normal group) (B). Data are presented as mean (SEM), calculated using Mann–Whitney test. Five biological replicates, each with a single technical replicate, were used.

References

    1. Farage MA, Miller KW, Berardesca E, Maibach HI. Clinical implications of aging skin: cutaneous disorders in the elderly. Am J Clin Dermatol. 2009;10(2):73–86. doi: 10.2165/00128071-200910020-00001 - DOI - PubMed
    1. Addor FAS. Beyond photoaging: additional factors involved in the process of skin aging. Clin Cosmet Invest Dermatol. 2018;11:437–443. doi: 10.2147/CCID.S177448 - DOI - PMC - PubMed
    1. Knuutinen A, Kokkonen N, Risteli J, et al. Smoking affects collagen synthesis and extracellular matrix turnover in human skin. Br J Dermatol. 2002;146(4):588–594. doi: 10.1046/j.1365-2133.2002.04694.x - DOI - PubMed
    1. Vierkötter A, Schikowski T, Ranft U, et al. Airborne particle exposure and extrinsic skin aging. J Invest Dermatol. 2010;130(12):2719–2726. doi: 10.1038/jid.2010.204 - DOI - PubMed
    1. Katta R, Kramer MJ. Skin and Diet: an Update on the Role of Dietary Change as a Treatment Strategy for Skin Disease. Skin Therapy Lett. 2018;23(1):1–5. - PubMed

LinkOut - more resources