. 2025 Jul 3;11(4):e200277.
doi: 10.1212/NXG.0000000000200277. eCollection 2025 Aug.

Retrospective Cohort Analysis of Clinical, Molecular, and Histopathologic Characteristics of 275 Patients With Nemaline Myopathy

Affiliations

Retrospective Cohort Analysis of Clinical, Molecular, and Histopathologic Characteristics of 275 Patients With Nemaline Myopathy

Clara Hildebrandt et al. Neurol Genet. .

Abstract

Background and objectives: Nemaline myopathy (NM) is a congenital myopathy with a wide severity spectrum, from severe, generalized muscle weakness and respiratory failure in the neonatal period to mild, distal weakness in young adulthood. Eleven genes have been definitively established to cause the condition. Although some recurrent variants have been identified, the overall correlation of genotype with clinical severity in NM remains poor. This poses challenges when counseling families about prognosis after a diagnosis of NM is made. Better clinical and molecular predictors of outcome are needed for clinical trial readiness.

Methods: A retrospective cohort analysis of 275 patients with a histopathologic diagnosis of NM and/or pathogenic variants in NM-associated genes was performed to identify relationships between early clinical findings and long-term outcomes, including need for respiratory and feeding support.

Results: Early clinical predictors of long-term outcomes were identified: patients with hypotonia at birth had increased odds of requiring gastrostomy tubes, and patients with respiratory distress at birth had increased odds of requiring both gastrostomy tubes and invasive ventilation. Individuals with ACTA1-NM were more likely to require feeding tubes and invasive ventilation in the first year of life compared with those with NEB-related NM, but the odds of requiring invasive ventilation were similar after the first year of age. Additional clinical information is presented by genotype and severity class.

Discussion: Neonatal findings of individuals with NM are correlated with long-term clinical outcomes, and there are some relationships between genotype and disease severity. Prospective longitudinal studies are needed to confirm these findings and evaluate for additional early clinical predictors of prognosis.


Conflict of interest statement

B.T. Darras has served as an ad hoc scientific advisory board member for Audentes Therapeutics, AveXis/Novartis Gene Therapies, Biogen, Pfizer, Sarepta, Vertex and Roche/Genentech; was a Steering Committee Chair for Roche FIREFISH and MANATEE studies and data safety monitoring board member for Amicus Inc. and Lexeo Therapeutics; he has no financial interests in these companies. He has received research support from the NIH/NINDS, the Slaney Family Fund for SMA, the Spinal Muscular Atrophy Foundation, CureSMA, and Working on Walking Fund and has received grants from Ionis Pharmaceuticals, Inc., for the ENDEAR, CHERISH, CS2/CS12 studies; from Biogen for CS11; and from AveXis, Sarepta Pharmaceuticals, Novartis (AveXis), PTC Therapeutics, Roche, Scholar Rock, and Fibrogen and has also received royalties for books and online publications from Elsevier and UpToDate, Inc. S. Iannaccone recieves research funding from NIH and DoD W81X WH 2010293, Cure SMA and industry (Astellas, RegenxBio, Capricor, Novartis, Biogen, Sarepta, PTC Therapeutics and Scholar Rock). She has served on medical advisory boards for Novartics, Biogen and Sarepta and as consultant for Genetech. L.H. Hayes reports research funding from Vertex Pharmaceuticals, Astellas Pharma, Novartis, and Biohaven Pharmaceuticals, and recieves consulting fees from Biohaven Pharmaceuticals. A.H. Beggs reports grants or contracts for studies of skeletal muscle and diagnosis and treatment of congenital myopathies from NIH, MDA (USA), A Foundation Building Strength, and the Chan Zuckerberg Initiative, and from AFM Telethon, Alexion Pharmaceuticals Inc., Avidity, Dynacure SAS, Kate Therapeutics, and Pfizer Inc. He has received consulting fees from Astellas Pharma, F. Hoffmann-La Roche, GLG, Guidepoint Global, and Kate Therapeutics; has received support for attending meetings from Kate Therapeutics and Muscular Dystrophy Association; holds equity in Kate Therapeutics and Kinea Bio; and is an inventor on a US patent describing a method for gene therapy of X-linked myotubular myopathy. The remaining authors report no disclosures relevant to the manuscript.Full disclosure form information provided by the authors is available with the full text of this article at Neurology.org/NG.

Figures

Figure 1
Figure 1. Ages at Onset and Diagnosis by Genotype and Clinical Severity Scores
Age at onset and age at diagnosis by genotype (A) and 2000 NM Classification Scheme (B). The vertical lines represent the interquartile range, and the horizontal line represents the median. (A) The median age at onset was 0.01 years for patients with NEB-NM (n = 95, IQR 0.01–0.5), ACTA1-NM (n = 77, IQR 0.01–0.07), TPM2-NM (n = 9, IQR 0.01–2.7), and TPM3-NM (n = 17, IQR 0.01–0.28). The median age at diagnosis for patients with NEB-NM was 2.0 years (n = 92, IQR 0.42–5.0), ACTA1-NM was 0.35 years (n = 74, IQR 0.1–3.5), TPM2-NM was 13.0 years (n = 7, IQR 2.5–50.0), and TPM3-NM was 1.3 years (n = 17, IQR 0.75–5.7). (B) The median age at onset was 0.01 years for patients with severe NM (n = 60, IQR 0.01–0.01), intermediate NM (n = 58, IQR 0.01–0.01), and typical/congenital NM (n = 112, IQR 0.01–0.25); 3.0 years for those with mild/juvenile NM (n = 22, IQR 2.0–4.25); and 46.0 years for those with adult-onset NM (n = 12, IQR 42–58). The median age at diagnosis for patients with severe NM was 0.08 years (n = 59, IQR 0.04–0.2), intermediate NM was 0.6 years (n = 57, IQR 0.76–8.75), typical/congenital NM was 2.6 years (n = 104, IQR 0.76–8.75), mild/juvenile NM was 11.0 years (n = 23, IQR 4.0–39.0), and adult-onset NM was 56.0 years (n = 12, IQR 45–62.8). IQR = interquartile range.
Figure 2
Figure 2. Survival and Time-to-Event Analyses of Censored Data by Diagnosis and Clinical Findings
(A) Survival of the overall cohort of patients with available information (dark line, n = 263), compared with survival of the general US population (gray line). Dashed lines represent 96% CI. Of survivors past the age of 60, 1 died of complications related to thyroid cancer and another passed in their sleep because of unknown causes. (B) Survival by genotype: no molecular cause identified (solid dark line, n = 50), NEB (dashed dark line n = 95), ACTA1 (solid gray line, n = 76), and TPM3 (dashed gray line, n = 18), among patients with available information. Of 15 patients with TPM3-NM still alive at last known follow-up, age at last follow-up ranged from 1 year to 36 years with an average of 15.6 years. Pairwise comparisons (using Benjamini-Hochberg correction to adjust for multiple testing) showed that the group without molecular diagnosis (18 of total 50 patients died) and those with NEB-NM (13 of 95 patients died) showed a difference in survival, with the NEB-NM group having higher rates of survival (p = 0.0076). (C) Survival by degree of respiratory assistance before 1 year of age: no respiratory assistance (solid dark line, n = 134), invasive respiratory assistance (dashed line, n = 51), and continuous positive airway pressure or bilevel positive airway pressure (dashed/dotted line, n = 11), among patients with available information. This analysis was based on 196 patients (5 excluded because of missing last follow-up/death time). (D) Survival by finding of respiratory failure at birth: no respiratory failure (dark line, n = 209) and presence of respiratory failure (gray line, n = 54), among patients with available information. Two hundred sixty-three patients were included in analyses (5 with missing information and 4 terminated or stillborn patients were excluded). (E) Time to complete or partial loss of ambulation of the cohort, in patients with available information (n = 212). Additional 53 patients had missing age at loss of ambulation or last follow-up and were excluded from analyses. A total of 153 patients were included in the analyses. Dashed lines represent 96% CI. These analyses omit 3 cases of TNNT1-NM.
Figure 3
Figure 3. Odds Ratio Analyses
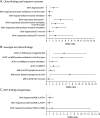
Odds ratios, modeled using the Fisher exact test, for relationships between clinical findings and long-term outcomes (A), genotype and clinical findings (B), and birth findings and genotype (C). Outcomes for each reported association are indicated on Y axes. Dots represent odds ratio, and lines represent 95% CI. Because multiple comparisons were conducted, the expected number of significant results by chance was compared with the number observed. With 18 comparisons and alpha set at 0.05, 0.9 comparisons would be expected to reject the null hypothesis (no difference in odds) by chance. The analysis found 7 comparisons whose 95% CIs exceeded the odds ratio of one, rejecting the null hypothesis. GT = gastrostomy tube.
Figure 4
Figure 4. Clinical Severity Scores Broken Down by Clinical Category and Genotype
The Amburgey scoring system related to the 2000 NM Classification Scheme (A) and genotype (B) (NEB-NM n = 80, median = 1.5, mean = 4.65; ACTA1-NM n = 53, median = 0, mean = 2.76; TPM2-NM n = 9, median = 0, mean = 3; TPM3-NM n = 14, median = 1, mean = 3.79; TNNT1-NM n = 3, median = 0, mean = 6.33; KLHL40-NM n = 0; KLHL41-NM n = 2, median = 6.5, mean = 3.5; LMOD3-NM n = 2, median = 3, mean = 3; CFL2-NM n = 2, median = 0, mean = 0). *p = 0.048, ****p < 0.0001, ns = not significant. The blue vertical lines represent the interquartile range, and the horizontal line represents the median. NM = nemaline myopathy.
Figure 5
Figure 5. Concordance Analysis of Alternate NM Classification Schemes
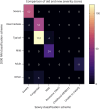
Comparison of the 2000 NM Classification Scheme and the updated Sewry NM Classification Scheme proposed in 2019. The 2 schemes are significantly correlated (p 0.0001). Color legend and numbers in each box indicate the number of overlapping cases for each severity class. NM = nemaline myopathy.
Figure 6
Figure 6. Clinical Presentations at Birth Among Infants Eventually Categorized According to the 2000 NM Classification Scheme
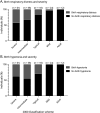
The relationship between birth respiratory distress (A) and birth hypotonia (B) with the 2000 NM Classification Scheme. NM = nemaline myopathy.

References

    1. Shy GM, Engel WK, Somers JE, Wanko T. Nemaline myopathy. Brain. 1963;86(4):793-810.doi: 10.1093/brain/86.4.793 - DOI - PubMed
    1. Conen PE, Murphe EG, Donohue WL. Light and electron miscroscopic studies of “myogranule”; in a child with hypotonia and muscle weakness. Can Med Assoc J. 1963;89:983-986. - PMC - PubMed
    1. Wallgren-Pettersson C, Beggs AH, Laing NG. 51st ENMC international workshop: nemaline myopathy. 13-15 June 1997, Naarden, The Netherlands. Neuromuscul Disord. 1998;8(1):53-56. - PubMed
    1. Ryan MM, Ilkovski B, Strickland CD, et al. Clinical course correlates poorly with muscle pathology in nemaline myopathy. Neurology. 2003;60(4):665-673.doi: 10.1212/01.wnl.0000046585.81304.bc - DOI - PubMed
    1. Ross JE, Flowers M, McNulty S, et al. Clinical validity of congenital myopathy genes determined by the ClinGen Congenital Myopathies Expert Panel. J Neuromuscul Dis. 2025;22143602251339369. doi: 10.1177/22143602251339369. - DOI - PubMed

LinkOut - more resources