

Predicting the Phenology of Herbivorous Insects
- PMID: 40661907
- PMCID: PMC12256772
- DOI: 10.1002/ece3.71734
Predicting the Phenology of Herbivorous Insects
Abstract
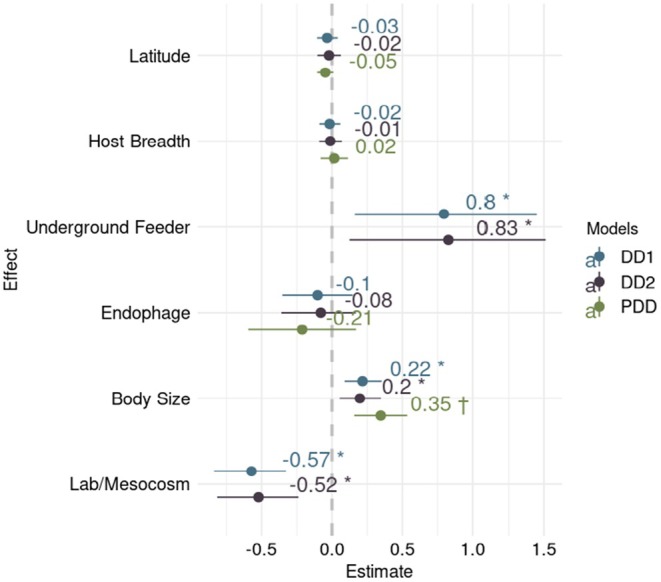
Models of herbivorous insect phenology can be used to make agriculture more sustainable and to better manage the effects of climate change on natural communities. The phenology of herbivorous insects depends on heat time, but exactly how it varies across populations and the causes of this variation are unclear. Here, with multilevel Bayesian models, we performed a comparative analysis of 601 published herbivorous insect phenology models. We found that variation in herbivorous insect phenology can be explained by variation in phylogenetic relatedness, adult body size, feeding site, host plant taxonomy, geographic location, and the approaches that researchers used for model parameterization. Contrary to previous analysis, we also found that the minimum temperature required for development varies across life stages in a way that could be adaptive. Our analysis demonstrates that by accounting for more information on the variation across insect populations and their environments, we can make better and more generalizable predictions of herbivorous insect phenology.
Keywords: degree days; integrative pest management; lower developmental threshold; multilevel Bayesian models; phylogenetic models; phytophagy; thermal requirements.
© 2025 The Author(s). Ecology and Evolution published by British Ecological Society and John Wiley & Sons Ltd.
Conflict of interest statement
The authors declare no conflicts of interest.
Figures


Similar articles
-
"A System That Wasn't Really Optimized for Me": Factors Influencing Autistic University Students' Access to Information.Autism Adulthood. 2025 Apr 3;7(2):171-184. doi: 10.1089/aut.2023.0139. eCollection 2025 Apr. Autism Adulthood. 2025. PMID: 40309024
-
Adapting Safety Plans for Autistic Adults with Involvement from the Autism Community.Autism Adulthood. 2025 May 28;7(3):293-302. doi: 10.1089/aut.2023.0124. eCollection 2025 Jun. Autism Adulthood. 2025. PMID: 40539213
-
The Lived Experience of Autistic Adults in Employment: A Systematic Search and Synthesis.Autism Adulthood. 2024 Dec 2;6(4):495-509. doi: 10.1089/aut.2022.0114. eCollection 2024 Dec. Autism Adulthood. 2024. PMID: 40018061 Review.
-
"In a State of Flow": A Qualitative Examination of Autistic Adults' Phenomenological Experiences of Task Immersion.Autism Adulthood. 2024 Sep 16;6(3):362-373. doi: 10.1089/aut.2023.0032. eCollection 2024 Sep. Autism Adulthood. 2024. PMID: 39371355
-
How lived experiences of illness trajectories, burdens of treatment, and social inequalities shape service user and caregiver participation in health and social care: a theory-informed qualitative evidence synthesis.Health Soc Care Deliv Res. 2025 Jun;13(24):1-120. doi: 10.3310/HGTQ8159. Health Soc Care Deliv Res. 2025. PMID: 40548558
References
-
- Arnold, C. Y. 1959. “The Determination and Significance of the Base Temperature in a Linear Heat Unit System.” Proceedings of the American Society for Horticultural Science 74: 430–445.
-
- Bentancourt, C. , Scatoni I. B., and Rodriguez J. J.. 1996. “Influencia de la Temperatura Sobre la Reproducción y el Desarrollo de Scrobipalpuloides Absoluta (Meyrick) (Lepidoptera, Gelechiidae).” Revista Brasileira de Biologia 56: 661.
-
- Bürkner, P.‐C. 2017. “brms: An R Package for Bayesian Multilevel Models Using Stan [Computer Software].” http://www.jstatsoft.org/v80/i01/.
-
- Campbell, A. , Frazer B. D., Gilbert N., Gutierrez A. P., and Mackauer M.. 1974. “Temperature Requirements of Some Aphids and Their Parasites.” Journal of Applied Ecology 11, no. 2: 431–438. 10.2307/2402197. - DOI
LinkOut - more resources
Full Text Sources
