

A novel nomogram for survival prediction in renal cell carcinoma patients with brain metastases: an analysis of the SEER database
- PMID: 40661946
- PMCID: PMC12256520
- DOI: 10.3389/fimmu.2025.1572580
A novel nomogram for survival prediction in renal cell carcinoma patients with brain metastases: an analysis of the SEER database
Abstract
Background: Existing research on the development of prognostic models for renal cell carcinoma (RCC) patients with brain metastases (BM) remains limited. This study aimed to develop a prognostic prediction model for RCC patients with BM and to identify critical factors influencing clinical outcomes.
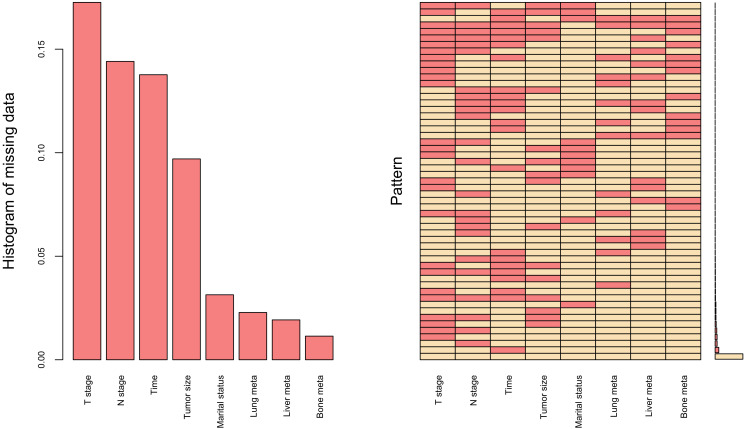
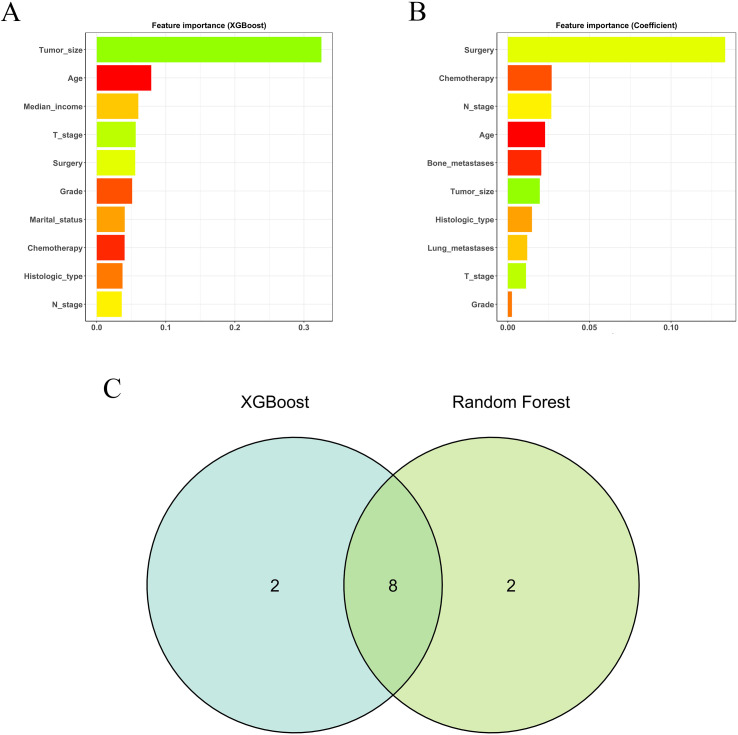
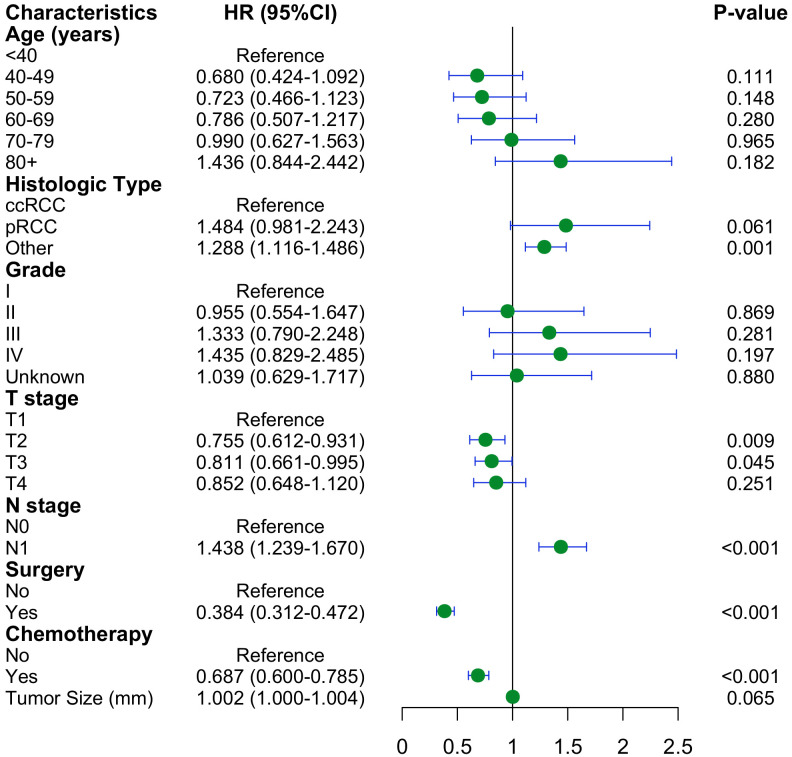
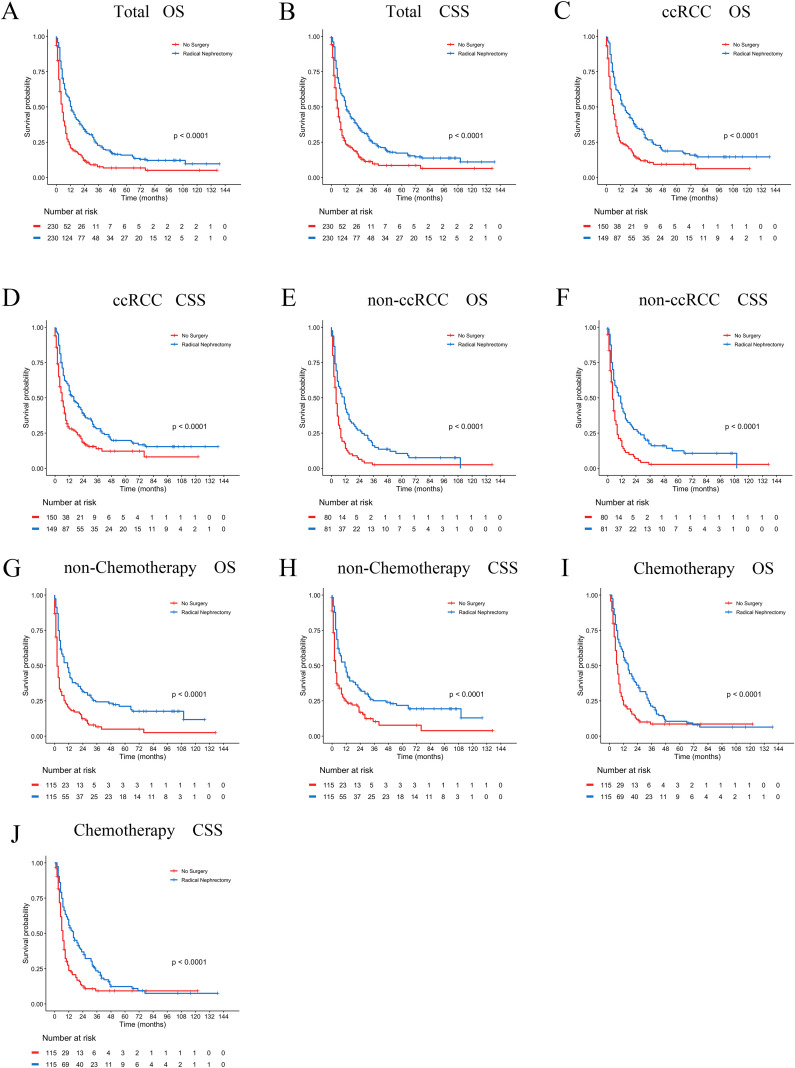
Methods: Patients diagnosed with BM between 2010 and 2019 were identified and extracted from the Surveillance, Epidemiology, and End Results (SEER) database. Potential risk factors were initially screened applying the eXtreme Gradient Boosting (XGBoost) and Random Forest (RF) machine learning algorithms. Subsequently, multivariate COX regression analysis was performed to identify independent risk factors for constructing the predictive nomogram. Nomogram performance was comprehensively evaluated based on Harrell's concordance index (C-index), receiver operating characteristic (ROC) curve analysis, calibration plots, and decision curve analysis (DCA). The SHapley Additive exPlanations (SHAP) method was employed to demonstrate the ranking of feature importance affecting patient prognosis at different time points. Moreover, we conducted propensity score matching (PSM) and Kaplan-Meier (K-M) survival analysis to compare clinical outcomes between surgical and non-surgical treatment subgroups.
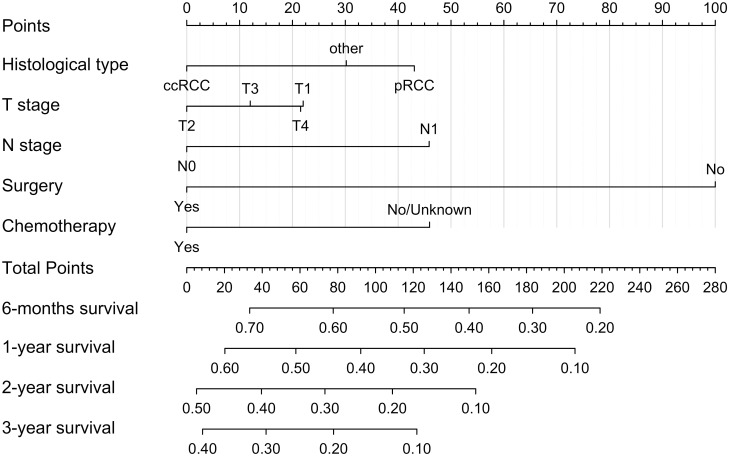
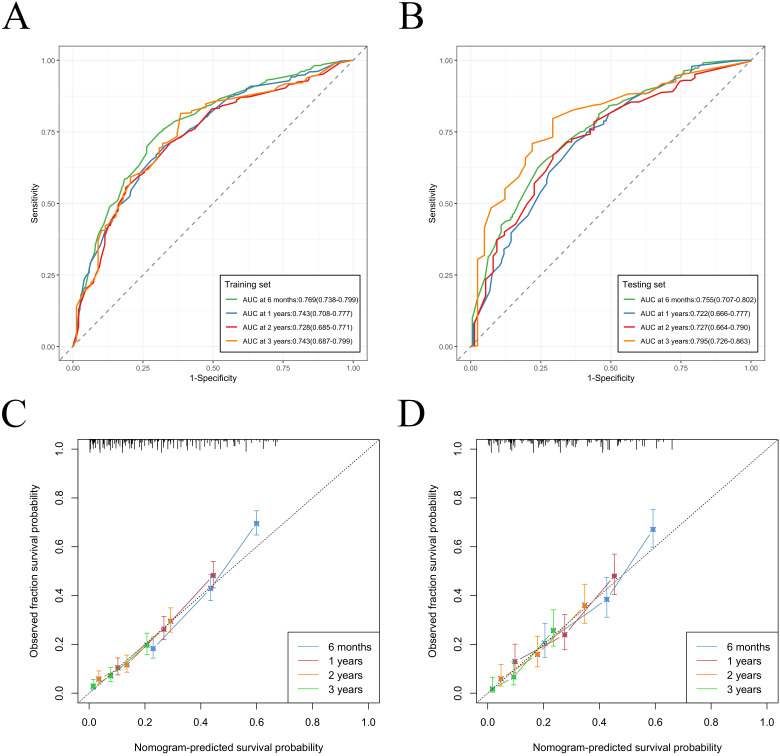
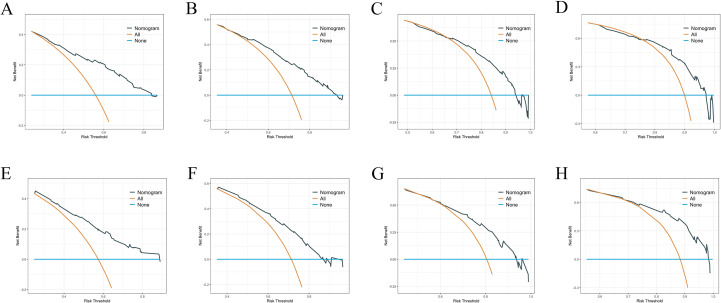
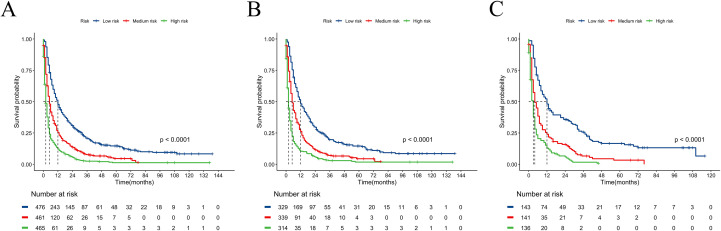
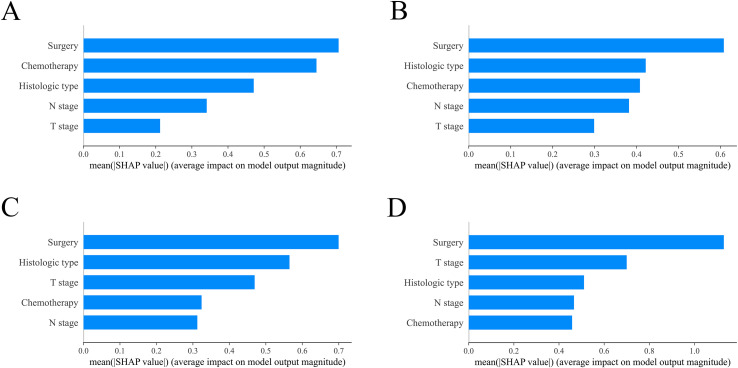
Results: In total, 982 patients were assigned to the training cohort and 420 to the validation cohort. The constructed nomogram included four clinical variables: histologic type, T stage, N stage, surgery and chemotherapy. The AUC, C-index, calibration curves, and DCA curves showed excellent performance of the nomogram. In addition, the SHAP values indicated that surgical treatment was the most important prognostic risk factor for OS at 6-months, 1-year, 2-years, and 3-years. After further balancing the baseline characteristics between the surgical and non-surgical groups using PSM, we observed that patients with BM who underwent surgical intervention showed significantly better survival outcomes across all subgroups compared to non-surgical patients, though unmeasured confounders may contribute to this association.
Conclusion: We developed a novel nomogram for predicting prognostic factors in RCC patients with BM, offering a valuable tool to support accurate clinical decision-making. Our research also confirmed that surgical intervention was significantly associated with improved survival outcomes for patients with BM.
Keywords: SEER; brain metastases; nomogram; renal cell carcinoma; surgery.
Copyright © 2025 Wang, Wang, Feng, Li, Xu, Lu, Wang and Li.
Conflict of interest statement
The authors declare that the research was conducted in the absence of any commercial or financial relationships that could be construed as a potential conflict of interest.
Figures
Similar articles
-
Comparison of Two Modern Survival Prediction Tools, SORG-MLA and METSSS, in Patients With Symptomatic Long-bone Metastases Who Underwent Local Treatment With Surgery Followed by Radiotherapy and With Radiotherapy Alone.Clin Orthop Relat Res. 2024 Dec 1;482(12):2193-2208. doi: 10.1097/CORR.0000000000003185. Epub 2024 Jul 23. Clin Orthop Relat Res. 2024. PMID: 39051924
-
Individualized Prediction of Overall Survival Time for Patients with Primary Intramedullary Spinal Cord Astrocytoma: A Population-Based Study.World Neurosurg. 2025 Jan;193:1106-1116. doi: 10.1016/j.wneu.2024.10.092. Epub 2024 Nov 21. World Neurosurg. 2025. PMID: 39510174
-
A prognostic nomogram and risk classification system of elderly patients with extraosseous plasmacytoma: a SEER database analysis.J Cancer Res Clin Oncol. 2023 Dec;149(20):17921-17931. doi: 10.1007/s00432-023-05492-6. Epub 2023 Nov 13. J Cancer Res Clin Oncol. 2023. PMID: 37955685 Free PMC article.
-
Cost-effectiveness of using prognostic information to select women with breast cancer for adjuvant systemic therapy.Health Technol Assess. 2006 Sep;10(34):iii-iv, ix-xi, 1-204. doi: 10.3310/hta10340. Health Technol Assess. 2006. PMID: 16959170
-
Impact of residual disease as a prognostic factor for survival in women with advanced epithelial ovarian cancer after primary surgery.Cochrane Database Syst Rev. 2022 Sep 26;9(9):CD015048. doi: 10.1002/14651858.CD015048.pub2. Cochrane Database Syst Rev. 2022. PMID: 36161421 Free PMC article.
References
MeSH terms
LinkOut - more resources
Full Text Sources
Medical
Miscellaneous